Asset Management Field Data Collection Tools
Case Studies of Select Transportation Agencies
August 2020
FHWA-HEP-19-032

Prepared for:
Office of Planning
Federal Highway Administration
U.S. Department of Transportation
Notice
This document is disseminated under the sponsorship of the Department of Transportation in the interest of information exchange. The United States Government assumes no liability for the contents or use thereof.
The United States Government does not endorse products or manufacturers. Trade or manufacturers’ names appear herein solely because they are considered essential to the objective of this report.
| REPORT DOCUMENTATION PAGE |
Form Approved
OMB No. 0704-0188
|
| Public reporting burden for this collection of information is estimated to average 1 hour per response, including the time for reviewing instructions, searching existing data sources, gathering and maintaining the data needed, and completing and reviewing the collection of information. Send comments regarding this burden estimate or any other aspect of this collection of information, including suggestions for reducing this burden, to Washington Headquarters Services, Directorate for Information Operations and Reports, 1215 Richmond Highway, Suite 1204, Arlington, VA 22202-4302, and to the Office of Management and Budget, Paperwork Reduction Project (0704-0188), Washington, DC 20503. |
| 1. AGENCY USE ONLY (Leave blank) |
2. REPORT DATE
August 2020 |
3. REPORT TYPE AND DATES COVERED
Final Report |
4. TITLE AND SUBTITLE
Asset Management Field Data Collection Tools:
Case Studies of Select Transportation Agencies |
5a. FUNDING NUMBERS
HW2LA5 SF025
|
6. AUTHOR(S)
Bryan Lee, Scott Gilman |
5b. CONTRACT NUMBER |
7. PERFORMING ORGANIZATION NAME(S) AND ADDRESS(ES)
U.S. Department of Transportation
John A. Volpe National Transportation Systems Center
55 Broadway
Cambridge, MA 02142-1093
|
8. PERFORMING ORGANIZATION REPORT NUMBER |
9. SPONSORING/MONITORING AGENCY NAME(S) AND ADDRESS(ES)
U.S. Department of Transportation
Federal Highway Administration
1200 New Jersey Avenue, SE
Washington, DC 20590
|
10. SPONSORING/MONITORING AGENCY REPORT NUMBER
FHWA-HEP-21-010 |
| 11. SUPPLEMENTARY NOTES |
12a. DISTRIBUTION/AVAILABILITY STATEMENT
This document is available to the public on the FHWA website at https://www.gis.fhwa.dot.gov/.
|
12b. DISTRIBUTION CODE |
13. ABSTRACT (Maximum 200 words)
In supporting State Departments of Transportation (DOTs) and metropolitan planning organizations (MPOs) in using Geographic Information Systems, the Federal Highway Administration (FHWA) is publishing this Case Study Report focusing on the use of data collection technologies by transportation agencies to collect and manage geospatial asset data. To gather information for this report, the U.S. DOT Volpe National Transportation Systems Center interviewed four State DOTs and developed a case study focusing on their experiences. The purpose of this document is for State DOTs and MPOs to consider the approach that these agencies have used in employing data collection for asset management to reduce a duplication of efforts and learn best practices from peer agencies. |
14. SUBJECT TERMS
Geographic Information Systems (GIS), field data collection, asset management, data management, data collection |
15. NUMBER OF PAGES
|
| 16. PRICE CODE |
17. SECURITY CLASSIFICATION OF REPORT
Unclassified |
18. SECURITY CLASSIFICATION OF THIS PAGE
Unclassified |
19. SECURITY CLASSIFICATION OF ABSTRACT
Unclassified |
20. LIMITATION OF ABSTRACT
Unlimited |
NSN 7540-01-280-5500
Standard Form 298 (Rev. 2-89)
Prescribed by ANSI Std. 239-18
298-102
Acknowledgements
The Federal Highway Administration and the U.S. Department of Transportation Volpe National Transportation Systems Center would like to thank the participating agencies and interviewees that made this case study report possible. The participating agencies are listed below and the particular individuals who took the time to be interviewed for this report are listed in Appendix A: Case Study Participants.
- District Department of Transportation.
- Indiana Department of Transportation.
- Vermont Agency of Transportation.
- Wisconsin Department of Transportation.
Contents
List of Abbreviations
| Abbreviation |
Term |
| AASHTO |
American Association of State Highway and Transportation Officials |
| API |
Application Programming Interface |
| ARAN |
Automated Road Analyzer |
| DOT |
Department of Transportation |
| DDOT |
District Department of Transportation |
| FAST Act |
Fixing America’s Surface Transportation Act |
| FHWA |
Federal Highway Administration |
| GIS |
Geographic Information Systems |
| GIS-T |
Geographic Information Systems for Transportation |
| INDOT |
Indiana Department of Transportation |
| LRS |
Linear Referencing System |
| MAP-21 |
Moving Ahead for Progress in the 21st Century Act |
| MUTCD |
Manual of Uniform Traffic Control Devices |
| TAM |
Transportation Asset Management |
| TAMP |
Transportation Asset Management Plan |
| USDOT |
United States Department of Transportation |
| VTrans |
Vermont Agency of Transportation |
| WisDOT |
Wisconsin Department of Transportation |
1. Introduction
The Moving Ahead for Progress in the 21st Century Act (MAP-21) requires that State Departments of Transportation (DOT) develop, implement, and maintain a risk-based asset management plan for the National Highway System (NHS) to improve or preserve the condition of the assets and the performance of the system. Transportation Asset Management Plans (TAMP) act as a focal point for information about the assets, their management strategies, long-term expenditure forecasts, and business management processes. However, asset management plans are only as good as the asset inventories that inform the long-term expenditure forecasts. With the growing demand for quality asset inventories, State DOTs have explored opportunities to implement innovative, efficient, and dependable data collection methods and tools.
1.1 Background
FHWA Strategic Plan Goals and Objectives
- Safety – Reduce transportation-related fatalities and serious injuries across the transportation system.
- Infrastructure – Invest in infrastructure to ensure mobility and accessibility and to stimulate economic growth, productivity, and competitiveness for American workers and businesses.
- Innovation – Lead in the development and deployment of innovative practices and technologies to improve the safety and performance of the Nation’s transportation system.
- Accountability – Serve the Nation with reduced regulatory burden and greater efficiency, effectiveness, and accountability.
In 2018, the United States Department of Transportation (USDOT) published a Strategic Plan.1 The Plan included goals that address safety, infrastructure, innovation, and accountability within the Federal Highway Administration (FHWA). At the same time, FHWA has promoted the use of GIS among State DOTs to more efficiently manage the country’s transportation system and achieve the Department’s strategic goals. With a wide range of uses, applications of GIS can support all four of FHWA’s strategic goals. Asset management collection tools for field data specifically target three of the goals: infrastructure, innovation, and accountability. Field data collection techniques have matured to the point where they are reliable enough to be fully integrated into the workflow of transportation agencies across the country. The case studies detailed in this report focus on innovations that foster more efficient business practices in support of maintaining the infrastructure for which the agencies are responsible.
1.2 Purpose and Methodology
This report is part of the GIS in Transportation case study series. FHWA designed the series to highlight exemplary uses of GIS across State DOTs and metropolitan planning organizations (MPOs). The series allows other agencies to stay apprised of current practices in the field, learn about best practices for GIS applications, and become familiar with innovative practices in the GIS for transportation field. The case studies also provide agencies with points of contact at other agencies for help with implementing similar solutions.
The case studies are intended to answer the following research questions to help transportation agencies interested in implementing data collection for asset management:
- What technologies are available for asset management data collection? How do States choose tools and methods to collect asset inventories?
- How do States successfully implement such tools through stakeholder engagement and technology?
- What challenges do States face, and how have they overcome them?
The GIS in Transportation Program identified asset management field data collection tools as an area of growing interest among State DOTs and MPOs through the GIS for Transportation (GIS-T) 2019 Symposium Survey administered by American Association of State Highway and Transportation Officials (AASHTO).
Through the same AASHTO survey, the GIS in Transportation Program team identified several State agencies that have demonstrated experience leveraging field data collection tools for asset management. The team conducted further research into the list of transportation agencies identified and selected agencies that had significant experience with field data collection tools. The following agencies were willing and available for interviews:
- District Department of Transportation (DDOT).
- Indiana Department of Transportation (INDOT).
- Vermont Agency of Transportation (VTrans).
- Wisconsin Department of Transportation (WisDOT).
Representatives from each of the identified transportation agencies were generous enough to provide one hour of their time for a phone discussion with the research team. Agency representatives were the most knowledgeable staff on how mobile applications are employed within their departments. The research team developed a standardized interview guide, found in Appendix B, to use for each of the interviews. This allowed the research team to guide each interview consistently among agencies and produce consistent information that can be compared between respondents.
1.3 Asset Management at Transportation Agencies
Asset management in the transportation industry is a relatively new concept. MAP-21 defines asset management as “a strategic and systematic process of operating, maintaining, and improving physical assets, with a focus on engineering and economic analysis based on quality information, to identify a structured sequence of maintenance, preservation, repair, rehabilitation, and replacement actions that will achieve and sustain a desired state of good repair over the lifecycle of the assets at minimum practicable cost” (23 U.S.C. 101(a)(2), MAP-21 § 1103).2 The core principles of asset management provide a solid foundation for programs that optimize the performance and cost-effectiveness of transportation facilities. At its core, asset management is a business process. The application of asset management principles often requires changing decisionmaking processes at every level in an organization to incorporate detailed asset data and measurable performance goals. Transportation asset management is focused on the transportation infrastructure and its use in directly impacting the following three goals:
- Keeping the infrastructure in as good or better condition than it is now;
- Developing and implementing a logical capital improvement plan; and
- Containing the costs of planning, building, operating, and maintaining the facilities.
Transportation asset management allows for greater accountability and transparency in an agency’s decisions and provides a new perspective on managing transportation infrastructure.
1.4 Field Data Collection for Transportation Agencies
In order to support asset management, agencies must collect, store, manage, and analyze large amounts of data in an effective and efficient manner. The approach transportation agencies take to carry this out has evolved along with advances in technology, such as mobile computing, advanced sensors, distributed databases, spatial technologies, and machine learning. These technologies have enabled the data collection and integration procedures necessary to support the comprehensive analysis and evaluation processes needed for asset management.
↑ Return to Top
↑ Return to Table of Contents
2. Agency and Project Profiles
Interviews with District DOT, Indiana DOT, Vermont Agency of Transportation, and Wisconsin DOT explored the ways these agencies use field data collection tools for asset management. Each of these agencies uses GIS tools to engage with and communicate information to internal and external stakeholders. Some agencies use GIS tools for field data collection, while others use GIS tools primarily to post-process existing datasets. The unique stakeholders and goals of each interviewee shaped their approach to GIS asset management data collection.
These profiles identify key components of each agency’s approach to asset management data collection, including basic information on their projects, agency structures, and the challenges they faced in making data public.
2.1 District Department of Transportation (DDOT)
DDOT Agency Profile
Transportation system at a glance
- Over 3,400 lane-miles of roadway
- Over 2,000 types of road signs
Data collection project
- Signworks is a custom application that allows DDOT to manage its sign inventory and request new or updated signage.
Agency contact
- James Graham, GIS and Applications Manager
Approximately six years ago, a series of news stories drew attention to a pattern of unfair ticketing brought on by Washington, D.C.’s many confusing or contradictory parking signs. As a result, DDOT’s Research Chief Information Officer (RCIO) made correcting these signs a high priority. At that time, sign management was a paper-based process and DDOT lacked an accurate, comprehensive sign dataset that would allow staff to identify conflicting signs.
Because signs are a complex asset with over 2,000 unique types, DDOT’s Information Technology department conducted market research to identify a potential solution. The ideal solution would leverage GIS and integrate with the DDOT linear referencing system (LRS). It soon became clear that no off-the-shelf geospatial solution could help them inventory and correct sign conflicts. DDOT’s group of five full-time GIS staff and two software developers, one full-time and one contractor, undertook the task of developing Signworks, a custom LRS-driven approach to sign asset management and parking analysis.
Signworks is composed of two applications, an inventory manager application and a request application. The inventory manager application allows users to view sign data by clicking on a map and, for authorized users, to edit or correct the sign’s data. The request application allows an authorized user to create a request for any type of change to a DDOT sign. The applications are designed to help everyone involved in sign management by standardizing the cycle of sign management, from creating a new sign request to maintaining or changing an existing sign. Combined, the two applications will allow DDOT to develop a comprehensive, standardized, and authoritative sign inventory and ensure that all future signs are compliant with agency standards. Currently, Signworks is a browser-based asset tool; however, DDOT plans to make the tool a mobile application for field data collection in the future.
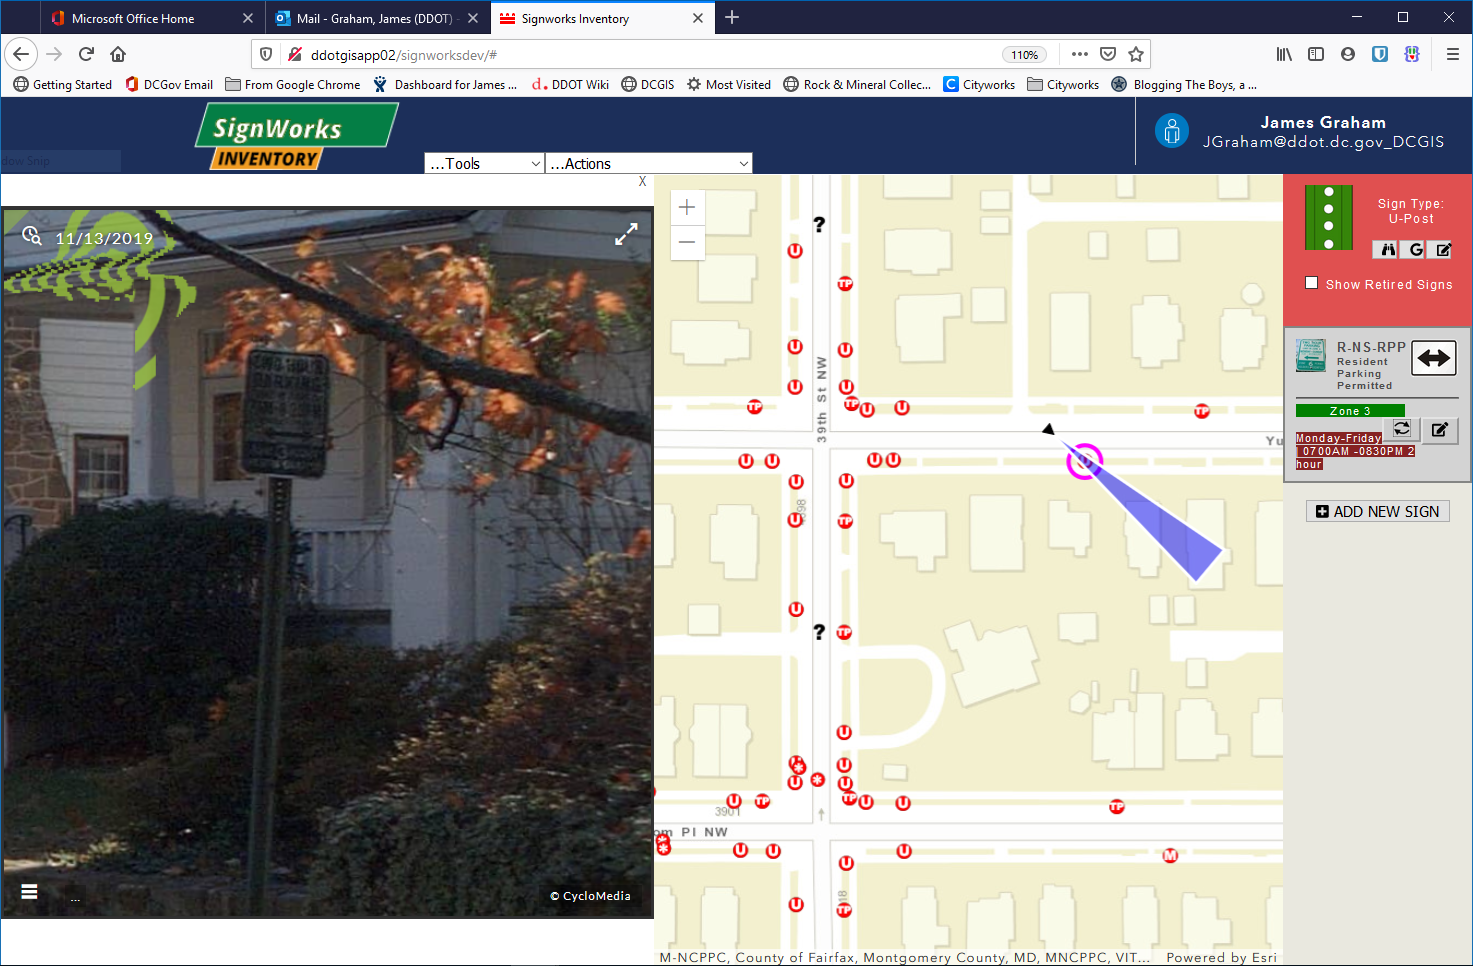
Figure 1. Illustration. The Signworks inventory manager allows users to see the location of a street sign and click on it to see an image and description of the sign. Source: DDOT.
Over the course of developing Signworks, the project team identified several technical challenges. One of the major technical challenges was the need for custom programming to work between various application programming interfaces (APIs), including Esri’s Javascript and Location Referencing API and Cyclomedia’s API for querying street view imagery. Developing an appropriate database structure proved another challenge, as the database had to store more than 2,000 unique sign types for use in both the request application and the inventory manager application.
The development team encountered organizational challenges as well. The IT department supports the entire agency, which puts it in an ideal position to see agencywide problems such as a lack of a standardized, data-centric workflow and update process for signs. However, migrating staff to Signworks remains a challenge. Paper-based systems, though inefficient, offer maximum flexibility when things get complicated—especially when installing or maintaining signs. From the field installer’s vantage point, it is difficult to see the agencywide problems that a paper-centric system has caused. Some users have also expressed skepticism about adopting new technology, and managers are wary of adopting a new system that alters the way they evaluate and manage their team. Despite these challenges, the IT department has made significant progress through clearly communicating the individual and agencywide benefits of Signworks to both individual users and agency leadership.
An important takeaway from this project is the importance of including stakeholders in the design and planning process. After an initial request from field installation teams, IT began developing the tool on their own, which may have led to more resistance in the adoption phase than if users had been continually involved in prototyping the tool. Furthermore, the development and adoption process would have benefited from a permanent champion in DDOT’s leadership to see the project through to completion. Despite these challenges, overall DDOT has identified Signworks as a success. DDOT staff found that Signworks saves time in the sign management process.
2.2 Indiana Department of Transportation (INDOT)
INDOT Agency Profile
Transportation system at a glance
- Nearly 200,000 lane-miles of roadway
- Over 19,500 bridges
- Over 75,000 culverts (between 12” and 48”)
Data collection project
- INDOT used Esri tools to collect geospatial data on all of its culverts across the State
Agency contact
- Kevin Munro, Statewide Geospatial Manager
Spurred by the Fixing America’s Surface Transportation (FAST) Act, INDOT sought ways to improve their inventory of pavements, bridges, culverts, and other assets. With reliable and efficient processes in place to evaluate and inventory pavements and bridges, INDOT focused its efforts on collecting culvert data. INDOT owns approximately 75,000 culverts statewide. Their previous efforts at inventorying culverts were sporadic, which led to culvert data being stored in multiple locations and formats. INDOT recognized the need for a single, standardized, authoritative culvert dataset and sought a mobile application.
Historically, INDOT used a combination of approaches to inventory and evaluate culverts. These included ArcPad, stationing and offset on the LRS, and data from construction plans. INDOT’s Office of Technical Services developed a data model suitable for tracking all drainage assets within the right of way and deployed it to the workforce using Collector for ArcGIS. After some small but successful project development with these tools, INDOT decided to implement Esri’s Collector and Survey123 applications to collect inventory and condition data and report deficiencies to its work management system. Esri’s Collector application is a mobile data collection app that makes it easy to capture accurate data and return it to the office. Collector’s intuitive interface enables field workers of all experience levels with GIS to capture and return accurate field data that integrates seamlessly into ArcGIS. Survey123 is a form-centric solution for creating, sharing, and analyzing field surveys via web or mobile devices. The Technical Services staff had some practical experience using the two apps and had also learned about them by attending Esri workshops and presentations at the annual GIS-T and Transportation Research Board conferences.
INDOT noted that the greatest challenges in implementing the tools was controlling the content, developing data models, and establishing and measuring the workflow execution. The project team developed manuals and trainings to ensure accurate data collection. Users also identified issues in areas without consistent cellular connectivity. Additionally, the team experienced issues with moving enterprise data to the cloud and back, which caused data loss in some instances.
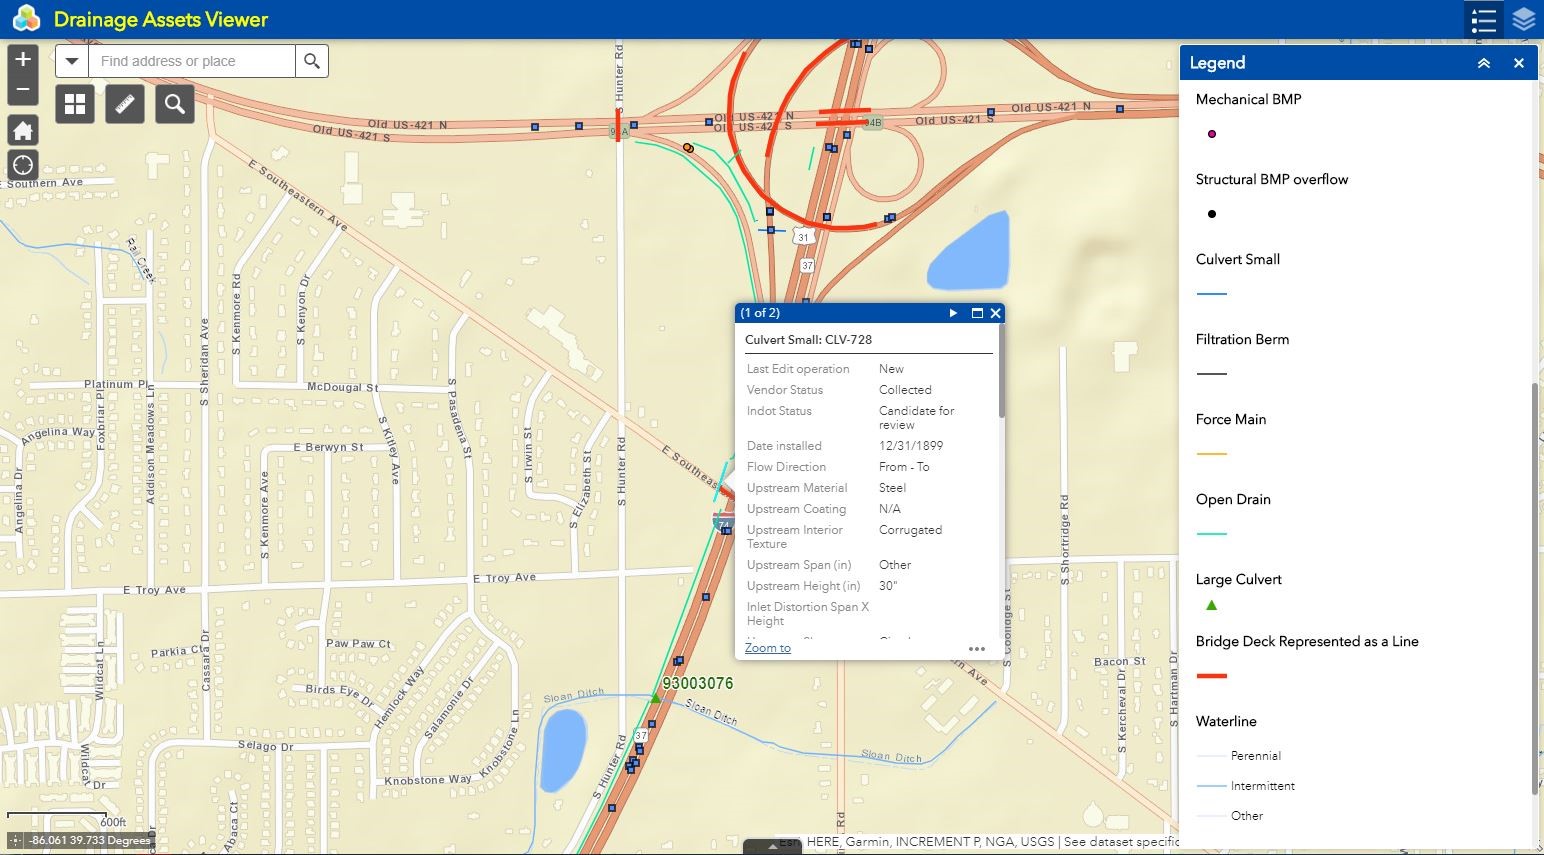
Figure 2. Illustration. INDOT’s Drainage Assets Viewer application contains a mix of assets that move water through INDOT’s right of way or structures that span them. In this image, a culvert is selected.
One valuable lesson learned is the importance of incorporating accountability as part of data governance through a well-defined model and controlling users’ ability to submit information and change the data model. The development team also learned the importance of communicating the benefits of the new system to stakeholders instead of dwelling on the adoption costs.
Although the agency has experienced some adoption challenges, overall, the new tools have proven successful and users have provided mostly positive feedback. In addition, INDOT uses these applications to collect data on assets other than culverts as well.
2.3 Vermont Agency of Transportation (VTrans)
VTrans Agency Profile
Transportation system at a glance
- Over 29,000 lane-miles of roadway
- Over 2,700 bridges
- Approximately 70,000 signs, with over 120 unique types
Data collection project
- VTrans collected sign data using right-of-way imagery and machine learning for object detection
Agency contact
- Jonathan Nelson, Data & Information Management Unit Lead
VTrans’s Data Services section is located within the agency’s Asset Management Bureau. They are responsible for maintaining inventory and condition data for over 100,000 transport assets, with a focus on data management, customer endpoint services, and visualizations.
In the past, Data Services had one full-time employee dedicated to maintaining a sign database. The employee manually updated the database primarily by using project plans. This approach was time intensive and made it impossible to keep the sign inventory current. Outdated data was a problem for several groups in VTrans. The Asset Management Bureau and the Policy, Planning, and Research Bureau are responsible for corridor management, including assembling project data packages and programming projects into the future for strategic corridors. This includes knowing where signs are outdated and predicting where new signs will be needed. The Maintenance and Operations Bureau also relies on sign data to address knockdowns and manage work orders. Traffic investigators also use sign data when investigating intersections with safety complaints or a high accident rate.
Given these challenges, VTrans began exploring other opportunities for generating and maintaining a traffic sign inventory. Fortuitously, a graduate student intern at VTrans overheard the asset management team talking about potential uses for right-of-way imagery, which was already being collected to serve a variety of other State needs. This led to a partnership with computer science professor, Safwan Wshah, who researches artificial intelligence for object detection at the University of Vermont (UVM).
VTrans, in collaboration with the UVM’s Vermont Artificial Intelligence Lab, began working on a deep learning project for detecting, classifying, and geolocating traffic signs from right-of-way imagery collected annually across the State’s roadway network. The effort focuses on collecting the Manual of Uniform Traffic Control Devices (MUTCD) code and location. The images, collected with an Automated Road Analyzer (ARAN) survey vehicle, already have geographical coordinates assigned to them by the vehicle. The object detection system learns about vehicle distance to the signs in the imagery from an annotation developed by UVM and VTrans. Once the system evaluates imagery, it provides a confidence level for sign identification and flags cases where confidence levels fall below a user-set threshold. Currently, the project is still in development and only in operation by staff at UVM with the end goal of transfer to VTrans staff once the system can be run independently.

Figure 3. Illustration. VTrans’s automated sign detection process, from data collection to sign detection.
The development team has encountered several situations that present a challenge to the image detection algorithm. For several rare sign types, the team has had difficulty finding enough training images to allow the algorithm to recognize them. Photos in which signs are obstructed pose a challenge to image detection. Sign assemblies, which often contain over 20 individual signs, present another challenge to image detection. Finally, the algorithm has difficulty detecting change over time; for example, when a sign is moved due to construction. The team is working on techniques for annotating the images and training the algorithm to accurately handle these situations.
A final technical challenge is the amount of time it takes to collect and process the imagery. VTrans is unable to collect right-of-way imagery for the entire network every year. This limits the ability to keep the database up to date. Furthermore, after collection, the images take about six months to process. As a result, the most current information in the database is at least a year old.
The new database will have several end users with different needs, which presents a stakeholder coordination challenge. Some groups, such as safety analysts, require detailed data on the location and attributes of individual signs. Other groups, such as corridor management planners, only need the general characteristics of all signs on a corridor, such as the number of signs or average sign age. These groups would prefer to have a less detailed data model that could be updated more frequently. To resolve users’ differing needs, the development team has met with end users to design a database that will allow users to accomplish their goals, even if it is not a perfect solution for everyone. The team is also working on how to enrich the new dataset with existing data sources to reduce the number of attributes that need to be detected in the machine learning process.
Overall, the system has received support from end users, although there are skeptics who doubt the quality of the final product or if it will meet their needs. To address this, the development team has stressed in its communications that the final product will not be perfectly accurate or suited to every user need, but it will be much better than the data that is currently available.
In hindsight, the development team would have chosen a simpler asset, such as guardrails or end terminals, to use as a pilot for this technology. With over 120 unique sign types used in Vermont, signs are a uniquely complex asset that make it challenging to train an object detection algorithm. The team also stresses that similar projects will take more time than originally planned due to the inevitability of discovering complex problems along the way. The team’s partnership with UVM has been instrumental in their success, and they would advise other agencies undertaking similar projects to partner with research institutions, universities, and vendors.
2.4 Wisconsin Department of Transportation (WisDOT)
WisDOT Agency Profile
Transportation system at a glance
- Over 239,000 lane-miles of roadway
- Over 14,000 bridges
- Over 62,000 culverts
Data collection project
- WisDOT used Esri mobile apps to collect culvert data
Agency contacts
- Lisa Morrison, Section Chief for Enterprise Data Services
- Amy Brooks, Highway Maintenance Engineer
- Adam Feidt, GIS Enterprise Architect
The Wisconsin Department of Transportation maintains a transportation system that includes over 239,000 lane-miles, over 14,000 bridges, and over 62,000 culverts.
Previously, each of WisDOT’s regional offices had their own manual processes for culvert data collection. This required sharing data between the regions in different formats, making culvert management a slow and work-intensive process. A staff member in the North Central Region saw an opportunity for regions to streamline their workflow with a standardized process and data format across the State. The North Central Region piloted a culvert data collection process using Collector and Survey123, available with WisDOT’s enterprise Esri license on iPads. The applications permitted field data collection of culvert inspections collecting data such as pipe size, material, roadway condition above the culvert, drainage, and condition rating of the culvert. After North Central successfully completed its pilot project, WisDOT’s Bureau of Highway Maintenance initiated a statewide project to use Collector and Survey123 in a standardized culvert data collection process.
Because this initiative required coordinating among regions that previously had their own processes, the implementation demanded significant stakeholder coordination. Firstly, IT had to manage the business area expectations of what the software could do. Stakeholders had many creative ideas for collecting data, but they were limited by Collector’s functionality since they decided to opt for an out-of-the-box, rather than custom, solution. Developing a standard data model also proved challenging. The five regions had different ideas as to what attributes were important to collect for each culvert. Eventually, the regions had to compromise and agree on what was best for this program.
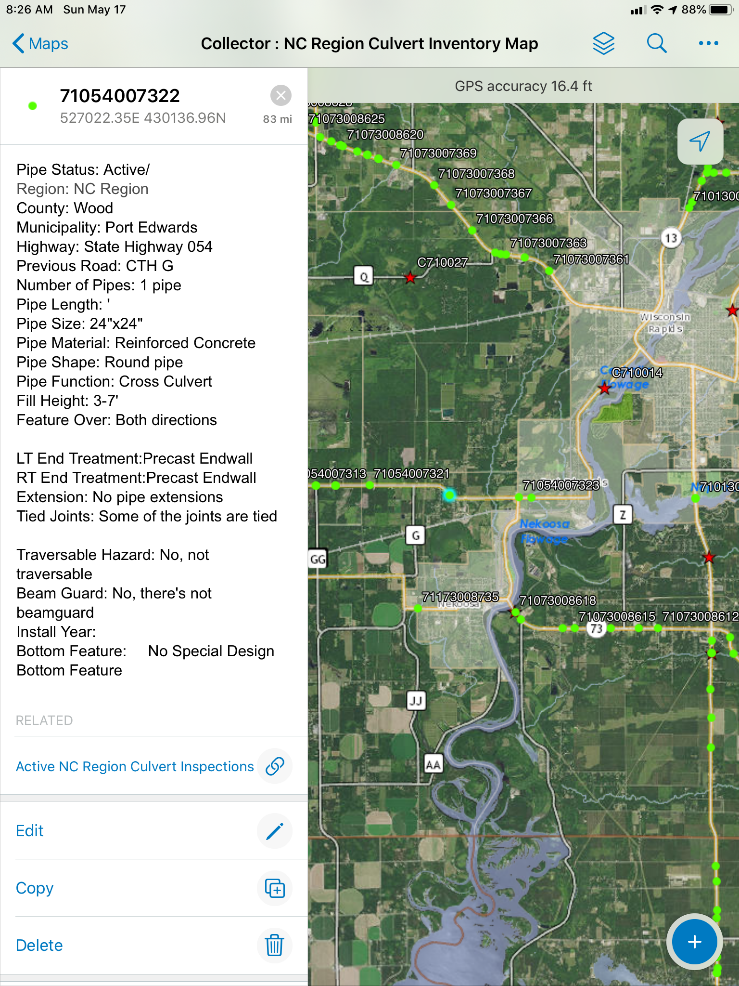
Figure 4. Illustration. WisDOT’s Collector app allows users to locate a culvert on the map and see and edit its attributes.
During data collection, the project team encountered several technical challenges. The team noticed inconsistencies in data collection, especially for attributes like culvert condition that are based on subjective, visual inspection. WisDOT is developing additional training and visual guides to calibrate inspectors’ responses statewide.
The team also encountered a major technical challenge with data collection in areas with unreliable cellular service. To solve this problem, WisDOT’s Bureau of Information Technology Service-GIS Core Services Core unit developed a workflow that allowed field data to be collected while disconnected from the WisDOT network. At times, the disconnected data collection efforts failed to sync with the original source. In order to recover these field data remotely, GIS Core Services worked with Esri technical service to develop a workflow to get data off a device that was collected offline. GIS Core Services, located at WisDOT’s central office, also found it difficult to provide remote technical support for iPad use to the regions. The central office is now working on methods to prepare the regions’ technical support staff to resolve iPad issues on their own for this year’s data collection process. Another technical challenge is managing the number of ArcGIS Online users. Because the agency has a limited number of users in their subscription, GIS Core Services repurposes subscriptions when field data collection requires a large number of inspectors using Collector in the field.
Overall, stakeholder reactions have been positive due to the ease of use of the application. The project team presented the program at the State GIS conference and received positive feedback from attendees. In a meeting with WisDOT’s regions, the consensus was the system worked well and the regions are happy with how the project progressed.
The development and implementation process has revealed some valuable lessons learned and best practices. First, developing detailed training and materials is essential for dealing with technical difficulties and data calibration. Second, effective stakeholder communication at the beginning, including managing expectations about the software’s capabilities, is vital. WisDOT estimates that this project has increased productivity by five to ten times to collect culvert information. Even with the challenges faced, WisDOT has identified additional uses for this technology including disaster and damage assessment, sidewalks, curb ramps, ADA compliance, and salt sheds.
↑ Return to Top
↑ Return to Table of Contents
3. Lessons Learned
Prompted by MAP-21’s requirements to develop and implement asset management plans, State DOTs are identifying new methods and tools to more efficiently gather asset condition data. These techniques vary depending on agency circumstances, including available resources, software compatibility, and the overarching data needs for their asset management plans.
This section of the report will focus on the implications of the report findings for other agencies.
3.1 Identify and Include Stakeholders Early On
All four case study examples illustrated the importance of including potential users, business owners, and leadership in the entire process of development.
All project teams faced skepticism toward new technology. Involving potential users in initial conversations, however, can curb skepticism further along in the implementation process. Reaching out early allows for effective communication regarding the tool’s benefit to individuals and the organization as a whole.
Engaging with leadership early on is also crucial. In the cases of DDOT, INDOT, and WisDOT, the project teams supported agencywide technology needs and were in a position to understand agencywide problems. Often, potential users do not have the same understanding of agencywide problems when existing practices work well for their business area. Agency leadership has both the perspective to share agencywide benefits and the influence to encourage adoption of new solutions. In DDOT’s case, the importance of having a champion in leadership was clear when the CIO, an early promoter of Signworks, left the agency and the project team had a difficult time moving the project forward.
Furthermore, involving users early and developing training materials can stem the need for IT requests by building users’ knowledge of the new technology.
The experience of INDOT and WisDOT highlighted the need for training users before starting data collection. In both cases, training materials proved essential to ensuring that users collect data accurately and consistently. Training also reduces the need for technical support later on, which can be a unique challenge when data collectors are spread out across the State.
3.2 Define Data Governance
Data governance is paramount to realizing the benefits offered from new data collection technologies. In all four cases, the major benefits of new data collection came from streamlining the process of collecting, storing, sharing, and using the data—in other words, from strong data governance practices. The new technology is mostly a catalyst for more efficient data governance.
Defining a clear data standard is paramount to increasing efficiency. Case study participants identified non-standard data collection, data cleaning, and data storage across different departments as a significant challenge. Many of the benefits from WisDOT’s, INDOT’s, and DDOT’s projects stemmed from consolidating haphazard data collection into a standard process and format, which enables comparison of data collected by different people, exchange between departments or regions, and storing the data in a central location. All of this makes accessing the data much easier. Relatedly, one of INDOT’s lessons learned was to control who had access to the actual data model—the form for collecting culvert data—to ensure it remained static and standardized.
Related to data standards, another important part of data governance is establishing a single source of data authority, or as INDOT representatives phrased it, a single source of truth. Establishing one database as the place where all users should submit updates and retrieve data for analysis ensures there are no duplicative data collection efforts. This approach also reduces the chance of conflicting information in different parts of the organization, which, as the DDOT case illustrates, often has consequences well beyond the agency.
Another important aspect of data governance is interoperability—the ability to connect new data collected with an agency’s existing datasets. Adhering to existing standards, such as MUTCD codes in the case of VTrans and DDOT, makes it much easier to connect new data with existing databases. For WisDOT and INDOT, the two State DOTs accomplished interoperability by selecting tools in the Esri environment. This made it easy to integrate new inspections with other data in the Esri environment. In the case of DDOT, interoperability required a lot of custom programming work to incorporate Esri’s APIs into the new custom applications.
3.3 Understand the Long-Term Support a Tool Requires
Case study participants shared that their decision on whether to develop a custom solution or use out-of-the-box software was one of the most important and influential decisions in undertaking these projects. Custom solutions offer the advantage of custom data types and functionalities that optimally address the unique challenges of asset data collection. In addition, developing automated processes such as VTrans’s project has the potential for savings in long-term labor costs. This proved instrumental for DDOT and VTrans because signs are a complex asset that require custom data types and collection functionality. However, custom solutions require labor, time, and expertise that are not available to many agencies. Both DDOT and VTrans had to augment their in-house staff: in DDOT’s case, with a contracted software developer, and in VTrans’s case through a partnership with UVM.
Although out-of-the-box solutions are not as flexible as custom solutions, users can create them without additional staff or expertise and on a much faster timeline. This was the case for WisDOT and INDOT. Furthermore, because both agencies used tools that were already available with their Esri enterprise license, the technology itself came at no additional cost and easily integrated into their existing ArcGIS environment. A final advantage is that out-of-the-box solutions come with Esri technical support, which both WisDOT and INDOT used to address difficulties such as using Collector with unreliable cellular service. This meant that some features that users requested—for example, auto-populating some fields in WisDOT’s Collector forms—could not be implemented. However, WisDOT and INDOT found these to be bonus features rather than necessities. The advantages of using an out-of-the-box solution made it worth the inflexibilities.
3.4 Pilot the Technology Before Full Implementation
New technologies almost always present unanticipated challenges. Conducting a pilot study of a smaller scope or less complexity can help agencies get ahead of these challenges in an easier environment before rolling out a solution to the entire organization. In addition, pilot studies provide evidence of the benefits of a tool to present to leadership and others in the agency, which can be used to generate support and resources. WisDOT piloted their data collection process in one region before statewide adoption to verify the efficiencies it would bring. On the other hand, one of VTrans’s lessons learned is that they could have piloted their approach on a less complex asset to work out some of the challenges and work up to tackling signs, a uniquely complex asset.
↑ Return to Top
↑ Return to Table of Contents
4. Conclusion and Next Steps
New asset management requirements and best practices necessitate detailed, accurate, and timely data about agencies’ transportation assets. Increasingly, agencies are finding that their old data collection processes—which often involve recording data in the field with pen and paper—no longer meet their needs. Many agencies are now turning to new technology and techniques to make their asset data more accurate, centralized, and timely. The technology that agencies are using varies widely. Among the four agencies interviewed for this report, technology varied from GIS-enabled forms to machine learning. What technology is appropriate depends on the agency’s resources and the number and complexity of the asset in question. Regardless of the technology used, all asset management data collection efforts can benefit from using the best practices of early stakeholder engagement, data governance, and employing a pilot project to achieve the most benefit in their efforts.
Looking forward, asset management will likely require even more detailed data on a greater range of assets. Agencies can prepare for the demand for new data by proactively updating their data collection efforts for all of their assets by using some of the technologies and best practices from the four highlighted projects.
↑ Return to Top
↑ Return to Table of Contents
Appendix A: Case Study Participants
↑ Return to Top
↑ Return to Table of Contents
Appendix B: Interview Guide
Introduction
Thank you for taking the time today to discuss the topic of data collection for asset management at your agency. Working closely with FHWA, the Volpe Center is interviewing a handful of State DOTs to discuss the different challenges, best practices, and potential lessons learned regarding how such tools are developed and used at different agencies. Our objective is to create a case study report that will highlight the range of approaches and practices regarding data collection for asset management that can then serve as a guide to other State DOTs, MPOs, and FHWA.
Background
- Agency details:
- What is your role within your agency?
- Approximately how many employees work for your organization?
- What department or team was this project housed in?
- How many people were involved?
- What is the technical capacity of your team?
- What spurred your agency’s asset management activities?
- Describe your agency’s asset management activities before MAP-21.
- How did your agency’s asset management activities change as a result of MAP-21?
- Which assets do you collect data on? How did you decide which assets to inventory?
- Before this project, how did you collect information on your assets?
- Before this project, how did you use field data collection tools for other purposes?
Purpose
- What problem(s) was this project intended to solve?
- How did your agency previously solve these problems?
- How did you decide which tools and methods were to be used to collect asset inventories?
- What data does your asset data collection tool(s) collect?
- How did you decide what data to collect, including which assets and which attributes for each asset?
Process
- How did you design the asset data collection tool, including the functionality and aesthetics?
- Was the development of your asset data collection tool(s) completed in-house or contracted out?
- What technical and organizational obstacles did you face in the development of the asset data collection tool(s)?
- Does your asset data collection tool(s) allow for field data collection? If so, how?
- What platforms and technologies did you use to create the tool?
- What QA/QC procedures do you have in place to verify data from the asset data collection tool(s)? How do you verify the data?
- How does your asset data tool interface with your agency’s other systems?
- What education materials were developed to assist in the deployment of the asset data collection tool? Are there regular trainings offered?
People
- Who were the main players in this project? Did it require work across departments, and did it have a champion?
Reactions
- What have been the reactions of internal and external stakeholders to your asset data collection tool(s)?
- How has the asset data collection tool changed your business practices?
- What limitations to using the tool have you identified?
- Does your agency plan to undertake any similar projects going forward?
- What lessons have you learned that you would apply to this type of project in the future, or which would be useful for another agency contemplating a similar project?
↑ Return to Top
↑ Return to Table of Contents
Footnotes
U.S. Department of Transportation
John A. Volpe National Transportation Systems Center
55 Broadway
Cambridge, MA 02142-1093
617-494-2000
www.volpe.dot.gov
DOT-VNTSC-FHWA-19-13
FHWA-HEP-19-032

