Mobile Applications for GIS
Case Studies of Select Transportation Agencies
February 2019

Prepared for:
Office of Planning
Federal Highway Administration
U.S. Department of Transportation
Notice
This document is disseminated under the sponsorship of the Department of Transportation in the interest of information exchange. The United States Government assumes no liability for the contents or use thereof.
The United States Government does not endorse products or manufacturers. Trade or manufacturers’ names appear herein solely because they are considered essential to the objective of this report.
| REPORT DOCUMENTATION PAGE |
Form Approved
OMB No. 0704-0188
|
| Public reporting burden for this collection of information is estimated to average 1 hour per response, including the time for reviewing instructions, searching existing data sources, gathering and maintaining the data needed, and completing and reviewing the collection of information. Send comments regarding this burden estimate or any other aspect of this collection of information, including suggestions for reducing this burden, to Washington Headquarters Services, Directorate for Information Operations and Reports, 1215 Jefferson Davis Highway, Suite 1204, Arlington, VA 22202-4302, and to the Office of Management and Budget, Paperwork Reduction Project (0704-0188), Washington, DC 20503. |
| 1. AGENCY USE ONLY (Leave blank) |
2. REPORT DATE
February 2019 |
3. REPORT TYPE AND DATES COVERED
Final Report |
4. TITLE AND SUBTITLE
Mobile Applications for GIS Case Studies of Select Transportation Agencies |
5a. FUNDING NUMBERS
HW2LA5 SF025
|
6. AUTHOR(S)
Drew Quinton, Anthony Lucivero |
5b. CONTRACT NUMBER |
7. PERFORMING ORGANIZATION NAME(S) AND ADDRESS(ES)
U.S. Department of Transportation
John A. Volpe National Transportation Systems Center
55 Broadway
Cambridge, MA 02142-1093
|
8. PERFORMING ORGANIZATION REPORT NUMBER
DOT-VNTSC-FHWA-19-13
|
9. SPONSORING/MONITORING AGENCY NAME(S) AND ADDRESS(ES)
U.S. Department of Transportation
Federal Highway Administration
1200 New Jersey Avenue, SE
Washington, DC 20590
|
10. SPONSORING/MONITORING AGENCY REPORT NUMBER
FHWA-HEP-19-032
|
| 11. SUPPLEMENTARY NOTES |
12a. DISTRIBUTION/AVAILABILITY STATEMENT
This document is available to the public on the FHWA website at https://www.gis.fhwa.dot.gov/.
|
12b. DISTRIBUTION CODE |
13. ABSTRACT (Maximum 200 words)
In supporting State Departments of Transportation (DOTs) and Metropolitan Planning Organizations (MPOs) in using Geographic Information Systems, the Federal Highway Administration (FHWA) is publishing this Case Study Report focusing on the use of mobile applications by transportation agencies to collect and manage geospatial asset data. To gather information for this report, the U.S. DOT Volpe National Transportation Systems Center interviewed five State DOTs and developed a case study focusing on their experiences. The purpose of this document is for State DOTs and MPOs to consider the approach that these agencies have used in employing mobile applications to reduce a duplication of efforts and learn best practices from peer agencies.
|
14. SUBJECT TERMS
Geographic information systems (GIS), Mobile Applications, Mobile Apps, Asset Management, Data Management, Data Collection
|
15. NUMBER OF PAGES
22 |
| 16. PRICE CODE |
17. SECURITY CLASSIFICATION OF REPORT
Unclassified |
18. SECURITY CLASSIFICATION OF THIS PAGE
Unclassified |
19. SECURITY CLASSIFICATION OF ABSTRACT
Unclassified |
20. LIMITATION OF ABSTRACT
Unlimited |
NSN 7540-01-280-5500
Standard Form 298 (Rev. 2-89)
Prescribed by ANSI Std. 239-18
298-102
Acknowledgements
The Federal Highway Administration and the U.S. Department of Transportation Volpe National Transportation Systems Center would like to thank the participating agencies and the interviewees that made this case study report possible. The participating agencies are listed below and the particular individuals who took the time to be interviewed for this report are listed in Appendix A: Case Study Participants.
- Colorado Department of Transportation.
- Kansas Department of Transportation.
- Kentucky Transportation Cabinet.
- Maryland Department of Transportation, State Highway Administration.
- Missouri Department of Transportation.
Contents
List of Abbreviations
| Abbreviation |
Term |
| AASHTO |
American Association of State Highway and Transportation Officials |
| CDOT |
Colorado Department of Transportation |
| COTS |
Commercial off the Shelf |
| DOT |
Department of Transportation |
| ENS |
Emergency Notification System |
| FHWA |
Federal Highway Administration |
| GIS |
Geographic Information Systems |
| GIS-T |
Geographic Information Systems for Transportation |
| KDOT |
Kansas Department of Transportation |
| KYTC |
Kentucky Transportation Cabinet |
| MDOT SHA |
Maryland Department of Transportation, State Highway Administration |
| MoDOT |
Missouri Department of Transportation |
| MPO |
Metropolitan Planning Organization |
| USDOT |
United States Department of Transportation |
1. Introduction
The number of Americans with an Internet-connected cellular phone, or smartphone, has more than doubled in the last six years.1 With the rise in popularity of smartphones and other mobile hardware, a proliferation of applications that run on these devices has radically changed the way we do business. The flexibility provided by mobile applications—commonly referred to as “apps”—has transformed the way work is done. The types of tasks at which smartphones and the apps running on them excel include data access, collection, and transfer. The ease with which data can be collected with mobile devices has led to the existence and development of large, highly accessible, and rich datasets. With larger datasets, data analysts can understand the world in ways they were never able to before.
One very specific use case of this technology has wide-ranging implications to the transportation system: using mobile applications for road asset management, data collection, maintenance, and construction. Combined with Geospatial Information Systems (GIS) technology, mobile applications allow transportation agencies, such as State Departments of Transportation (DOT), to collect and analyze data at a pace unmatched by other data collection methods. For example, with an increase in the efficiency with which State DOTs can collect data on assets within their network, comes an exponential increase in the types of analyses they can perform on their transportation systems. One can answer traditional questions such as “How many at-grade railroad crossings are in our State?,” which may have been answerable before the implementation of mobile applications; however, now we can answer questions that address location, time, or cross traditional database boundaries like, “And how does that compare to how many we had at this time last year?,” and even provide further analysis such as displaying them on a map, or identifying how many have increased pedestrian risk because of proximity to a school, or environmental risk due to being adjacent to sensitive wetlands.
1.1 Background
FHWA Strategic Plan Goals and Objectives
- Safety – Reduce transportation-related fatalities and serious injuries across the transportation system
- Infrastructure – Invest in infrastructure to ensure mobility and accessibility and to stimulate economic growth, productivity, and competitiveness for American workers and businesses.
- Innovation – Lead in the development and deployment of innovative practices and technologies to improve the safety and performance of the Nation’s transportation system.
- Accountability – Serve the Nation with reduced regulatory burden and greater efficiency, effectiveness, and accountability.
In 2018, the United States Department of Transportation (USDOT) published a Strategic Plan.2 The goals of the plan are four-fold: safety, infrastructure, innovation, and accountability. To that end, the Federal Highway Administration (FHWA) has been promoting the use of GIS among State DOTs to more efficiently manage the country’s transportation system. With a wide range of uses, GIS can be used to support all four of these strategic goals. Mobile applications specifically target two: infrastructure and innovation. Mobile applications are no longer an emerging technology. This innovation has matured to the point where it is reliable enough to be fully integrated into the workflow of transportation agencies across the country. While the platform may now be mature, there is still room for innovative implementations of mobile application platforms. The case studies detailed in this report focus on innovations that foster more efficient business practices in support of maintaining the infrastructure for which the agencies are responsible.
1.2 Purpose and Methodology
This report is part of the GIS in Transportation case study series. FHWA designed the series to highlight GIS examples across State DOTs and metropolitan planning organizations (MPOs) that allow other similar agencies to stay apprised of current practices in the field, learn about best practices for particular GIS implementations, and become familiar with which groups are leading the field and in which ways. Through each case study, colleagues at other agencies will know who they can contact when they need assistance developing and implementing a related program or resolving a related issue.
The GIS in Transportation Program identified the topic of mobile applications as an area of growing interest among State DOTs and MPOs through the results of the GIS for Transportation (GIS-T) 2017 Survey administered by American Association of State Highway and Transportation Officials (AASHTO). Further, the survey results revealed enough transportation agencies interested in learning more on the topic as well as enough to provide sufficient information for a robust case study report.
Through the same AASHTO survey, the GIS in Transportation Program team identified those State agencies that have demonstrated experience in the field leveraging mobile application technology. The team conducted further research into the list of transportation agencies identified, and selected agencies that had significant experience with mobile applications, and those with the willingness and availability to participate in this case study report. Those agencies are:
- Colorado Department of Transportation (CDOT).
- Kansas Department of Transportation (KDOT).
- Kentucky Transportation Cabinet (KYTC).
- Maryland Department of Transportation, State Highway Administration (MDOT SHA).
- Missouri Department of Transportation (MoDOT).
Representatives from each of the identified transportation agencies were generous enough to provide one hour of their time with the research team for a phone interview. Agency representatives were the most knowledgeable staff on how mobile applications are employed within their departments. The research team developed a standardized interview guide, which can be found in Appendix A: Case Study Participants, to use for each of the interviews. This allowed the research team to guide each interview consistently among agencies and produce consistent information that can be compared between respondents.
1.3 Definition of Mobile Applications
The research team began each interview by asking the interviewee how his or her agency defined mobile applications. If the transportation agency had no formal definition, the team would ask how the interviewee defined the term personally and if that definition seemed to pervade the agency in general. This process was necessary to 1) alleviate confusion between interviewer and interviewee about what is and is not being discussed (for example, some users may consider an HTML5 webpage, optimized for mobile hardware, a “mobile application”) and 2) assess what GIS practitioners consider to be a mobile application, and identify if it is defined the same way as the general public thinks of mobile applications.
Most agencies interviewed do not have a formalized definition of what is meant by “mobile application,” and there are occasional misunderstandings among staff members within an agency when discussing mobile applications. For those agencies without a formal, agency-approved definition, respondents all signaled a similar definition—a software application that runs locally on a mobile device. When asked about the definition of a mobile device, interviewees described something with a general purpose operating system (e.g., Android or iOS) that can detect its current location through a global positioning system (GPS) receiver. This understanding precludes hardware such as standard laptops from being defined as “mobile.” Among the interviewees, MoDOT defines mobile applications in their Mobile Application Strategy document, which puts applications into one of four categories: Native Applications, Hybrid Apps, Cross Platform, and Web applications, and describes each with a few sentences.
↑ Return to Top
↑ Return to Table of Contents
2. Agency Use of GIS
Agencies use GIS for a wide variety of business practices. Interviewees noted that not only do their agencies use GIS for required State and Federal reporting, they use it in a variety of ways to more efficiently manage the transportation system for which they are responsible. GIS is used extensively throughout the lifespan of the transportation network and projects, from early planning to design. Some agencies reported using GIS and mobile applications specifically for construction as well. Some agencies, according to the interviewees, use GIS for environmental reporting and even legal purposes. All agencies use GIS for various aspects of asset management.
↑ Return to Top
↑ Return to Table of Contents
3. Agency Use of Mobile Applications
Data management comprises data collection, storage, maintenance, and quality assurance. This is true for the data that all of the participating agencies maintain. While the research team addresses all of these components of the data lifecycle throughout each interview, interviewees felt the need to focus on the data collection portion of the lifecycle as this is the area in which interviewees argue mobile applications achieve the greatest gains in efficiency. This section of the report will focus on field operations and the details of how staff use mobile applications.
3.1 Uses of Mobile Apps
All of the participating interviewees reported that the primary use of mobile applications in their agency is collecting data in the field. All agencies reported using mobile applications to collect data on assets. Some agencies use the database they created with mobile applications that houses all of their asset information, and build on it by using mobile applications to assist with routine inspections of those assets. In this way, mobile applications assist in not only accounting for which assets are where, but continually updating the status of those assets over time.
One trend that became clear through discussions with the participating agencies is that the roll-out of mobile applications happened in an incremental, asset-by-asset method. The more experience an agency has with this practice, the higher the number of assets they tend to collect through mobile applications. Which assets an agency collects data on depends on a number of things including agency needs and regional variations. For example, KDOT has 5-6,000 at-grade railroad crossings—more than most States—that the State DOT is required to report on. Therefore, KDOT initiated its mobile data collection efforts with that particular feature class. Working closely with field staff, GIS managers at KDOT compartmentalized various aspects of railroad crossings and categorized them by feasibility, collecting the least challenging features first. The managers’ goals were to eliminate subjectivity, maximize ease of use for field staff, while also maintaining the highest degree of data accuracy possible.
Once the agencies collect the data, the data are managed, analyzed, and otherwise used for agency business needs. Some of the interviewees noted they make data publicly available through Web-based applications (Web apps) to alert the public of road closures or construction, while some use the collected data for purely internal asset management purposes.
3.2 Hardware
Participating agencies reported that decisions about hardware are not made for the sake of the hardware itself. Hardware implementation tends to be driven by agency needs, and what software will support those needs. For example, agencies seem to be agnostic about whether their hardware runs iOS, Android, Windows, or any other mobile operating systems. Agencies also do not put much emphasis on other factors such as processor speeds, internal storage, or camera resolution requirements. Respondents indicated that their agencies approach hardware decisions from a software-first approach. For example, if a needed mobile application runs on multiple operating systems, any given hardware device that runs that operating system will be used in the field. Conversely, if a mobile application is not supported by a particular mobile operating system, hardware that runs that operating system is necessarily precluded from field operations.
All respondents reported that their agencies use both Android and iOS devices in the field; however, almost all respondents expressed favor for iOS devices such as iPads, iPad Minis, and iPhones. In terms of number of devices in use, iOS devices are the overwhelming majority. Mobile devices running a Windows mobile operating system are in the minority, and it is unclear if there are any State-issued mobile Windows devices used by any of the transportation agencies participating in this case study report.
Agency organizational structure, which varies across each participating agency, can affect asset ownership and maintenance practices. Structure type can also affect data ownership and quality control, which is further discussed in the Data Quality Assurance section. However, all transportation agencies interviewed reported employing at least some agency-owned hardware devices such as phones or tablets. KDOT reported employing the fewest agency-owned devices at 26, while CDOT, KYTC, and MDOT SHA reported employing a number of agency-owned devices in the hundreds. MoDOT reported fielding between 1,000 and 1,500 devices.
All agencies interviewed expressed a liberal policy for field staff using their personally owned smart phones to run mobile applications under the agency’s license agreement. If an employee finds it more convenient to use their personal phone, or is more comfortable on an Android device if the State-owned devices use iOS, they are generally permitted to do so. However, some agencies reported that the data accuracy is higher when using iOS devices and therefore request or even sometimes require field staff to use them.
The specialized hardware that agencies report using fall into two categories: GPS receivers and imaging devices. In the first category, agencies report using devices such as Geode by Juniper, GLO by Garmin, or a model from Trimble’s line of GPS receivers. Field staff use these devices by connecting to a traditional mobile device, such as a phone or tablet, via Bluetooth. This method allows for higher location-accuracy and better, more reliable connectivity by connecting to more GPS satellites than a phone or tablet. In the imaging category of devices, CDOT reported using, and MDOT SHA reported evaluating, Spike GPS, a device that captures photo imagery paired with range data captured through lasers. This process allows the agencies to take distance measurements and calculate the area of features in a photo after data has been collected in the field. For example, a GIS practitioner can use a photo of a railroad crossing taken with Spike GPS in the field, know exactly where the crossing is geospatially, and measure, for instance, the width of the right-of-way at the crossing. KDOT reported using a 360-degree camera by LG to capture 360 photos which KDOT then uploads to Mapillary, an online service that hosts street-level imagery and data. These 360 photos are georeferenced and publicly available on the Mapillary website.
3.3 Software
Without exception, all interviewed State transportation agencies employ applications that run in the Esri ecosystem, and some agencies employ mobile applications outside of the Esri ecosystem (but not exclusively). All interviewees reported using both Esri’s Collector for ArcGIS and either Survey123 or QuickCapture applications. MDOT SHA reported testing AuGeo, an augmented reality application produced by Esri. Other mobile applications that are employed by State DOTs include Mapillary, Work Order Manager, and other utility applications like a compass or a wireless network hotspot finder.
3.3.1 Commercial “Off the Shelf” Applications
All of the State DOTs interviewed also use commercial off the shelf (COTS) applications. A COTS application is a product a user can buy either directly from the company that makes it or license it for a regular fee (usually the latter). What makes COTS different from standard licensed software packages, however, is the customizability of the software. The software packages are designed with the intent of users heavily modifying them for their own specific needs.
With respect to GIS mobile applications, Survey123 and QuickCapture are examples of mobile applications that run on a basic framework but are highly customizable. Every agency interviewed uses one or both of these. State DOTs are able to customize these applications to collect a particular type of feature class. In the office, GIS practitioners program the specific features and feature classes they intend to collect directly into the app. Staff in the field are then able to quickly collect data about the features in question by pressing a few user-friendly buttons indicating responses to the custom-built fields. Most of the mobile applications that agencies use fall into this category.
3.3.2 In-House App Development
What made mobile applications so prolific over the last decade is the ability for programmers to fulfill a need by creating a custom application on their own. Anyone with the programming skills to do so can create an application in either Android or iOS, and install it on the hardware that they own. What this means for agencies such as State DOTs, is if they identify a need that can be resolved with a mobile application, they are able to create an application that fulfills that need.
Three of the five participating transportation agencies have attempted to address a need by creating a mobile application via traditional in-agency custom application development. MDOT SHA reported beginning to develop a custom application framework in 2016, but decided that it was not worth the continued investment and quickly abandoned the effort. Similarly, MoDOT built a mobile application to help them manage erosion at construction sites during construction. While they do continue to maintain the application, MDOT SHA does not endorse this custom application development method for other agencies. MoDOT reported that the cost to build and maintain the application, particularly with respect to maintenance for iOS updates, has not been worth the return on investment. CDOT also developed a mobile application to collect field data from geohazard incidents. The State DOT built the app on a Windows mobile operating system. The app’s purpose is to provide the same functionality as the desktop application. CDOT piloted the app briefly but decided not to adopt it for use in daily operations. CDOT reported that the application may have been more useful if developed on a different mobile operating system. Those interviewees from agencies that have put forth the effort to build custom mobile applications all concluded that, had they known then what they know now, they would have foregone application development altogether, and used a COTS product from the beginning.
3.4 Data Lifecycle
The transmission of data from a mobile device to a central database is where the role of mobile applications ends and the role of data management begins in the data governance process. However, the tight integration of the two—mobile applications and the database in which they are storing the data they collect—is integral to the smooth operation of an agency. This facet is especially true with respect to version control issues and data quality issues, both of which pose a risk with a workflow that differs from traditional data input methods. If version control issues are allowed to permeate due to poor integration between the mobile application and the database, transportation agencies risk duplicating data and undermining the value of having an authoritative data source or losing collected data altogether. Similarly, if the data collected via a mobile application is reliably copied to a central repository, but it is of poor quality, the veracity and therefore the reliability of the analyses and business decisions that follow are thrown into question.
3.4.1 Data Transmission and Storage
All agencies interviewed transfer the data collected via mobile applications into a central database in two different ways: over a cellular network connection in the field, or over Wi-Fi in the office. State-owned mobile devices are generally equipped with a cellular network connection via a data plan. After features are collected on the assets in the field, the data is pushed to a database in real time. However, in many areas, agencies find that there is no reliable data connection, especially in more rural areas which necessitates a disconnected editing solution. When agencies know that connectivity will be an issue, they train field staff to select and save locally to a mobile device the geographic area in which they plan to collect data for the day. This has two effects. First, field staff download the data associated with the existing assets in that area to the mobile device(s) that will go into the field. Second, that data stored on the database are locked so that they cannot be edited while field workers collect new data. This helps resolve any version control issues that would arise if some users update data in the database while other users out in the field collect more data, creating two possibly conflicting datasets on the same physical assets.
If users synchronize data over a cellular data connection, data on the database updates in real time as users collect and record features. However, when cellular data is not an option, all agencies report that users sync the data that they collected over the course of the day with the data previously locked on the database, once they are back in the office. This then unlocks the data on the database for the assets in the geographic area so that they can be edited, manipulated, and otherwise analyzed for use by the agency.
Because all agencies interviewed leverage mobile applications that tie into the Esri ecosystem, all agencies also employed ArcGIS Online. The software not only allowed them to utilize the version control functionality mentioned above but it also provided them with a service where they can store the data they collect on Esri’s servers. These servers comprise the “cloud” into which users or systems push data via a cellular data connection or wireless internet connection, following the collection of the data through a mobile application.
Some agencies store data in a centralized data warehouse which includes data from other sources, not just data collected in the field through mobile applications. To integrate data collected through mobile applications, and uploaded into the cloud onto Esri’s servers, agencies report running a daily script that pulls all of the updated data from Esri’s servers and copies them to the agency’s centralized data warehouse.
3.4.2 Data Quality Assurance
Different agencies take different approaches to data quality assurance and quality control. Generally, among the agencies interviewed, there is no centralized data quality assurance mechanism built into the data collection process. Some of the individuals interviewed work in departments that act as service providers for other departments within the agency. With this organizational structure, those who are building and maintaining the mobile applications are not responsible for, nor do they depend on or use, the data produced as a result of the applications’ use. With this structure, the onus for data quality assurance falls on the data owner, not the service provider. Interviewees representing agencies organized in this way did not have knowledge about the particular quality control methodology employed by the data owners.
All agencies track the end-user who most recently created or edited the data collected through the mobile application. Some respondents reported that, before pushing the data to the working database, they first push them to a development server. The data owner then reviews the data before approving them and integrating them with the rest of the working data. These two mechanisms provide a level of control over data quality assurance that allows agencies to be flexible in their approach.
One method that agencies use to ensure data quality is to build mobile applications that require as few manual inputs as possible. By building mobile applications that ask the end users to input data by selecting from a pre-defined list of options displayed in a user-friendly way, agency staff can be sure that the resultant data will be consistent between users and collection sites. This approach achieves benefits unrelated to data quality as well. Selecting from a pre-defined list of inputs is faster and easier for end-users which helps increase the speed and likelihood of users adopting a mobile application. Furthermore, this approach increases analytical capabilities and therefore increases the return on investment to the transportation agency implementing the mobile application.
↑ Return to Top
↑ Return to Table of Contents
4. Organizational Implementation
4.1 Impetus for Mobile Application Implementation
Agencies reported considering the use of mobile applications after realizing that their data collection methods, at the time, were inefficient and/or led to poor, non-standard data populating their databases. Only one agency, KYTC, reported a precipitating event. In that case, FHWA informed the agency that they were not in compliance with their billboard collection and reporting requirements. KYTC stated that after becoming aware of the problem, they decided to employ their first mobile application to resolve the issue. Over a six-week period they were able to build a mobile application on an Esri platform that served as a precursor to the current Esri Collector application. KYTC began training and deploying staff in January of 2011, and by May they inventoried every billboard in the State. KYTC reported spending $40 thousand in equipment, which excludes staff time. In contrast, they received a quote by private sector contractors stating that a complete billboard collection effort would take one year and cost $750 thousand.
Some agencies reported that the move away from traditional data collection methods toward mobile applications originated from upper management in a top-down style. Others, however, reported the opposite: that field staff and GIS practitioners led the change. The common thread is that the cost and schedule efficiency, as well as the data quality improvements gained through employing mobile applications to collect data in the field, can be appreciated by agency staff at all levels of an organization.
4.2 Staff Training and Acceptance
When asked about staffing and training, agencies reported that most of the staff that are asked to use mobile applications, instead of any traditional means, react well to the adoption of the new technology. All agencies noted that they always expect a small population to resist or refuse to adopt a new technology. This is also true with mobile applications, but in the experience of the participants, that population seems to comprise a small minority.
None of the agencies interviewed cited staff training as a major hindrance to employing mobile applications. Interviewees from all agencies indicated that they are employing many types of approaches to training staff. KDOT reported they first trained staff on mobile applications through statewide workshops but quickly abandoned that approach due to its logistical complexity and time-consuming nature. Now, KDOT provides one day of training per year for end users which they broadcast to trainees online. They also provide a few days of training for system administrators. The interviewees at MoDOT handle training by developing user manuals, videos, and provide message boards for users to communicate. MoDOT then advertises these resources through digital signage placed throughout its facilities across the State. Furthermore, they employ a “training-of-trainers’ model in which they train staff to go out to the regions and train small groups of field workers in person.
Interviewees at CDOT, KYTC, and MoDOT work in departments that act as service providers for other departments. As such, they don’t necessarily provide training to the departments for which they support through Information Technology efforts, such as creating and modifying mobile applications for specific departmental use. Some agencies also reported that, due to the way they use contractors, they tend to see higher than usual turnover among staff. Some interviewees expressed the viewpoint that high staff turnover can be a benefit because newer staff bring in a fresh perspective from the private sector, in which mobile applications are used more widely.
All agencies agree that using multiple mobile applications or maximizing the utility of a single mobile application within the same ecosystem helps to achieve training efficiencies. For example, agencies collecting a certain feature class using Survey123 would not have to train employees about collecting a different feature class using the same mobile application configured differently. The features they would be collecting and recording would change, but the user interface would remain consistent and familiar to the end user.
4.3 Benefits to Agency
All agencies participating in the case study agreed on two points:
- The implementation of mobile applications in field operations undoubtedly brings tangible and intangible benefits to data collection practices; and
- Those benefits are very difficult to measure, quantify, and express in objective terms.
All of the participants reported increased efficiency with which they can collect data and an increase in the quality of the data they collect. The benefits associated with the increased efficiencies include the time and cost savings achieved through more efficient means as well as a reduction in the duplication of efforts. Staff are able to collect data in the field more efficiently. KDOT reported that with paper-based asset data collection processes, under ideal circumstances data would take three days to get back to headquarters, then up to a week to enter that data into an Access database. At times, it could take up to months. The result of a consistent in-flow of data from the field via mobile applications results in a more even workload for system managers. Rather than receiving a large batch of data at the end of a collection cycle, system managers are able to process the data for quality assurance and incorporate them into the database as they arrive daily.
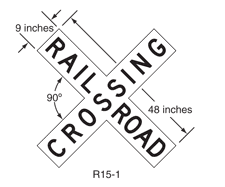
Figure 1. Illustration. A crossbuck as depicted in the Manual for Uniform Traffic Control Devices.
By decreasing the amount of time it takes for field staff to collect data on one asset type at one location, agencies can decrease the amount of time it takes to collect data on all asset types across the region or State. Furthermore, with the same levels of staffing, agencies can then collect more asset types for the same geographic area over the same amount of time. For example, MDOT SHA set out to collect all the traffic barrier features in the State. It took approximately two days to build the database and mobile COTS based application and distribute it to field staff who were able to collect all traffic barrier features in only six weeks. Such a turnaround time is virtually impossible without leveraging mobile applications.
With a larger dataset populating agency databases, and more accurate, reliable data, agencies are able to analyze asset data quicker and more accurately. Such a scenario results in agencies being able to answer questions about assets with unprecedented speed and accuracy. For example, all public at-grade railroad crossings are required to have at least one, and more typically two, standardized Emergency Notification System (ENS) signs.3 In addition, they will be required to have crossbucks4 with yield or stop signs by the end of 2019. Because KDOT is able to quickly and efficiently collect detailed sign feature data at railroad crossings, they can simply search the database to locate all crossings without updated ENS signs, or locate all passive crossings without yield or stop signs.
↑ Return to Top
↑ Return to Table of Contents
5. Conclusion and Next Steps
Today, mobile applications achieve unprecedented efficiencies in collecting data on transportation assets in the field in time savings, data quality, and data accuracy. Due to the many uses, types of applications, variety in hardware, and the complexity of the ecosystem in which they need to integrate, implementing mobile applications in an agency’s workflow can seem like a difficult task at first. However, following in the footsteps of the agencies interviewed for this study should provide a practical basis on knowledge from which to begin the implementation process.
Due to the efficiency gains, staff are able to iterate on data collection tasks much faster, collecting more asset features on more asset types. Respondents reported that staff are proactive with new ideas about how to employ mobile applications. The interviewees who work in organizations structured such that they act as service providers report a notable trend: after a department within an agency deploys mobile applications in one region or one business unit within the agency, staff members from other regions and business units approach them requesting support for a new use of mobile applications.
The experience recounted by the participating transportation agencies illustrate another trend—agencies will continue to collect data on more features in more feature classes on assets in the field using mobile applications. As more data is integrated into a database, agencies will continue to increase their capacity to analyze their data and therefore manage their transportation assets more efficiently. Interviewees expect that collecting assets via a paper-based system will soon become too resource intensive and cost prohibitive by comparison, and the solutions to conducting such business practices using mobile applications will be considered the default methodology.
↑ Return to Top
↑ Return to Table of Contents
Appendix A: Case Study Participants
↑ Return to Top
↑ Return to Table of Contents
Appendix B: Interview Guide
Introduction
Thank you for taking the time today to discuss the topic of Mobile Apps within your GIS division. Working closely with FHWA, the Volpe Center is interviewing a handful of State DOTs to discuss the different challenges, best practices, and potential lessons learned regarding how mobile applications are leveraged at different State DOTs. Our objective is to create a Case Study Report that will highlight the range of approaches and practices regarding mobile applications that can then serve as a guide to other State DOTs and FHWA.
Background
We’re going to start this interview with some general background and descriptive information about your office and how you leverage GIS technologies generally, at a high level. We’ll get to mobile application use later.
- Agency details:
- What is your role within your agency?
- Approximately how many full-time, non-contract employees work for your organization?
- What is the size of your GIS team (full and part-time, not including contractors)?
- What is the number of State GIS staff that spend at least 50% of their time on GIS-related tasks?
- What is the number of contract staff (full and part-time) that work with your GIS team?
- In what ways does your agency currently use GIS or geospatial tools?
- Are there other uses of GIS that you would like to employ but currently do not? What are they?
- What are the biggest challenges and/or obstacles in implementing existing GIS tools?
- Are there any additional challenges that you foresee in implementing future GIS tools?
Individual Use
The following questions focus on the use of mobile applications at the micro-level, focusing on the specific hardware, software, and practices of a DOT employee or contractor that directly interacts with the mobile application.
- Does your department or agency maintain a formal definition of what is meant by “mobile applications”?
- If yes - Is this definition widely accepted by all staff in the department?
- If no - How do you personally - define mobile applications? E.g., when I say “mobile applications,” what comes to mind?
- Would others in your department define it the same way?
- In what ways do you use mobile applications in GIS? (e.g., do you use mobile applications for data retrieval (read only) or data input, or both?)
- What specific hardware do employees use to access mobile applications?
- Does your agency own and maintain an inventory of tablets/smart phones, or do employees use mobile applications via their personal devices?
- Do employees utilize any unique or specialized/task-specific tools/tablet attachments?
- What specific software applications do employees use and what platform (Android, iOS, etc.)?
- What specifically do employees use each application for?
- Does your agency use any open-source programs/freeware?
- Does your agency use any COTS software?
- Has your agency developed any of your own in-house mobile applications?
- Were consultants involved in the implementation process?
- What mobile applications would you or your agency like to implement in the future?
- If any, please describe.
- What processes/workflows at your agency would benefit from using mobile applications that do not currently utilize them?
- Do you see a need to hire software developers/programmers?
- If so, what might that job description look like and where would they fit into your organization?
- Now I’d like to ask you a few question about the lifecycle of the data that you collect in the field through mobile apps.
- First, how are data collected transmitted after collection?
- Are there metadata and/or quality control requirements that mobile app users must meet in order to submit their data to the central repository? E.g., are data “cleaned up” by the user before being submitted, or is it submitted as-is to the warehouse?
- Second, how are data stored?
- What is the chain of custody for the data once it is submitted to the collection system/data warehouse?
- Who is ultimately responsible for the data and its quality?
- What end-users are using mobile data the most and how are they accessing it? What permissions do they have to edit/share this data?
Organizational Implementation
The following questions focus on the macro-level implementation of mobile applications at the organizational level, such as the motivations for implementation, work-flow efficiencies, time/cost savings, etc.
- Were you in this department or position before the implementation of mobile applications?
-
If Yes, see below. If No, skip to next question.
- What was the impetus for implementing mobile applications?
- What were the early days of mobile application use like? Was it driven by management or did practitioners need to gain buy-in to implement?
- Did you experience any pushback from administrators/offices/existing business processes? If so, how did you work through this?
- Did you perform a cost-benefits analysis during the implementation planning process? If so, please provide detail on what that process looked like.
- What were the challenges to implementing mobile applications? (e.g., equipment/software costs, training time, resistance to change, lack of executive support)
- Did mobile applications require any new system architecture, or did they dovetail with existing IT infrastructure?
- How is your system architecture structured? Please describe at a high level.
- Has the use of mobile applications resulted in specific benefits to your agency? If yes, please describe.
- Have mobile apps expanded your department’s ability to perform new tasks and/or provide new services that you otherwise wouldn’t be able to do without them?
- What specific beneficial differences did the use of mobile applications achieve compared to traditional methods/business as usual? (e.g., improved data accuracy, streamlined workflows, reduction in duplication of effort, reduction in human error, time/cost savings, timely delivery of products, timely reaction to asset maintenance)
- Does your agency make use of performance metrics/key performance indicators (KPIs) for your mobile applications? These can include labor costs, project delivery time, data processing time, etc.
- How have staff reacted to the implementation of mobile apps? Can you help us understand the training requirements and cost in rolling out or implementing different types of mobile applications?
- Have you found leveraging apps within a common ecosystem to reduce training time and cost?
↑ Return to Top
↑ Return to Table of Contents
Footnotes
U.S. Department of Transportation
John A. Volpe National Transportation Systems Center
55 Broadway
Cambridge, MA 02142-1093
617-494-2000
www.volpe.dot.gov
DOT-VNTSC-FHWA-19-13
FHWA-HEP-19-032