Geospatial Information System Capability Maturity Models
Case Studies of Select Transportation Agencies
June 2017
Prepared for:
Office of Planning
Federal Highway Administration
U.S. Department of Transportation
Notice
This document is disseminated under the sponsorship of the Department of Transportation in the interest of information exchange. The United States Government assumes no liability for the contents or use thereof.
The United States Government does not endorse products or manufacturers. Trade or manufacturers’ names appear herein solely because they are considered essential to the objective of this report.
| REPORT DOCUMENTATION PAGE | Form Approved OMB No. |
||
| Public reporting burden for this collection of information is estimated to average 1 hour per response, including the time for reviewing instructions, searching existing data sources, gathering and maintaining the data needed, and completing and reviewing the collection of information. Send comments regarding this burden estimate or any other aspect of this collection of information, including suggestions for reducing this burden, to Washington Headquarters Services, Directorate for Information Operations and Reports, 1215 Jefferson Davis Highway, Suite 1204, Arlington, VA 22202-4302, and to the Office of Management and Budget, Paperwork Reduction Project (0704-0188), Washington, DC 20503. | |||
| 1. AGENCY USE ONLY (Leave blank) | 2. REPORT DATE June 2017 |
3. REPORT TYPE AND DATES COVERED Final |
|
| 4. TITLE AND SUBTITLE Geospatial Information System Capability Maturity Models |
5a. FUNDING NUMBERS | ||
| 6. AUTHOR(S) Michael Green, Anthony Lucivero, Andrew Reovan, Drew Quinton |
5b. CONTRACT NUMBER | ||
|
7. PERFORMING ORGANIZATION NAME(S) AND ADDRESS(ES) U.S. Department of Transportation John A Volpe National Transportation Systems Center 55 Broadway Cambridge, MA 02142-1093 |
8. PERFORMING ORGANIZATION REPORT NUMBER | ||
|
9. SPONSORING/MONITORING AGENCY NAME(S) AND ADDRESS(ES) U.S. Department of Transportation Federal Highway Administration 1200 New Jersey Avenue, SE Washington, DC 20590 |
10. SPONSORING/MONITORING AGENCY REPORT NUMBER | ||
| 11. SUPPLEMENTARY NOTES | |||
| 12a. DISTRIBUTION/AVAILABILITY STATEMENT This document is available to the public through the National Technical Information Service, Springfield, VA 22161. |
12b. DISTRIBUTION CODE | ||
|
13. ABSTRACT (Maximum 200 words) To explore how State DOTs evaluate geospatial tool applications and services within their own agencies, particularly their experiences using capability maturity models (CMMs) such as the Urban and Regional Information Systems Association (URISA) geospatial information system (GIS) CMM, FHWA and the U.S. Department of Transportation (DOT) Volpe National Transportation Systems Center interviewed four State DOTs and developed a series of case studies focusing on their experiences:
|
|||
| 14. SUBJECT TERMS Geographic information systems (GIS), capability maturity model (CMM), organizational assessment |
15. NUMBER OF PAGES 33 |
||
| 16. PRICE CODE | |||
| 17. SECURITY CLASSIFICATION OF REPORT Unclassified |
18. SECURITY CLASSIFICATION OF THIS PAGE Unclassified |
19. SECURITY CLASSIFICATION OF ABSTRACT Unclassified |
20. LIMITATION OF ABSTRACT Unlimited |
NSN 7540-01-280-5500
Standard Form 298 (Rev. 2-89)
Prescribed by ANSI Std. 239-18
298-102
Contents
- List of Figures
- List of Tables
- Executive Summary
- 1. Introduction
- 2. Observations
- 3. Case Studies
- Appendix A: List of Case Study Participants
- Appendix B: Interview Guide
List of Figures
List of Tables
Executive Summary
Since its wide-scale adoption by transportation agencies, geospatial information systems (GIS) technology has provided a tremendous value to each agency and has been integrated into everyday organizational decision-making and analysis. In many cases, agencies are no longer asking themselves if they should or should not use GIS, but how well have they adopted this technology and how can they improve upon it. One way in which transportation agencies approach these questions is through a self-evaluation, otherwise known as an organizational assessment. In particular, some agencies have adopted more specific assessments known as capability maturity models (CMMs), which asses the ability of an agency to effectively and efficiently carry-out specific GIS services, rating each service using a numerical scale. The Federal Highway Administration (FHWA), in an effort to assist transportation agencies with self-assessments, has decided to identify and explore potential solutions for a uniform and effective assessment process.
To explore how State Departments of Transportation (DOTs) are assessing organizational GIS decision-making capabilities, particularly through the use of capability maturity models, FHWA and the U.S. DOT John A. Volpe National Transportation Systems Center (Volpe) interviewed the following four State DOTs and developed a series of case studies focusing on their experiences:
- Iowa Department of Transportation (IDOT)
- Ohio Department of Transportation (Ohio DOT)
- Tennessee Department of Transportation (TDOT)
- Oregon Department of Transportation (Oregon DOT)
This report supports GIS practitioners and decision-makers by identifying examples of noteworthy practices, considering the benefits and limitations of implementing a capability maturity model approach, and determining how to identify and address factors that alter the effectiveness of a GIS division in applying geospatial tools and services. Highlights of the findings presented here include:
- All four peers, with varying degrees of organizational assessment experience, were able to fully test a CMM and evaluate their own agency's GIS division across multiple criteria.
- In some cases, the Urban and Regional Information Systems Association (URISA) GIS CMM that was tested by each peer was the first formal evaluation carried out by the State DOT in over five years. Going through the CMM tool allowed these agencies to begin a discussion on how to best assess an organization's GIS division, and how different levels of maturity across different categories are affecting the State's DOT abilities to effectively manage GIS operations.
- Ultimately, peers that tested one or more CMMs believed that while there is potential to leverage a CMM to promote improved project prioritization and delivery and better resource allocation within a DOT, adopting a new model for self-assessing can be too disruptive to current business process. While each State remained interested in CMMs, there are no immediate plans for including them in any strategic plan.
Back to Table of Contents
Back to Top
1. Introduction
1.1 Purpose and Methodology
The Federal Highway Administration (FHWA) has promoted Geospatial Information Systems (GIS) as a means to more effectively manage and improve transportation systems. One of the ways that FHWA has done this is through its GIS in Transportation program,1 which identifies timely and critical GIS issues and topics in transportation and connects transportation agencies with available resources and best practices. While several State Departments of Transportation (DOTs) and Metropolitan Planning Organizations (MPOs) have already implemented or are in the process of implementing GIS and geospatial tools to address complex issues, others are in the early stages of using these tools to address the same types of needs and challenges. More so, the level of success and efficiency at which these tools are applied can vary greatly from one agency to the next. While it has been common for agencies to identify or acknowledge GIS-related challenges, implementing an efficient and repeatable process for doing so has not. To address this issue, some transportation agencies have implemented what is known as an organizational assessment—a process through which an agency evaluates its strengths and weaknesses in a given area of service. An organizational assessment will generally conclude with a series of recommendations that can address existing or newly identified weaknesses.
The topic of organizational assessments is not a new area of research but its application in GIS over the last 10 to 15 years has been sparse and mostly unknown within the GIS community. The idea of assessing organizational structures and services originated from another recent topic of return on investments (ROI). In the field of GIS, return on investment studies are undertaken as a means to estimate the benefits associated with adopting a GIS application or service by quantifying outcomes such as reduced production times, lower data collection costs, and expedited project delivery timelines. An ROI study measures a change before and after the implementation of a new technology or process, which is what has motivated organizational assessments. Through an organizational assessment, transportation agencies can provide a baseline for the current state of services provided by an agency. After implementing a new application or altering a business process, a follow-up organizational assessment can demonstrate how the GIS division as a whole has changed over time, particularly in areas most closely related to the new application or business process. Assessments can also provide a snapshot of the effectiveness of current GIS practices, which do not require other baseline or follow-up evaluations. For example, an assessment can identify how data is stored across a DOT and if there are duplicative efforts for storing and processing that data.
The FHWA GIS in Transportation Program recognized the potential benefit that organizational assessments can have for State agencies' GIS divisions and, in 2016, held a peer exchange with GIS staff from seven State DOTs focused on organizational assessments. The meeting included State DOTs with varied organizational assessment experience including those whom had at least one assessment and those with no experience. The peer exchange was meant to start a discussion among interested parties where States that had assessment experience could share their lessons learned and best practices with the rest of the group. One of the outcomes of the peer exchange was that, in addition to learning how an organizational assessment can lead to cost savings and other benefits or what are common requirements when carrying out an assessment, there is no standard and efficient approach to carrying out an assessment. As a result, each State demonstrated a demand for a unified approach, which was ultimately led by the Urban and Regional Information Systems Association (URISA). URISA implements what is known as a GIS Capability Maturity Model or CMM. Generally applied to technological applications, CMMs, which are further explained in Section 1.2, are models that evaluate an organization's overall level of maturity by how well it can carry out tasks related to a certain topic. According to URISA, its GIS CMM “provides a theoretical model of a capable and mature enterprise GIS operation within a designated organization.”2
Following the 2016 peer exchange, a group of participating State DOTs agreed to test URISA's GIS CMM. In exchange, URISA was able to provide access to the online tool for testing, allowing each State DOT to create its own profile and visualize the results of the assessment. In order to best capture each State's experience using the tool, FHWA with the help of the John A. Volpe National Transportation Systems Center, interviewed four States that were able to complete a CMM and analyze its results. The questions, which are available in Appendix B: Interview Guide, include topics on the background of each State, experience with organizational assessments, the objective behind the CMM, the experience using the tool, and the results of the tool. Overall, each State's experience produced a unique case study on the use of CMMs for GIS divisions within State DOTs.
The case studies gave participating agencies the opportunity to:
- Identify the state-of-the-practice for the implementation of organizational assessments and the URISA GIS CMM at the State DOT level.
- Collaborate with other transportation agencies to refine a capability maturity model to best fit State DOTs.
- Share related experiences, including previous organizational assessments, their methodology and results, and how their GIS division changed over time.
- Discuss benefits, challenges, success factors, and lessons learned from administering the URISA capability maturity model.
- Identify potential opportunities to incorporate CMMs into regular business processes and promote the model to the wider GIS and transportation community.
FHWA and Volpe selected agencies for case studies based on their interest in self-assessments, previous experience with organizational assessments, and ability to complete URISA's GIS CMM. The participating agencies include the Iowa Department of Transportation (IDOT), Ohio Department of Transportation (Ohio DOT), Tennessee Department of Transportation (TDOT), and Oregon Department of Transportation (Oregon DOT). Appendix A: List of Case Study Participants provides details on agency participants. An interview guide, included as Appendix B: Interview Guide, provides a framework for the two telephone discussions held with each agency, held for 30-60 minutes each in January through May of 2017. Case studies were drafted based on participant responses during the two discussions. Findings from the case studies are included in the Observations section of this report.
1.2 Capability Maturity Models
The concept of CMMs originated in the late 1980s with the Software Engineering Institute. The CMM was designed to evaluate how well contractors could complete software design and development projects. Since then, CMMs have become more widespread and applied to the fields of engineering, project management, risk management, and information technology (IT) services.3 It was not until 2009 that the first GIS-specific capability maturity model was developed by the National States Geographic Information Council (NSGIC) and then later adopted as an initiative by URISA. According to one of its creators, Greg Babinski, a “capability maturity model assesses an organization's ability to accomplish defined tasks,” and “assess an organization's maturity level based on how it executes individual processes.”4
1.2.1 Defining Maturity
A mature agency can be defined as one with well-developed enabling technology and resources that are used effectively and efficiently. The URISA GIS CMM more specifically defines maturity across two broad areas of GIS operational development: enabling capability and execution ability. According to URISA, “enabling capability includes technology components, data, professional GIS staff, an appropriate organizational structure, and other resources and infrastructure.” When referring to execution ability it “is the ability of the staff to maximize the use of the available capability, relative to a normative ideal.”5 To assess an agency's execution ability, the URISA GIS CMM uses the following five-level scale:
- Level 1 - Ad hoc (chaotic) processes
- Level 2 - Repeatable processes
- Level 3 - Defined process
- Level 4 - Managed process
- Level 5 - Optimized processes
Each level indicates the progression an organization experiences when evaluated with regards to capacity and efficiency in completing GIS-specific tasks and goals. Goals can include the use of state-of-the-art GIS technologies, high quality data, and implementing community accepted best practices for business processes.
A model such as the URISA CMM assumes there is an ideal state of managing GIS operations and performance goals. How an agency defines an ideal goal, however, can vary depending on the adopting organization. For example, an agency set a goal of piloting a new GIS staff position on a temporary basis. On the other hand, another agency might set a goal to hire a staff member for a full-time position. Additionally, agencies can leverage other models that use a more discrete definition of an ideal level of maturity. Discrete approaches can include comparing tasks to an already established ‘best’ level of capability and practices, or an estimated ‘average’ level of capability and practices as determined by an agency.
URISA developed the rating system for measuring the enabling capability of a GIS division using an existing State GIS Maturity Assessment scale, which was created by the States of Georgia and Texas. The rating system, which is used to eventually determine a level of maturity, is defined as follows:
- [ ] 1.00 Fully implemented
- [ ] 0.80 In progress with full resources available to achieve the capability
- [ ] 0.60 In progress but with only partial resources available to achieve the capability
- [ ] 0.40 Planned and with resources available to achieve the capability
- [ ] 0.20 Planned but with no resources available to achieve the capability
- [ ] 0.00 This desired, but is not planned
- [ ] Not Applicable (This is a non-numeric response that requires an explanation of why this component should not be considered in assessing the operation.)
Similar to the five-level execution ability assessment scale, each step on the enabling capability scale represents a progression towards higher levels of maturity where 1.00 is a fully implemented and mature process. Once complete, the URISA GIS CMM summarizes each level of maturity across multiple categories in a spider diagram, as seen in Figure 1 below.
Figure 1. Example URISA GIS CMM Spider Diagram
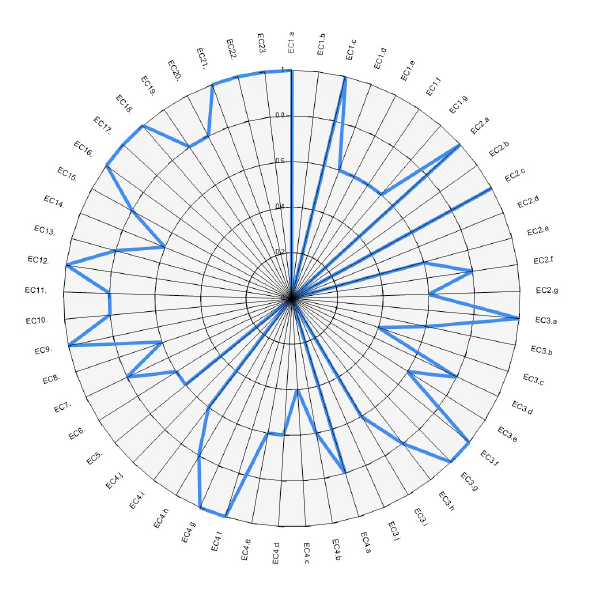
Source: FHWA 2017 GIS-T Workshop Presentation
After determining that geospatial tools and applications can provide measurable benefits for an agency, FHWA believes it is important to understand how effectively an agency is using those tools and applications. By implementing a CMM such as the URISA GIS CMM, State DOTs can take the necessary steps to improve upon already existing services within their GIS divisions. Because there is no standard approach for how State's should go about self-evaluations, FHWA has taken the role of convening potential stakeholders and decision-makers to identify potential approaches. The Agency believes there is a benefit in facilitating the process for organizational assessments while identifying common goals and challenges. In the end, State DOTs can identify and choose to follow a uniform assessment framework allowing them to share results and compare across similar metrics.
Back to Table of Contents
Back to Top
2. Observations
Past approaches to organizational assessments and capability maturity models varied widely for each of the four peer agencies interviewed. In some cases such as with Oregon DOT, the URISA Model is the first formal assessment the agency has been able to undertake in the recent past while in other cases, such as Iowa DOT, there is a regular history of assessments and CMMs to which the URISA CMM provides a new level of input.
Each case study participant demonstrates a strong interest in improving the respective agency's efficiency in delivering GIS services. However, each agency differs in how much time, staff, and other resources are available to take on a new task. In addition to resources, demonstrating the benefits and costs of a CMM can be challenging if there is limited support from senior management. Solving these challenges and understanding the role that CMMs can play in a transportation agency can require unique and long term approaches that are beyond the scope of this case study report. While some participants indicated plans to follow up with the URISA GIS CMM, others recognize that adopting a regular assessment approach might still be further down the line. Table 1 below, provides an overview and summary points about each of the case study examples.
Table 1. Summary of Case Study Agencies’ CMM Efforts
| Agency | Past Formal GIS Evaluations | Centralized or Decentralized GIS Division | Experience with CMMs | Goals and Lessons Learned from CMMs |
|---|---|---|---|---|
| IDOT | 2005 (contractor), 2015 (CMM), 2016 (CMM) | Decentralized | Extensive experience in CMMs |
|
| Ohio DOT | Strategic Plan (2002), Enterprise Architecture Plan (2014), Data Governance Evaluation (2017) | Mix - Central Office GIS team across two Divisions; Planning and Information Technology | Extensive experience with assessments but limited capability maturity model experience |
|
| TDOT | None | Decentralized | Little to no experience |
|
| Oregon DOT | None | Centralized | Little to no experience |
|
2.1 Motivations for Capability Maturity Models
Case study participants decided to explore the topic of CMMs, URISA's model in particular, not only because of the potential benefits associated with evaluating an agency from within, but also to gain insight into how other similarly organized agencies self-evaluate. CMMs allow agencies with no experience with formal assessments to start an internal discussion on implementing such a model while more experienced agencies can compare the process and results from models such as URISA's to their current standing approaches. By using the same method, multiple agencies can begin to share their results and experiences. Within that overarching goal, the agencies were motivated to pursue CMMs for one or more of these reasons:
- Formally identify current business process limitations.
A CMM can provide quantitative measures for how effectively an agency operates across a variety of existing business processes. While GIS staff might be aware of some if not most of existing limitations, the CMM can serve as a formal mechanism for communicating this limitation to stakeholders and executive leadership. - Leverage model results to prioritize and promote needed GIS projects.
Once strengths and weaknesses are identified, agencies can potentially use the results to prioritize projects that specifically address GIS service needs. - Demonstrate the success of other GIS initiatives.
Peers expressed that CMMs could also serve as a way to promote and highlight projects that have achieved or contributed towards success in issues that are marked with higher levels of maturity. - Compare evaluation results with other similar agencies.
Following the completion of a CMM, results and best practices can be shared with other agencies that have also completed the assessment.
2.2 Benefits
Transportation agencies reported a number of benefits related to using CMMs to evaluate established GIS business processes. Agencies highlighted the following benefits in the discussions:
- A tool to assess an organization's ability to accomplish a defined task or set of tasks.
After accomplishing a task, it can be difficult to measure and communicate that a defined task is complete or how well it was done. A CMM allows GIS practitioners to demonstrate changes in maturity that result from clearly defined and executed tasks. - Identifies strengths, weaknesses in GIS applications and services at an agency.
A CMM evaluates GIS division tools and services across multiple capability and execution components, such as staff development, metadata, and GIS budgets. Each category represents a predetermined measurable component for collecting, storing, implementing GIS data and technologies, as well as communicating results and repeating the overall process. Through these quantifiable measures, an agency can determine where to focus resources when trying to improve its GIS operational ability. - Results in discussions that can lead to actionable short-term and long-term items.
After identifying weaknesses, an agency can begin a process for establishing short and long-term solutions for addressing them. In most cases, agencies are still developing the appropriate framework that could potentially include a CMM into their regular business process, which can precede other action-items. For agencies that already have evaluation frameworks in place, however, each evaluation can result in more focused solutions. For example, if an agency scores low on the execution component of staff development, an agency can choose to encourage more internal or external trainings. - Used to motivate investment from executive team.
Demonstrating the value of GIS or a GIS-related project to an executive team can be a challenge if the benefits are not clear or there are strong competing priorities from other types of projects. A CMM can be a way to clearly demonstrate the value a GIS project brings to an agency by demonstrating metrics that measure changes in quality of services for a GIS division or technology needs.
2.3 Challenges
Agencies noted several challenges associated with starting and finishing a CMM, as well as leveraging the results to improve business processes:
- Completing a new CMM assessment can be time-intensive.
The first time a CMM is completed can be the most time-demanding. When a staff member starts a CMM, he or she needs to learn how the tool works, how each GIS and organizational term is defined, what data are required to complete the tool, and where to find that data. Going through each step of the initial process can be very time consuming and especially burdensome for smaller organizations that are already time-constrained due to the size of the current workload. - Limited staffing.
Similar to the time-resource challenge, agencies are commonly understaffed and already committed to existing and future projects. Taking on a CMM requires existing staff to increase their workload in situations where it may not be feasible. Some agencies might not be able to hire additional staff due to work policies in place such as hiring freezes or budget limits. Additionally, staff transitioning can result in knowledge loss if there is lack of process documentation and knowledge transfers among employees. - In its current state, the URISA GIS CMM is limited in its applicability to State DOTs.
The current URISA GIS CMM was developed from existing State and Municipal evaluation models. Overall, the model lacks components related to specific State DOT requirements such as linear-referencing systems and Highway Performance Monitoring Systems (HPMS).
2.4 Lessons Learned
The case study agencies offered the following lessons learned based on their experiences:
- CMMs and scaled assessments are critical to developing GIS departments but are not the only approaches.
Creating a method for evaluating the efficiency and success of a GIS department is critical for measuring progress. In many cases, evaluations occur in an informal format, are limited to a few staff members, and the benefits are not fully materialized. CMMs create discrete measurable indicators, which can be used to demonstrate how well an organization is delivering GIS services and where it needs to focus more resources. In some cases, State DOTs have used third parties to assess the effectiveness of their GIS operations. While these types of assessments can result in in-depth analyses of business process strengths and weaknesses, they can also prove costly and time-intensive, taking up to a year to complete. - A strong understanding and “buy-in” is needed in order to start and complete the analysis effectively.
Because assessments can be time and resource-intensive at first, it is important to understand the level of commitment needed in order to successfully complete a CMM. The overall duration of a CMM such as the URISA GIS CMM will depend on the level of detail for data used as inputs. On average, the peers required seven to eight hours to complete the assessment. CMM completion requires coordinating within GIS divisions and with related departments to identify the necessary data. - A test run can be helpful to get context before taking an in-depth approach to the CMM.
As a follow-up to the previous lesson learn, because a comprehensive capability maturity model run can require significant time and other resources, it is recommended going through a test run to understand what the model is asking from the input to the outputs. This approach allows agencies to introduce the assessment without too much commitment from the institution. - Identifying an efficient organizational structure of GIS, IT, and Planning departments within an agency is critical.
Each agency has a unique organizational structure and architecture. In some cases, agencies have been able to restructure their division of work over time, allowing for the creation of more centralized or defined GIS divisions. While changing the makeup of staffing structure might not be feasible in many cases, clearly defining the role of GIS and ownership of GIS services within existing infrastructures is critical to reduce data and service redundancy and improve efficiency. Case study peers indicated it is necessary to foster an equal-footing relationship between IT and the GIS/planning offices. Additionally, it is also imperative to establish clear definitions and applications of GIS in order to communicate the value of GIS to executive leadership. - Create the necessary incentive-based structure for acquiring and retaining skilled and experienced staff.
One of the ways that agencies have been able to maintain or create GIS staffing positions is by collaborating with human resources departments to identify qualified candidates and create appropriate roles and titles. Having the right position classifications and descriptions will help attract more ideal candidates and provide clear definition of work for existing staff. Agencies can foster growth within entry-level positions by providing training opportunities and adequate compensation when feasible. CMMs can further articulate the need for new staff and facilitate discussions on hiring needs with leadership. - Establish efficient data management policies and processes in order to maintain continuity.
Creating detailed and periodically-maintained documentation will break down barriers for employees. Additionally, establishing clear review processes will help identify current limitations and how to address them. CMMs like the URISA GIS CMM can motivate reviewers to identify current data management policies and understand strengths and weaknesses.
Back to Table of Contents
Back to Top
3. Case Studies
This section presents in-depth case studies on the transportation agencies that participated in the report interviews. Each case study starts with a background section, which provides a more in-depth review of these efforts, specifically: 1) how each agency has implemented organizational assessments in the past; and 2) motivations and goals associated with undertaking a CMM. Following the background section, each case study concludes with a summary of the benefits and challenges related to CMMs, strengths and weaknesses related to the URISA GIS CMM, a review of lessons learned and recommendations, and next steps (as applicable).
3.1 Iowa Department of Transportation (IDOT)
Background
The Iowa Department of Transportation has employed organizational assessments since 2006. Before completing the URISA GIS CMM, IDOT completed an adapted version of Slim Geographic6 Information Management called Enterprise Maturity Model.
IDOT has converted some of the older maturity models into a more appropriate format for internal use. Between 2006 and 2010, the State DOT completed different types of informal CMM assessments to assess where the organization's strengths and weaknesses lie with respect to the use of geospatial tools. Part of the success that IDOT has encountered with the use of CMMs is due to support from executive leadership. With this support, IDOT started to use more formal CMM assessments at the institutional level.
While IDOT has a core staff in the Technology Group consisting of two full-time employees, two contractors, and two interns or temporary staff, it also has 50 to 60 other employees working with geospatial data in various policy offices and divisions throughout the department. Currently, IDOT leverages geospatial tools in a number of ways including:
- Data visualization to support external communications (e.g. legislators, the general public)
- Spatial analysis to monitor the conditions of roads, accident occurrences, and other measures
- Field data collection
One way in which IDOT aims to use geospatial tools, but currently does not, is aerial photography and Light Detection and Ranging (LiDAR) to monitor changes in conditions over time. The primary hurdles to overcome in implementing new GIS technologies are the availability of both staff resources and time.
Benefits of CMMs
As IDOT engages in projects such as a single enterprise system migration and advancing data governance practices, GIS managing staff have turned to CMMs to better inform and promote the value of these projects. IDOT believes that one of the major benefits of completing CMMs is to discover institutional deficiencies in corporate culture, philosophy, and strategic orientation. For example, the results of a recent CMM assessment based on the Slim GIM model assisted IDOT to identify where the organization needed to grow by pointing out specific initiatives that needed support in order to accomplish their stated goals. In this case, there was a need to renew an existing GIS licensing agreement. Using the CMM's results, IDOT was able to obtain the support of upper management to renew the existing license.
Challenges of CMMs
The primary challenge that IDOT faces is incorporating institutional changes to structure the organization in a more effective way. The State DOT currently experiences issues with data and service duplication efforts, which are due to lack of communication and misalignment of goals across staff and State DOT departments. While a CMM can assist the GIS division in identifying communications challenges, applying solutions across multiple groups and divisions can be difficult to justify for everyone.
URISA GIS CMM Tool Strengths
From IDOT's experience, the URISA GIS CMM is more thorough than other CMMs in how it scores varying components of a GIS division. Using the URISA CMM tool, a user can visualize the model outcomes with spider diagrams. Each spider diagram, such as the one seen in Figure 1, displays a level of maturity for each predetermined component, side-by-side. Using this approach, an agency can identify stark differences between high and low levels of maturity, which in turn allow it to strategically allocate funds towards needed areas. IDOT believes the spider charts, through which the results of the assessment are communicated, are a very clear way to display the results and indeed the best approach.
The URISA CMM also helps identify if an agency is effectively managing its corporate culture and staffing requirements. For example, the assessment asks how one's agency is organized, at what level of management are GIS initiatives organized, and how effective leadership is. The questions make the user think about what staffing positions the agency is currently lacking and, through the results of the assessment, indicate what needs to be improved.
URISA GIS CMM Tool Weaknesses
One of the weaknesses of the URISA CMM tool identified by IDOT is that it is not currently optimized for State DOTs and is indirectly biased towards municipality or county frameworks. For example, many of the questions refer to elements such as cadastral data layers, utilities, and customer records, which are primarily managed at the county and municipality level. One question in particular asks if the agency manages streets and addresses, which is not relevant to departments of transportation. Similarly, there are a number of questions absent that would apply to State DOTs such as questions pertaining to centerline data, data collection methods, and LiDAR. IDOT argues the tool could be much stronger if it included questions pertaining to linear referencing, assessments, and more of an emphasis on data management. Many State DOTs have a large variety of information pertaining to the assets they manage, and questions on this topic were conspicuously absent.
Lessons Learned and Recommendations
Due to time limitations, The URISA CMM was completed by one person at IDOT. In the future, given more time to complete the assessment, IDOT recommends investing time and other resources towards educating other individuals and departments on the nature of the URISA CMM and CMMs in general. By doing so, more staff can be included in the assessment, which can result in increased input and quality of input across the agency and in turn produce more accurate and robust results.
For the results of the CMM assessment to have an effective change, IDOT would have to significantly change how the agency is organized and how they hire and manage staffing. For example, the Cartography Office and the Technology Office both use geospatial software, but because the products they produce are not necessarily coordinated, the result is less efficient than it otherwise could be.
The value of the URISA CMM tool would be further increased if a number of State DOTs could all take the same assessment and cross-reference results with each other. This would provide the advantage of making clear which agencies excel at which tasks, and which agencies would benefit from some improvement of other tasks. Furthermore, having an apples-to-apples comparison across agencies would help to facilitate peer exchanges, allowing agencies experiencing similar difficulties to work together to overcome them and leveraging the lessons learned from agencies who have encountered and overcome similar difficulties.
Next Steps
IDOT expects to continue to use and evaluate the URISA CMM. The State DOT expects the level of effort and time required to complete the CMM will be significantly lower given some of the first steps in completing the first CMM were identifying data sources and understanding definitions.
Back to Table of Contents
Back to Top
3.2 Ohio Department of Transportation (ODOT)
Background
Ohio DOT has a distributed organizational structure, with most geospatial services managed by the Office of Technical Services in collaboration with GIS, IT, and planning personnel from the 12 district offices. There are ten full time staff in the Office of Technical Services, two staff in the IT group who are GIS service administrators, and about seven full-time equivalents (FTEs) doing geospatial work across the district offices (in most districts, specialists are only partially dedicated to geospatial efforts). In addition, Ohio DOT has four on-site contractors supporting GIS-based projects.
Ohio DOT uses geospatial tools for several purposes, most notably:
- Maintenance of certain data sets (i.e. the State's Linear Referencing System (LRS) and statewide road inventory)
- Additional asset data maintenance
- Integration across data sets and different business systems
- Web-based tools for information display and analysis by non-specialist users in the State DOT
- A public-facing information portal to support public information access
Ohio DOT's Office of Technical Services has a history of conducting organizational assessments and of using the information gathered through that process to develop strategic plans. The first such GIS Strategic Plan was developed in 2002 and defined the vision and goals for the GIS program, and many of those same vision and goal statements are still used in internal communications and marketing. Ultimately, the vision and goals were used to define the Road Inventory Specialist positions at the district offices, allowing Ohio DOT to grow GIS and geospatial expertise throughout the districts.
In addition, Ohio DOT completed an enterprise architecture plan in January 2014, which had some specific GIS recommendations (amongst other enterprise data and technology management recommendations). The plan is currently in the implementation stages, with few outcomes to report at the time of this writing.
Currently, the Ohio Office of Technical Services is undertaking an organizational outreach effort and survey to understand data governance needs. Ohio DOT anticipates developing a new data governance policy, based on these findings, in the near future. The assessment began with an initial online survey for data business owners responsible for data programs. The Office of Technical Services then established a data governance steering committee, which is reviewing the survey results both for accuracy and for unexpected findings. Based on the findings, the steering committee will develop an initial data governance strategy with the goal of facilitating data sharing between different data owners and silos. Currently, the biggest challenge is time: while the survey was conducted recently (in Fall 2016), data practices are evolving so rapidly at Ohio DOT that survey responses may not be entirely accurate a few months later.
Ultimately the goal of this assessment is to get recommendations out to data owners and to management. One initial and significant recommendation is that effective data governance can help reduce the duplication of effort in capital budgeting. Maintenance of different data sets demands staff time and effort. When modifying data in a single data set, it can lead to inconsistencies with other data sets due to changes not being published authoritatively and carrying through each related dataset. Ohio DOT is managing a $2 billion capital project budget, so accuracy on all of the data for capital investments needs must be highly accurate. With improved data governance and accurate data sets, Ohio DOT would be better able to allocate that budget and plan for future investments.
Benefits of CMMs
According to Ohio DOT, CMMs can improve capital investment efforts and reduce duplication of effort. Through the data governance assessment, Ohio DOT anticipates that clear standards for data management will help reduce the lag time in processing or modifying data that was in different formats. This will improve confidence in the data and, in turn, help justify specific capital investments and prioritization.
CMMs, the State DOT claims, can also inform new job types and position descriptions. Relatedly, the geospatial assessments done in the past have informed how the Office of Technical Services and Ohio DOT's human resources team craft job descriptions. In particular, the Road Inventory Specialist position was created to increase geospatial capabilities at the district office level. In addition, Ohio DOT hopes to encourage the consideration of geospatial experience in hiring of other staff positions (e.g. planners), using the capabilities described in assessments like the URISA CMM.
Ohio DOT looks to regular assessments, such as CMMs, to evaluate its technical capabilities and its geospatial data management to help maintain a commitment to continuous organizational improvement. Ohio DOT mentioned that it regularly looks to third-party assessments as a way to identify gaps in capabilities and ways to strategically invest in improvements to how the Office of Technical Services works with its stakeholders. A CMM can also serve as a less resource-intensive alternative to this process.
Challenges of CMMs
As Ohio DOT found with its data governance assessment, quick changes in data practices are creating difficulties in getting an accurate snapshot of the data governance picture within the agency. As practices change, the data governance steering committee has to re-evaluate preferences and answers that may have changed within the six months since an initial survey was conducted. This process in turn requires more investment in time from GIS staff.
One of the biggest organizational issues at Ohio DOT is that a number of business units struggle to see how their data can contribute to the overall picture. Essentially, there are a number of “silos of excellence” with narrow mandates—groups that are excelling at their primary mandate but unaware of how their work interacts with other organizational units. Obtaining this data can be crucial to completing a CMM but may be too costly in resources to do.
URISA GIS CMM Strengths
Ohio DOT estimated that for an individual or small group the assessment should take a total of only 7 hours on average: 4 hours for the main questions, and an additional 2-3 hours to gather data and complete the metrics section. More time may be necessary for assessments involving a larger number of perspectives. This approach limits the level of detailed inputs due to the time required to collect all the data.
Ohio DOT appreciated the value of the high-level report generated by the URISA CMM; however, the organization found it limited for use in interpreting the results. Ohio DOT would recommend allowing for several reports that interpret the data in different ways, to include recommendations for each focus area or to allow users to dive into raw data. This would help champions and GIS teams tailor their recommendations to other parts of the organization and to leadership.
URISA GIS CMM Weaknesses
If Ohio DOT was to fully complete the assessment, the agency would explore collaborating with additional team members and managers throughout the State DOT. Completing the assessment in this manner would take an estimated total of 14-20 hours to conduct outreach and collect answers from data owners and other staff members throughout the State DOT. This assumes questions could be segmented to go to the relevant department or person. Currently, that segmentation would have to be completed manually. After an initial baseline, it is expected that future iterations would take less time to complete.
Ohio DOT felt that the CMM from URISA was limited in capturing details about the perspective of geospatial/GIS data customers in the organization. For a formal assessment, Ohio DOT would seek to include survey responses and other feedback from agency members (such as interviews with managers and executives). As mentioned in the interview with Ohio DOT, “You might have one idea of how well it's going, but customers might have a completely different picture.”7
Finally, the URISA model, which was developed for local agencies (i.e. URISA members), was largely adaptable for State DOTs, but some idiosyncrasies had to be overcome. In particular, at the State DOT level, service delivery to different business units or by different initiatives can vary widely: e.g. one might be doing really well while another is struggling due to factors outside of one group's control. So if competencies could be answered distinctly by initiative, project, or business unit, the analysis might help to identify specific pain points. The tool could then aggregate to the organizational level to give an average score across all initiatives.
Lessons Learned and Recommendations
From Ohio DOT's perspective, it is important and helpful to know your goals and desired outcomes before beginning the assessment process. Sometimes when doing an assessment, a user might find unexpected topics or questions. If there is no clear idea of what an agency hopes to get out of the assessment, relevant factors for questionnaire answers might be missed. Ultimately, understanding objectives beforehand can help bring the right people and players to the table, to ensure the process has an enduring impact.
Ohio DOT also considers exploring a trial run before engaging stakeholders, other organizational units, and customers. This depends heavily on how familiar an organization is with the concepts and theories of what the model is trying to do. If people are educated about maturity models and have done them in the past, an organization can dive in. Otherwise a test run might be helpful to get context before going in-depth into the process. Ohio DOT first reviewed the assessment in the Office of Technical Services, which allowed the team to go back and modify questions as they gained additional information.
Finally, Ohio DOT recommends establishing a core group of GIS CMM stakeholders that can assist in the development and promotion of State DOT GIS CMM. Establishing a standard or model that State DOTs can use can be really helpful for comparison because State DOTs can then help communicate where they are struggling and where they are succeeding as a community with their legislators and with Federal officials. Once the core group of stakeholders in the GIS CMM is assembled, that group would then be responsible for updating the URISA CMM and ensuring that it stays relevant through engagement with other peers.
Next Steps
Internally, Ohio DOT is focused on continuing to review the results of its data governance assessment and plans with the steering committee, to draft official policies about data management, and to get recommendations for a Chief Data Officer. The Office of Technical Services is looking at a parallel change management assessment process with the goals of revisiting how IT is organized and increasing skillsets in specific areas. For GIS specifically, if Ohio DOT can geospatially enable most data sets, it can address a number of issues to enable greater efficiencies in workflows.
Ohio DOT will continue to work with many of the other peer participants in this case study report, as well as with URISA, to refine and adapt a CMM model for State DOT users. The State DOT does not, however, have immediate plans to leverage the results of its initial assessment.
Back to Table of Contents
Back to Top
3.3 Tennessee Department of Transportation (TDOT)
Background
The Tennessee Department of Transportation has decentralized organizational structure when it comes to GIS and therefore no division within the State DOT dedicated to GIS activities. TDOT does have full-time employees (FTEs) that work primarily with GIS. In the Long-Range Planning Division, TDOT has 19 full time GIS staff members, and in the IT Department the State DOT has nine GIS staff members. While there are contract or part-time workers that work with TDOT, their positions are not housed within the agency.
TDOT uses geospatial tools for several purposes, most notably:
- Project decision-making
- To maintain highway inventory
- Basemapping for the entire State through functional photogrammetry division
- Environmental Review
While TDOT has worked in each of these areas extensively, it believes there still exists a big gulf between engineering data and spatial data that can limit the potential of the work done. There exists a vast amount of engineering data that is not inherently or easily transferrable into a spatial format, thus limiting the applications of GIS with this data. As a way to address this issue and improve institutional capabilities, TDOT is promoting increased trainings on GIS tools to reduce the existing gulf and expand their work across the agency.
Using the URISA GIS CMM, TDOT believes it can further promote the need for training and more strategic funding for other identified needs. The URISA CMM is the first organizational assessment that TDOT has undertaken. The State DOT would like to see a common, State DOT-specific CMM to compare themselves to other DOTs as well, allowing it to easily determine effective practices.
Benefits of CMMs
Having no prior experience with CMMs, TDOT believes CMMs can provide needed support for both identifying programmatic needs across the agency and using the results of the model to demonstrate those needs to the agency's leadership. Additionally, CMMs can produce regular maturity ratings that can be traced over time. As an agency continues to use a CMM, TDOT argues it would also be expected that the cost of using the tool in terms of time and other resources will also drop making the tool easier to use and overall more accessible.
Challenges of CMMs
One of the challenges of CMMs is that the results from these models might not be revelatory or insightful. In some cases, like TDOT, knowing and understanding current limitations is the simple part while knowing how to address them is the challenge. To best use a CMM, an agency has to be able to demonstrate how the modeling tool provides a service or produces information that the agency doesn't already have. While a CMM can provide a clear and concise numerical scale rating that identifies how efficient an agency delivers a certain type of service related to GIS, if there is no buy-in from executive leadership on the importance or legitimacy of the tool, then the results will not have any significant impacts on GIS operations.
URISA GIS CMM Tool Strengths
The documentation of results was particularly useful for TDOT to see where it should focus efforts in funding and programming, how to allocate resources more efficiently, and how to self-identify GIS categories that are low on the maturity scale. TDOT also found the tool interface simple and understandable in terms of the required inputs and overall flow of the questions. One of the strengths of the tool is how it allows users to see how blank answers will affect the assessment results, which gives an indication of the importance of the question. There is also a benefit to being able to move to and from the dashboard to see what has been completed and what is missing. A potential use of this feature is allowing multiple individuals to review the assessment (instead of one), which can be especially useful for larger agencies such as State DOTs.
URISA GIS CMM Tool Weaknesses
TDOT found a number of weaknesses within the CMM tool. The budgeting questions in the CMM were difficult for TDOT to answer, as they do not have a specific GIS budget. Instead, TDOT's GIS budget is contained within the IT Department budget. It is estimated that it would take TDOT several months of prep time to tease out all the relevant information for the purpose of GIS budgeting and then sort through it to determine GIS-specific costs. Currently, there is no way to address this challenge in the URISA CMM. Additionally, TDOT does not believe the CMM addresses State DOT-specific needs as well as it could. Currently, there is only one question about transportation data layers in the CMM tool and no questions addressing Federal requirements such as the All Road Network of Linear Referenced Data (ARNOLD) and HPMS.
Lessons Learned and Recommendations
TDOT predicts that once a CMM is completed for the first time, subsequent future uses will be easier and faster to complete. The agency recommends that multiple individuals review the assessment, not just one person, and that users should gather all relevant data before beginning the CMM, particularly budget data. The CMM should also include a “Recommended Data Collection” guide to help users understand what data they should have on hand before using the CMM.
The weakness of the survey for State DOT GIS divisions shows how it needs to be adapted for applicability at the State level. TDOT does not have a central GIS division or a dedicated budget, so they received a “0” for GIS Maturity in the CMM under budget-related categories. State DOTs tend to be more complicated organizations than local governments, and some, like TDOT, have unconventional GIS staffing structures and budgets. The creation of a State DOT-specific CMM tool needs to take multiple organizational structures into consideration when writing the questions. There should also be an entire section of transportation data questions for State DOTs, including HPMS questions, which are critical to State DOT GIS work.
Next Steps
It is unclear if TDOT leadership will support the investment for a CMM to be performed on a regular basis. This is due to a new round of funding from an increased State gas tax, which means TDOT will receive a large quantity of new projects to work on, thus limiting time and resources available for another CMM to be performed. The window to assess TDOT through these kinds of measures passed by about a year. TDOT would like to perform an “apples-to-apples” comparison between their own internal requirements and Federal requirements for State DOT GIS divisions, but the plan to do this comparison is still theoretical at this time.
Back to Table of Contents
Back to Top
3.4 Oregon Department of Transportation (Oregon DOT)
Background
The Oregon Department of Transportation has a GIS division that includes 14 staff members. Unlike other technical services, including engineering and natural and cultural resource disciplines, the GIS division remains centralized along with other technical leadership centers. Oregon DOT works with different groups to populate the data and then prepare it with an Enterprise Data Management System. They have approximately 500 Esri GIS desktop software users, and approximately 30-40 super users. One of the challenges that Oregon DOT faces is knowing how many GIS software licenses it needs to successfully and efficiently provide GIS services to the entire agency. It is not clear to the State DOT whether or not all licenses are being used to the extent needed.
Oregon DOT uses geospatial tools for several purposes, most notably:
- Data development
- Aggregation of data as related to the State DOT's business
Oregon DOT wants to explore using GIS for more analysis work. When working with different groups, the State DOT wants to have the capacity to analyze various forms of geospatial data in-house. For example, the Oregon DOT would like to expand their work with safety priority index systems that takes crash record information and develop hot spots. In order to complete such a project, however, the GIS staff needs to collaborate with traffic engineers, safety engineers, and other groups. Another example of a desired project is understanding the impacts of a speed limit increase. Oregon DOT's planning section does a lot of analysis in this field but believes there is an opportunity to use more specialized tools that can provide new and more detailed perspectives. The State DOT would also like to see more reporting and integration along with expanded dashboard tool applications. Oregon DOT is exploring what more they can do with Esri Insights.
In addition to analysis, the State DOT would like work more with reporting and integration. Creating interactive graphic and ad-hoc capabilities to create report-friendly products, which will allow more users to get access to the data.
Assuming the cost of completing the URISA CMM would be low, Oregon DOT wanted to explore what kind of value could be obtained from an initial high level assessment of its GIS division. A CMM could serve as a yard-stick for whether or not the DOT should do an in-depth contractor study, which might result in strategic and implementation plans. Such plans can then be shared with stakeholders and a steering committee.
Benefits of CMMs
From Oregon DOT's perspective, organizational assessments can provide a concise summary of a GIS division's needs by category. Knowing what areas to address can also lead to a clear course of actions for addressing specific needs. At Oregon DOT, geospatial and technical managers always push to keep up with advancements in the field of GIS. Doing so can be challenging to accomplish in addition to more direct day-to-day responsibilities. A CMM can provide a way for identifying where a GIS division or staff are lacking in skills while also evaluating everyday business processes.
Challenges of CMMs
Currently, Oregon DOT's approach for managing GIS services is working well for the organization. Adopting a new method for evaluating and keeping track of their operations can potentially jeopardize their current work flow success. In addition, the State of Oregon has a hiring freeze, which also limits any additional staff to take on organizational assessment efforts. Given the hiring freeze and recent changes in the total number of staff, the State DOT is focusing its resources on cross-training employees. In order to adopt a new evaluation method, such as a CMM, the method would have to be low cost and not require additional staff.
URISA GIS CMM Strengths
Using the URISA CMM proved to be a low-resource task for Oregon DOT. Completing the URISA GIS CMM did not require many man-hours. The agency completed the CMM with four individuals in a total of 7 hours. The results from each individual's answers were compiled and averaged in order to produce one set of results on the CMM tool. Oregon DOT recognized that, in addition to taking a small amount of time, which allowed day-to-day work activities to not be disrupted, the State DOT did not have to reach out to any contractors or outside staff in order to complete the evaluation. In the end, the low time and staff requirements proved beneficial for multiple offices within Oregon DOT including the Procurement Office, which would have handled any purchases or staff requests had they been needed.
Another benefit of the URISA GIS CMM for Oregon DOT has been its support and use by other agencies. As part of a growing topic at conferences such as GIS-T through workshops and presentations, States have been able to engage in more discussions on using CMMs and these assessments can be useful. As an agency that tries to maintain open and ongoing communication with other State DOTs, Oregon DOT has been able to take advantage of other agency experiences including their experience with URISA's CMM. Finally, the State DOT noted that the tool itself is easy to obtain and complete based on the provided instructions. The questions asked in the assessment are clear and easy to understand.
URISA GIS CMM Weaknesses
One of the main weakness of the URISA GIS CMM is that the model is not State specific enough for wider adoption at Oregon DOT. There are aspects measured in the assessment that are not in the purview of the State DOT's control. For example, questions related to data backup and security are not applicable because those fields are not handled at the State DOT, but instead by contractors. Questions about application development or procurement methodologies might also not apply well to agencies such as Oregon DOT. For Oregon, these topics are dealt with agency-wide, and not just the GIS division, which means the GIS division has to compete or coordinate with other divisions and their needs when developing new software or going through procurements.
The CMM tool is also limited in its use for State DOTs through lack of questions regarding Federal reporting, requirements, and mandates related to State transportation agencies. Creating a metric for whether or not an agency is meeting a requirement, and if it is, how well it is doing so can be very useful for State DOTs. Topics such as Linear Referencing Systems and HPMS are not included in the URISA GIS CMM even though they are crucial requirements for all State DOTs.
Lessons Learned and Recommendations
When completing the URISA CMM with four staff members, there was a lot of agreement with how each question should be answered. Each member of the GIS division had an understanding of the group's GIS needs and therefore found that the CMM's results were not unexpected. Conversely, the CMM tool was also able to demonstrate in what small areas there were varying views of maturity, which started a discussion at the State DOT. The CMM tool motivated engagement between GIS stakeholders, Oregon DOT, and supervisors.
Using the tool, Oregon DOT found that its GIS division currently addresses well its service quality of assurance, legal and policy affairs management, and balances minimal privacy with maximum data usage. The tool also reported the GIS division can improve in its application development or procurement methodology as well as its resource allocation management.
Before completing an assessment, Oregon DOT recommends organizing multiple experienced GIS staff with the agency and have each member complete the assessment independently. Afterwards, the team can discuss in what areas members answers varied widely and why. Once the answers are discussed, the results can be averaged and entered into the tool for an average run. Finally, Oregon DOT believes the output spider diagrams are ideal for high-level discussions on each GIS category with GIS staff and upper management.
If there are more time and resources to complete an assessment, Oregon DOT recommends involving more internal and external stakeholder groups in the evaluation process. Along those lines, the State DOT also recommends following up with other State DOTs who have completed the CMM. By sharing results and experiences, new opportunities can arise for collaboration and sharing lessons learned.
Next Steps
The CMM self-assessment has allowed Oregon DOT to reassess what its GIS divisional weaknesses and strengths are in a clear and formal manner. Having already established a strategic plan for the upcoming six months to one year, Oregon DOT does not expected to deviate from that plan. The URISA GIS CMM has been very helpful in initiating discussions within the DOT regarding project priorities, updating its current plan, and working with GIS stakeholders. While the next steps for the agency do not include incorporating a CMM into their strategic plan, they are interested in the model's potential use in the long term.
Back to Table of Contents
Back to Top
Appendix A: List of Case Study Participants
| Agency | Name | Title | Work Phone | |
|---|---|---|---|---|
| Iowa Department of Transportation | Eric Abrams | Geospatial Administrator | 515-239-1949 | Abrams@iowadot.us |
| Ohio Department of Transportation | Ian Kidner | GIMS Systems Administrator | 614-752-5743 | Ian.Kidner@dot.state.oh.us |
| Tennessee Department of Transportation | Kim McDonough | GIS Coordinator | 615-741-4037 | Kim.McDonough@tn.gov |
| Oregon Department of Transportation | Brett Juul | GIS Unit Manager | 503-986-3156 | Brett.A.Juul@odot.state.or.us |
| Philip Smith | Environmental GIS Project Manager | 503-986-3733 | Philip.L.Smith@odot.state.or.us | |
| U.S. DOT FHWA Headquarters | Mark Sarmiento | GIS Planning Specialist | 202-366-4828 | Mark.Sarmiento@dot.gov |
| U.S. DOT Volpe Center | Andrew Reovan | Community Planner | 617-494-3843 | Andrew.Reovan@dot.gov |
| Anthony Lucivero | Community Planner | 617-494-2810 | Anthony.Lucivero@dot.gov | |
| Drew Quinton | Community Planner | 617-494-2991 | Drew.Quinton@dot.gov | |
| Michael Green | Economist | 617-494-2553 | Michael.Green@dot.gov |
Back to Table of Contents
Back to Top
Appendix B: Interview Guide
Background
- Agency details:
- What is the size of your GIS team?
- Dedicated GIS staff?
- Contract Staff (Full-time or Part-time)?
- In what high-level ways does your agency currently use GIS or geospatial tools? Which areas represent the biggest ‘pain points’ or hurdles to the adoption of these tools?
- Are there other uses of GIS that you would like to employ but currently do not?
- What are they? What roadblocks exist to their use?
- Are there other uses of GIS that you would like to employ but currently do not?
- Does your agency currently employ an Enterprise Data Management system?
- Does your agency use Federal funds to support any of its GIS activities? If so, what types of funds (SPR, etc.)?
- What initially drove the decision to conduct this current organizational assessment?
- What do you expect to get out of a CMM?
- What are your future plans for your GIS or geospatial tool development? How, if at all, has the CMM framework informed these plans? Do you anticipate it informing plans in the future?
Past Assessments (If the participant has not performed one proceed to the next section)
- Have you previously compared your agency against a GIS/geospatial organizational assessment (other than the URISA CMM)? Which assessment framework did you use?
- Did you complete the organizational assessment as an individual, or did you involve additional members of your department, management team, or leadership?
- Have you communicated the results of the organizational assessment to agency leadership?
- If not, is this something you have considered? If so, what has impeded you from doing so?
- What have been the biggest successes related to the use of a GIS/geospatial organizational assessment?
- What have been the biggest challenges of using a GIS/geospatial assessment?
- What 2-3 lessons or recommendations would you share with other agencies who may be considering an organizational assessment?
URISA Capability Maturity Model (CMM)
- Why did your organization choose to test the URISA CMM?
- Did you complete the CMM as an individual, or did you involve additional members of your department, management team, or leadership?
- How long did it take you to complete the assessment?
- Was there anything about your organization in particular that affected this process? (e.g. size, information is spread out, decentralized, unclear roles)
- If you completed the assessment again, with the most detailed information possible, how long do you estimate it would take to complete?
- What were the impacts (positive and negative) of completing the CMM?
- Who do they affect?
- Were the questions adequately tailored for a State-level analysis?
- How, if at all, can the questions be improved?
- Did you encounter any usability challenges when using the tool? (e.g. data limitations, time constraint, unclear instructions, tool crashing, etc.)
- Do you have any recommendations for improvements or changes to the tool?
- Do you plan on continuing to use this tool on a regular basis? If so, how often?
- What 2-3 lessons or recommendations would you share with other agencies who may be considering an organizational assessment?
Conclusion
- Would you or your agency be interested in participating in a Community of Practice that maintains communication, continues the dialogue about organizational assessments, and provides support through events and programs?
- If so, how could this Community best serve your needs?
- What types of events and programming would be most effective, in your view?
Back to Table of Contents
Back to Top
FOOTNOTES
| 1 | See the FHWA GIS in Transportation website: http://gis.fhwa.dot.gov/. |
| 2 | URISA, GIS Management Institute, GIS Capability Maturity Model, September 2013 (PDF) |
| 3 | URISA, GIS Management Institute, GIS Capability Maturity Model, September 2013 (PDF) |
| 4 | http://www.esri.com/news/arcnews/winter1011articles/urisa-proposes.html. Accessed May 8, 2017. |
| 5 | URISA, GIS Management Institute, GIS Capability Maturity Model, September 2013 (PDF) |
| 6 | Paul Giroux, MSC, GISP http://www.slimgim.info/. |
| 7 | Interview with Ian Kidner from the Ohio Department of Transportation on May 15, 2017. |