CASE STUDIES IN GEOGRAPHIC INFORMATION SYSTEMS
FOR ENVIRONMENTAL STREAMLINING
May 2012
| Prepared for: Office of Planning Federal Highway Administration U.S. Department of Transportation |
 |
Prepared by: Organizational Performance Division John A. Volpe National Transportation Systems Center Research and Innovative Technology Administration U.S. Department of Transportation |
 |
TABLE OF CONTENTS
- ACKNOWLEDGMENTS
- ABBREVIATIONS
- EXECUTIVE SUMMARY
- 1. INTRODUCTION
- 2. CASE STUDIES
- 3. CONCLUSIONS AND LESSONS LEARNED
- APPENDIX A: INTERVIEW GUIDE
- APPENDIX B: CASE STUDY CONTACTS
ACKNOWLEDGMENTS
The U.S. Department of Transportation John A. Volpe National Transportation Systems Center (Volpe Center), in Cambridge, Massachusetts, prepared this report for the Federal Highway Administration's (FHWA) Office of Planning. The project team consisted of Andrew Breck and Paige Colton of the Program and Organizational Performance Division. Mark Sarmiento of FHWA's Office of Planning provided project oversight.
The project team would like to thank the State Departments of Transportation in California, Pennsylvania, South Carolina, Tennessee, and Washington for taking the time to talk about their geographic information systems activities for environmental streamlining. The sharing of their experiences and their review of the case studies presented were essential to creating this report.
Notice
This document is disseminated under the sponsorship of the U.S. Department of Transportation in the interest of information exchange. The U.S. Government assumes no liability for use of the information contained in this document. This report does not constitute a standard, specification, or regulation.
The United States Government does not endorse products or manufacturers. Trademarks or manufacturers' names appear herein only because they are considered essential to the objective of this document.
Quality Assurance Statement
The Federal Highway Administration provides high-quality information to serve Government, industry, and the public in a manner that promotes public understanding. Standards and policies are used to ensure and maximize the quality, objectivity, utility, and integrity of its information. FHWA periodically reviews quality issues and adjusts its programs and processes to ensure continuous quality improvement.
ABBREVIATIONS
EXECUTIVE SUMMARY
This 2012 summary report addresses the current use of geographic information systems (GIS) and related technologies by State Departments of Transportation (DOTs) for environmental streamlining and stewardship, particularly in relation to the National Environmental Policy Act (NEPA). The report presents background information, a series of case studies, and a summary of conclusions. “GIS for environmental streamlining” is abbreviated as “GIS4EST” throughout the document.
In order to develop case studies, the authors of this report interviewed representatives from five agencies about their respective GIS4EST applications, including:
- California DOT's Cultural Resource Database and GIS applications
- Pennsylvania DOT's Proposal Screening Tool
- South Carolina DOT's Project Screening Tool
- Tennessee DOT's Statewide Environmental Management System
- Washington State DOT's Workbench
GIS4EST applications at State DOTs have advanced significantly over the last decade, and it is now much less common for an agency to develop a tool for an individual project. Instead, most current systems are intended to provide long-term support for environmental streamlining over the course of numerous projects.
The conclusion of the report details observations that may be helpful to other State DOTs seeking to implement or improve their own GIS4EST applications. Interviewees noted that collaborations, partnerships, and open communication are essential for success, as is the support of upper management. Interviewees also described the importance of training users, as well as the need for quality control protocols and standards. Some agencies recommended a generic, simple design for GIS4EST applications, as this may provide greater flexibility and ease of use, ultimately improving long-term utility.
1. INTRODUCTION
In 2005, the Federal Highway Administration (FHWA) published the report “Geographic Information Systems for Environmental Stewardship and Streamlining: An Overview of State DOT Practices.”1 That report described how eight State Departments of Transportation (DOTs) were beginning to use GIS to promote environmental stewardship while streamlining the environmental review process that the National Environmental Policy Act (NEPA) and other environmental regulations require. Since then, FHWA has continued its support of the adoption and development of GIS applications for environmental streamlining (from here on referred to as “GIS4EST”). As such, FHWA sponsored the case study research presented here to complement its original effort by providing information on current GIS4EST applications from four additional State DOTs along with an update on one of the 2005 case study applications.
Many Federal, State, and non-profit organizations alike have developed GIS4EST applications to be used at various geographic scales. At the Federal level, some examples include:
- NEPAssist. NEPAssist is a U.S. Environmental Protection Agency (EPA) tool that pulls environmental data from EPA regions' GIS databases to provide immediate screening of environmental assessment indicators for user-defined areas of interest.2
- Environmental Conservation Online System (ECOS). U.S. Fish and Wildlife Service's (FWS) Environmental Conservation Online System is a gateway web site that provides access to data systems in the Endangered Species and Fisheries and Habitat Conservation program areas, as well as other FWS and government data sources.3
- NatureServe's Ecosystem Based Management Tools. NatureServe, a non-profit conservation organization, is working to develop a set of tools that can help implement ecosystem-based management processes in coastal and marine environments and their watersheds.4
These and other national applications, along with the datasets upon which they are based, supplement the important GIS4EST applications that State agencies, including DOTs, are developing and refining. At the State level, GIS4EST tools are also playing important roles in fostering collaboration among stakeholders and ultimately an expedited environmental review process. To learn more about the current state of the GIS4EST practice among State DOTs, the project team conducted a series of interviews with GIS specialists and project managers who manage GIS4EST work at the DOTs in California, Pennsylvania, South Carolina, Tennessee, and Washington. The information gathered in the interviews was supplemented with material compiled via Internet research and from subsequent correspondence and conversations with State DOT staff, forming the foundation for the case studies presented.
2. CASE STUDIES
The following case studies describe a range of GIS4EST tools developed to serve a variety of functions. In the past, GIS4EST applications have been characterized as falling along a spectrum of growth and purpose from “data management” and “interagency cooperation” on one end to “spatial analysis and modeling” and “re-engineering business practices”5 on the other. Based on information collected for this report, evidence suggests these categories still apply, with one additional phase in the span of GIS4EST development proposed: “user-driven evolution of GIS practices.” At the stage of user-driven GIS evolution, the geospatial tool has become flexible enough to enable users to continually influence its growth long after its initial release.
California DOT's Cultural Resource Database and GIS applications
Background
Over the past 12 years, the California Department of Transportation (Caltrans) has developed the Caltrans Cultural Resource Database (CCRD) and GIS Applications, a comprehensive and far-reaching system that combines GIS and a database system with a variety of searchable components to create a tool cultural resources staff members and managers use throughout the NEPA process. CCRD serves as an electronic inventory of architectural and archeological cultural resources, while providing a visual connection to cultural resources along right-of-ways.
Three main factors motivated Caltrans to apply for Transportation Enhancement (TE) funds to develop the CCRD and GIS Applications. First, staff lacked an accurate cultural resources inventory, sometimes leading to unreliable cost estimates during long-range planning. Staff members were also unable to address maintenance issues in the field in a quick and efficient manner as paper-based record searches often took a number of weeks to complete. Additionally, construction crews were unintentionally impacting burial grounds and other important cultural resources, potentially jeopardizing relations with surrounding tribes.
Each of Caltrans' 12 districts received TE funding to create its own system, with the final district currently finishing development of its CCRD system. Caltrans is currently working to integrate all of the systems within an enterprise model in order to create greater design uniformity with a more consistent appearance and message. The department is also exploring options for making the system available as an enterprise system accessible online.
Stewardship and Streamlining
Caltrans primarily uses CCRD and GIS Applications in two stages of NEPA—project scoping and environmental analysis/documentation—and then after NEPA during construction. Previously, Caltrans staff members collected cultural resources data from existing paper records, which district offices/clearinghouses are required to keep per State law. Staff members would then bring the records to Caltrans' information centers to be manually digitized into a GIS and then verified through on-the-ground surveys. Now, CCRD and GIS Applications are used during the scoping phase to create probability-based assessments from GIS layers of morphological and geological features to determine the likelihood of encountering underground archaeological sites.
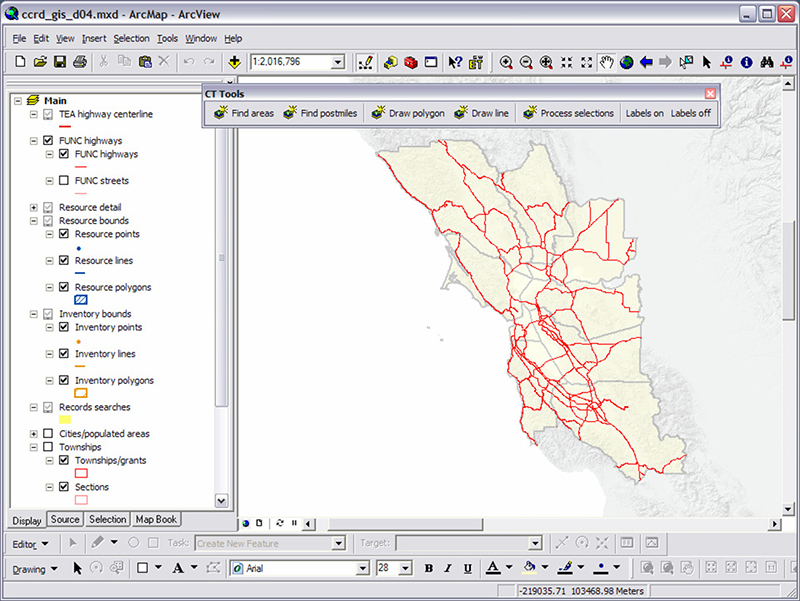
Figure 1. Screenshot of Caltrans Cultural Resource Database and GIS Applications,
displaying Caltrans District 4 highway centerlines and a customized toolbar.
During the environmental analysis and documentation phase, staff members use the CCRD to visualize areas of potential effect, evaluate alternatives, record new archaeological sites, and document the environmental decision-making process. In all phases staff also constantly assess whether there is a need to input additional cultural resources information into the CCRD in order to improve future decisionmaking. For instance, if a worker finds an archeological artifact during the construction phase, the crew can call the district office. CCRD users then view the location in GIS and use the database to locate and record the information along with inventory boundaries, as well as review and update any associated environmental documentation.
CCRD and GIS Applications simplifies information gathering, and Caltrans estimates that some searches that in the past may have taken 2 weeks now only require 15 to 25 minutes.
Application and Data Management
Management of the CCRD and GIS Applications is an ongoing process. Professionally qualified cultural resource staff members are responsible for submitting system updates to the database portion daily; and each district also has a “data steward,” who is responsible for vetting the GIS data before adding it to the system. This steward not only ensures quality control but also provides staff with a known GIS point of contact. Data stewards with an information technology (IT) background have been especially valuable to Caltrans, as they can troubleshoot for system crashes and other IT issues. Adobe Professional, which is tied directly into the system, helps staff work with data. Overall, the GIS Applications exist as a customized version of Esri ArcGIS. Each of the 12 Caltrans districts currently manages and maintains its own system. However, the enterprise system currently in development will be managed by two Headquarters groups: the Cultural Studies Office and the Standard Tracking and Exchange Vehicle for Environmental System (STEVE) team. Each district will continue to have complete control over data management duties and policy development.
Data is also intended to serve other State and local stakeholders. The California State Office of Historic Preservation's regional State information centers are moving toward electronic database systems, potentially allowing for electronic data sharing and avoiding the compounded errors of multiple paper transfers. Additionally, Native American tribes have begun working with Caltrans' regional information centers to coordinate quarterly electronic updates and updates for their own tribal databases. Due to the sensitive nature of cultural resources spatial data, only cultural resources staff and managers are able to view the data; and it exists as a guarded layer on a protected server. Caltrans' staff members provide buffer maps to external State employees, allowing them to view approximations of the cultural resource locations.
Next Steps
Consultants are currently developing the system to more fully integrate the database and GIS components. Soon, users will be able to move seamlessly between the database and GIS. For example, a user will be able to retrieve spatial data from the GIS portion while actively using the database side and vice versa.
In the long term, Caltrans envisions linking the CCRD and GIS Applications system with analogous systems in other States. Caltrans would also like to link CCRD with another enterprise database that it recently developed (The Standard Tracking and Exchange Vehicle for Environmental System, or STEVE) to comprehensively track all environmental commitments. This statewide environmental database does not have an integrated GIS component, so environmental planners cannot seamlessly use the system to generate maps or view data as users might in a program such as Google Earth. One potential solution to these limitations is to integrate the environmental database with CCRD in order to leverage the GIS functionality of the CCRD and GIS Applications. Caltrans believes this would greatly enhance its environmental streamlining efforts.
2.2 Pennsylvania DOT's Proposal Screening Tool
Background
In 2005, the Pennsylvania Department of Transportation (PennDOT) began to lay the foundation for its “Proposal Screening Tool,” in order to comply with Federal requirements; streamline the environmental review process; minimize environmental impacts; and more accurately estimate the scope, schedule, and cost of projects. First implemented in August 2011, the tool allows users to review potential project proposals in the planning and program development stages of transportation project delivery; identify potentially affected environmental resources early; and begin to document Purpose and Need for NEPA documents during planning. The tool also fosters collaboration and facilitates the integration of land use planning with transportation planning. The tool gathers environmental, asset-related, and traffic data and other known information and displays them in a project proposal form that can be circulated for review by various stakeholders.
The development of the screening tool was a collaborative, integrative process. The agency proactively focused on communication during the development of the tool, holding weekly internal meetings, periodic meetings with RPOs and MPOs, and listening sessions with other stakeholders. PennDOT also conducted outreach to the agencies that hold, maintain, and update relevant data layers.
Stewardship and Streamlining
The screening tool provides easy access to the best available resource information early in the planning process, leading to clearer project scopes, budgets, and schedules and more informed decisionmaking when projects are placed on the Long Range Transportation Plan (LRTP) or Transportation Improvement Plan (TIP). Through the early evaluation of proposals, the tool also improves opportunities for collaboration and programmatic mitigation within a watershed or other area, streamlining the preliminary engineering process.
After identifying a specific geographic location for a potential project proposal, PennDOT or a local planning organization, such as a Metropolitan Planning Organization (MPO) or Rural Planning Organization (RPO), can use the screening tool to identify a proposed project location. The tool then automatically analyzes the potential impacts using data from 30 GIS layers and issues a score based on the proposal's proximity to resources. The score populates a proposal form for submittal into the planning review process.
The tool also facilitates collaborative data gathering and decisionmaking, allowing practitioners to add and retrieve information throughout all phases of transportation planning from the LRTP, to the TIP, project development, design, and construction. As a result, resource agencies can provide more effective input, and planning partners can better meet the requirements of planning regulations.
In addition to functioning as a general screening tool, the Proposal Screening Tool also helps practitioners to begin the NEPA scoping process in the pre-TIP phase of project development. It also captures land use information that is useful for supporting the Purpose and Need statements in NEPA documents.
Application and Data Management
The development team used Lotus Domino software to build the proposal forms and Oracle Procedural Language/Structured Query Language to create the analysis and screening portion of the tool. The development of the Oracle component, including the tables and algorithm to perform the environmental screening, took approximately 2 weeks to complete, with PennDOT subsequently thoroughly preparing datasets and testing the tool.
The IT department currently manages the Lotus Domino Forms, and the GIS group in the Office of Planning is responsible for the Oracle Spatial environmental screening and environmental database. When PennDOT staff notice that a relevant data update needs to be made, employees download the information and add it to the Oracle database. Although web map services (WMS)6 could provide automated updates, PennDOT currently avoids using WMS as there is concern that it may slow the tool's operation. The agency is committed to delivering responses to users within minutes of proposal submissions.
PennDOT has used national data sets such as the EPA Envirofacts tool, the National Wetlands Inventory, flood maps from the Federal Emergency Management Agency (FEMA), and soil data from the Natural Resource Conservation Service. However, in some cases, national data sets are not as useful to PennDOT as State or regional data. For example, Chapters 102 and 105 of the Pennsylvania Code include unique definitions of stream water quality that would not be adequately addressed by a national database. For this reason, PennDOT used State-level information to generate the appropriate data layers.
Next Steps
The creation of the first version of the tool cost approximately $1 million. PennDOT is currently updating the tool and has spent $500 thousand on that effort, not including staff time. Although PennDOT has not yet been able to quantify the benefits of the tool, approximately 1,000 projects have used the Proposal Screening Tool to date, including one Environmental Assessment and two Environmental Impact Statements. New projects added through the 2013 TIP update are required to use the tool to submit proposals.
In the future, PennDOT plans to:
- Incorporate additional data layers and automate updates. PennDOT would like to integrate the State's Threatened and Endangered Species database and a “community parks” layer to the tool when it becomes available. PennDOT is also interested in developing a mechanism that provides automated updates or notifications of available updates when changes have been made in the tool.
- Implement auto-populating of NEPA scoping forms. PennDOT is developing an interface that will automatically transfer data from the screening portion of the tool (pre-TIP) into the scoping form that is used for Categorical Exclusions in the NEPA process. PennDOT anticipates that this will be accomplished within 6 to 8 months.
- Improve resource layer mapping. Currently, queries in the Proposal Screening tool only return impact scores for specific points on a map. For instance, the tool will report the proximity of the nearest wetland, but it will not show the locations of nearby wetlands in relation to the proposed project location. In the future, PennDOT would like to develop the ability for users to better visualize neighboring resources on the map.
2.3 South Carolina DOT's Project Screening Tool
Background
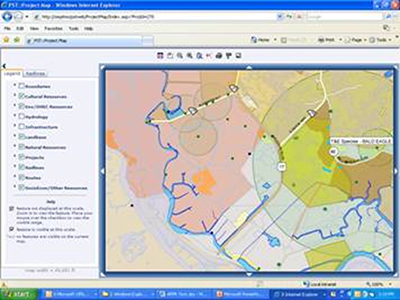
Figure 2. Screenshot of the SCDOT Project Screening Tool showing the environmental features that are part of a proposed project. The large circle represents an endangered species habitat, the green a survey area for historical artifacts, the light purple wetland areas, and the light brown an area where minorities comprise more than 50 percent of the population.
The South Carolina Department of Transportation (SCDOT) Office of Planning and Environmental Management Office recently developed a web-based Project Screening Tool (PST), primarily used to evaluate projects identified in LRTPs. The tool assists agencies, including SCDOT, the FHWA, South Carolina Department of Health and Environmental Control, South Carolina Department of Archives and History, U.S. Army Corps of Engineers, FWS, and others, in identifying potential project impacts on human and natural resources. The system also allows users to contribute comments and other needed documentation to the evaluation process. Early identification of potential impacts can facilitate the proactive modification of project proposals or even the removal of untenable projects from consideration, ultimately resulting in time and cost savings for the SCDOT project planning process.
Several years prior to the development of PST, SCDOT began generating an Advanced Project Planning Report (APPR), which is a preliminary evaluation conducted within a study area to identify a proposed project's potential benefits, impacts, and areas of concern related to the human and natural environment. The APPR required a time-intensive process that involved burning CDs to share large documents and collecting other agencies' input. This inspired the development of PST in order to expedite that process. SCDOT wanted to build a system in which agencies could easily access GIS data, provide input to a project, and upload or download documents electronically. Based on these priorities, SCDOT and Intergraph, a geospatial software vendor, developed PST in approximately one year, starting in 2008 and completing the system in 2009. Overall, the application cost approximately $250,000 to develop.
Stewardship and Streamlining
PST is used in pre-transportation planning stages to evaluate projects that have not yet been funded. Representatives from different agencies typically attend a field review meeting at the site of proposed projects. They then return to their work stations and use PST to select one or more of the four data categories that best applies to their review to further analyze the potential effects the projects may have, ranking potential impacts and uploading comments and documents necessary for the APPR more efficiently. Other functions of PST include a project search tool, the ability to map and evaluate project alternatives, and aerial photos and pavement condition data to help evaluate impacts.
Currently, practitioners do not directly use PST in the later stages of the NEPA process, but the tool does facilitate NEPA scoping. When a project proceeds into project development, problem areas have already been identified, facilitating subsequent steps in the NEPA process. Before the development of APPR and PST, consultants would design a project to sometimes only later discover issues, forcing a costly revision of the design and/or alignment.
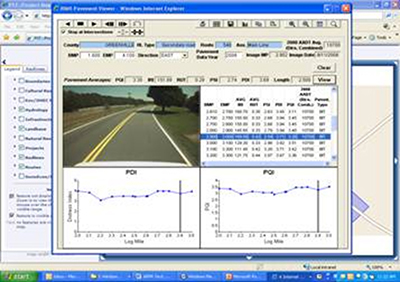
Figure 3. Screenshot of the SCDOT Project Screening Tool displaying a road segment's Pavement Video Log. The charts and graphs show the Pavement Quality Index (PQI) and Pavement Distress Index (PDI) of the roadway.
Another benefit of the system is that it streamlines the APPR process. The application contains all the data from the agency's dataset so users do not need to spend time searching for the data in other locations, and users can easily upload and download comments and documents for each project. The system is also very user-friendly and allows GIS users of all abilities to quickly and easily view the issues most pertinent to their evaluations. Users can now open PST, select one of the four data categories that applies to their work, and visualize the potential impacts of the project.
Application and Data Management
A SharePoint system is currently used to upload and download data, which is assigned to one of four categories: Natural Resources, Environmental/DHEC Resources, Cultural Resources, and Socioeconomic/Other Resources, creating a clear method for users to sort through data. SCDOT creates a file for each project to which project details, impacts, files, and alternatives are added. PST data is updated annually from shapefiles, a geospatial data format, that various State and Federal agencies provide SCDOT.
Next Steps
While there are no current plans to update PST due to funding constraints, there are numerous functions and uses that the SCDOT Office of Planning and Environmental would eventually like to add. Some modest changes it believes would be helpful include a “notice of meeting” function that sends a meeting reminder to all representatives for field vision meetings and the ability to calculate all project impacts within a specified buffer zone. In the long term, SCDOT would like to expand the use of PST beyond the environmental context into safety; and the agency would like to use the system to track projects from conception to completion.
2.4 Tennessee DOT's Statewide Environmental Management System
Background
The Tennessee Department of Transportation (TDOT) is undertaking a department-wide initiative to improve communication with and participation of local communities and environmental resource partners in the agency's transportation project delivery process. An important component of the initiative is the Statewide Environmental Management System (SEMS), a workflow-driven GIS-based web application intended to facilitate collaboration and communication among TDOT and its partners throughout the planning, project development, and environmental permitting of transportation projects.
The SEMS application, which is currently under development, includes a GIS-based database of environmental data, GIS analysis tools, a workflow engine to drive review and decisionmaking activities, and a project repository and web-based collaboration environment to allow the review of data and documents. By creating a centralized location to access GIS data and project specific information, SEMS will eliminate the need to store redundant information in multiple locations and improve information sharing and collaboration between transportation and resource agencies.
Users will include TDOT staff in environmental and planning divisions, FHWA, Federal and State resource agencies, and metropolitan and regional planning organizations. To incorporate the needs and permission levels of multiple users, the SEMS system is role-based. Each user has a specific role, and access to data is determined based on that role. All users will view the same interface, but the available content will differ. For example, only certain users will have access to sensitive resource data. TDOT will also likely grant limited public access to certain aspects of the tool in order to improve information sharing regarding the status of project development activities.
Stewardship and Streamlining
SEMS is a process-driven application designed to better link early planning and the environmental document phases of project development. In addition to functioning as a tool for information gathering and analysis, it will provide form templates and allow managers to assign tasks. When a user completes or assigns a task, the next relevant employee, consultant, or partner will receive an email notification. For example, local planning organizations can use SEMS to indicate locations where transportation improvements are needed. Those proposed project locations will then pass electronically to the TDOT project planning office for approval. If approved for funding, the information for each project will pass electronically to the environmental office where TDOT staff will tentatively determine whether the project should be processed as a CE, an EA, or an EIS. TDOT staff will then use the system to submit this information to the FHWA Division Office for approval, which will begin the formal NEPA process. The templates for these electronic notifications are all available within SEMS, and users will be prompted to fill in information which will automatically populate forms. All documents will be stored in the document library and will be easily retrievable. The system also includes a “contact manager” so that the user will be able to maintain contact lists for each project and email updates prior to public meetings. Finally, SEMS will allow users to record comments and maintain a journal as the NEPA process proceeds. This will ensure that the administrative record is complete and accurate.
The system is anticipated to save TDOT more than $20 million annually through the elimination of redundant efforts and improved efficiency. These savings will not be limited to the environmental division but will extend throughout design, construction, permitting, and other program areas.
Application and Data Management
Before developing SEMS, TDOT investigated the Florida Department of Transportation's Efficient Transportation Decision Making (ETDM) system, which formed the foundation of TDOT's vision for SEMS. The actual construction of SEMS took place over a two-year period. Many TDOT program offices participated in the development of SEMS, including TDOT Executive Management, Information Technology, Long Range Planning Office, Short Range Planning Office, Project Safety Office, Conceptual NEPA Planning Office, Environmental Documentation Office, and various other technical environmental study groups.
SEMS is composed of three main components: application servers, ArcGIS servers, and Oracle servers with a network and server load balancer. The application is built on Windows Server 2008 x64 R2 with Internet Information Services (IIS) 7.5 and the Microsoft .NET Framework version 4.0.
The SEMS system will allow agencies and other users to update GIS-data on an ongoing basis, which will help to ensure that the data is current. All updates will be submitted to a database administrator who will vet the information to ensure that data is compatible, clean, and virus free. Resource agencies who receive funding support from TDOT will be required to submit data updates on an ongoing basis.
TDOT has developed a training plan to educate staff and stakeholders on the use of the SEMS system. The plan includes both instructor-led training as well as an online suite of training tools, techniques, and instructional videos.
Next Steps
TDOT plans to release SEMS by the fall of 2012.
2.5 Washington State DOT's Workbench
Background
More than 10 years ago, the Washington State Department of Transportation (WSDOT) developed an Environmental GIS Workbench that served as a tool for high-level environmental scoping by providing easy access to GIS data and custom applications. It was so successful that WSDOT re-designed it to serve more than just environmental business groups within the agency. Formerly the “Environmental GIS Workbench,” it has been renamed the “GIS Workbench” to reflect its broad application and use across the agency, but still has retained a specific interface customized for environmental support. The environmental uses of the Workbench have evolved since its inception, and it is now used for NEPA CE documents, State regulatory processes, and local permitting and scoping.
Stewardship and Streamlining
WSDOT staff use the GIS Workbench during the NEPA process, in complying with State environmental requirements, and for local permitting activities. Originally, the data contained in the GIS Environmental Workbench were adequate only for scoping. The GIS Workbench is now also used on a regular basis for CE research and finalization. Staff members assisting with EAs and EISs also use the GIS Workbench to help develop required discipline reports. Specialists in biology, hazardous waste, and cultural resources are among the most extensive users of the GIS Workbench. WSDOT's GIS service desk partners with a GPS service desk that assists users in generating field data that will eventually be included in discipline reports.
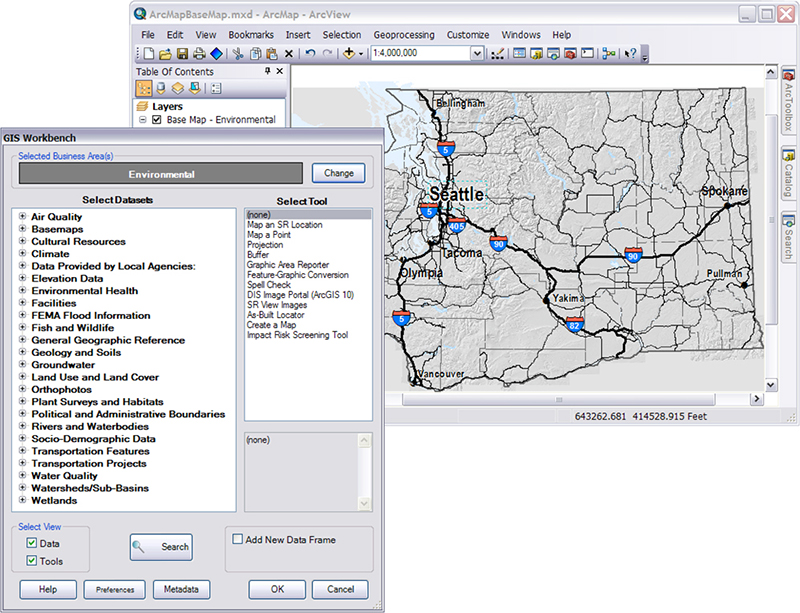
Figure 4. Screenshot of WSDOT's GIS Workbench main menu (left)
and opening basemap for environmental support to project planning and development (right).
The main costs associated with the GIS Workbench are maintenance and personnel expenses. The equivalent of 2.5 full-time employees is needed to maintain the system, and software upgrades are necessary every few years; the most recent upgrade to the latest version of ArcGIS cost approximately $25,000. Additionally, although WSDOT has not quantified the cost and time savings associated with GIS Workbench, there is a general recognition within the agency that the tool, and especially its environmental component, is a fundamental and necessary tool for the agency. One user noted that the GIS Workbench allowed users to collect necessary data in a matter of hours instead of the 2 to 3 weeks needed previously.
Application and Data Management
Although the reach of the Workbench has grown tremendously, the basic implementation of the tool has not changed since the tool's inception: it began as an ArcView 3 extension and is currently an ArcGIS 10 extension. However, to make the Workbench a tool for multiple business groups within the agency, it was redesigned as a database-driven application so that new data, tools, and business areas can be added to the user interface by updating database tables rather than deploying new code. To minimize use of limited ArcGIS licenses, some functionality, such as the ability to locate by State mile posts, has been extended to a customized ArcGIS Explorer called TransMapper.
The GIS Workbench is updated on an ongoing basis as program specialists submit new information or request additional data. In this way, additional business areas become new users, and the system continues to expand and evolve organically. Users are responsible for ensuring that the data layers are current for their respective disciplines, and, over time, the GIS data in the Workbench have become more accurate and detailed. This is in part due to the data management/maintenance routine for new data sets that WSDOT has instated. When the support team receives a new dataset, the team evaluates the type of update cycle needed and select from the following: no updates, ad-hoc updates, or regular updates (at an established interval). WSDOT also has agreements in place with some State agencies to ensure that data they provide remain current.
Day to day, WSDOT staff members update data, create metadata and customer-oriented layers, maintain a help desk, and offer outreach training resources. Personnel working on developing the Workbench reach out to environmental staff every 2 years to assess current and future needs in order to increase the Workbench's functionality.
Next Steps
WSDOT is currently working toward integrating real-time data by increasing the use of web-based data services. However, these services are often packaged as map services instead of features services, currently preventing their integration into Workbench.
3. CONCLUSIONS AND LESSONS LEARNED
GIS4EST applications at State DOTs have advanced significantly over the last decade. According to those interviewed, State-specific needs have been the primary catalysts for GIS4EST improvement. Over time, GIS4EST applications have evolved to be systems more intended for providing long-term support for environmental streamlining rather than solely for streamlining one project. Most interviewees mentioned that the GIS4EST experiences from other, early-adopter State DOTs provided helpful insights in the development of their applications. For example, Florida DOT's early development of their ETDM application set a well-designed and successful early example.
Among those interviewed, the specific business drivers under the unified purpose of streamlining the NEPA process varied. For example, both PennDOT and WSDOT wanted more effective and efficient project scoping in order to minimize environmental impacts and more accurately estimate the scope, schedule, and cost of projects. SCDOT built its application to streamline its recently developed APPR process and to improve the ease of interagency cooperation. TDOT went beyond proposal evaluation and focused on improving all phases of planning and project development. Caltrans' main goals, on the other hand, were to ensure more accurate cost estimation for long-range planning and improve maintenance and construction processes.
In many cases, it is not only the use of an application but its actual development that has encouraged more comprehensive stakeholder interaction. Many State DOTs used a collaborative process to develop their respective tools, ushering in a new level of coordinated effort that would not have resulted from reliance solely on national geospatial tools.
Moving forward, the following lessons learned may be helpful to other State DOTs seeking to implement or improve their own GIS4EST applications:
Florida DOT's Efficient Transportation
Decision Making (ETDM) Process
FDOT developed its ETDM application in cooperation with Federal, State, and local agencies in order to streamline the transportation planning and project development processes, while continuing to steward Florida's natural and human environments. FDOT set an early example by initiating the development of this system in response to the Transportation Equity Act for the 21st Century of 1998.
FDOT brought together 10 Federal agencies, 6 State agencies, 5 water management districts, 2 tribal organizations, the National Advisory Council on Historic Preservation, and the State Historic Preservation Office. Each participating organization was asked to designate a point of contact to serve on multi-agency working groups. In the end, 24 agencies signed an MOU committing them to continue development and implementation of the EDTM process.
For more information on FDOT's ETDM, see:
- ETDM website at https://etdmpub.fla-etat.org/est/
- FHWA's Environmental Toolkit website at www.environment.fhwa.dot.gov/env_initiatives/pel/case_florida.aspx
- FHWA's 2005 GIS4EST case study report at http://gis.fhwa.dot.gov/documents/GIS_ESS.htm#Florida
3.1 Collaborate and Build Partnerships
Developing and maintaining collaboration between agency program areas and external users is essential to the successful development of a GIS4EST application. This process can help build awareness and a sense of ownership for the tool, ensuring the system meets user needs. Collaboration can also better prepare stakeholders to use the system while encouraging changes in business practices that allow the tool to maximize efficiency.
Active collaboration with partners assisted both TDOT and PennDOT with the development of their GIS4EST tools. Staff from all TDOT program areas participated in building SEMS, ensuring its design fit their needs. PennDOT established active communication with local planning partners throughout the development of the tool and held monthly agency coordination meetings between local planning partners and resource agencies, which allowed the tool to address mitigation from a programmatic level rather than a project level. These efforts helped PennDOT to achieve consensus and move quickly towards implementation.
Both SCDOT and Caltrans experienced some resistance to GIS4EST tool implementation due to insufficient coordination with other agencies. For example, the main challenge SCDOT has encountered since the development of PST is that many agencies that use the system are still required to write hard copies of legal letters instead of filling out a similar, electronic form in the system itself. SCDOT noted that cooperation and coordination is essential to establishing the trust needed to achieve this change. Caltrans found it essential to build bridges between GIS staff and Information Technology (IT) staff when developing and implementing its CCRD and GIS Applications.
3.2 Seek Upper Management Support
While agency leadership may not be active users of the GIS4EST tool, having committed and consistent support from leaders can help a system gain support from other organizational areas and weather both administration changes and budget fluctuations. For example, in Tennessee, support for the creation of SEMS was variable due to changes in leadership during the development process, which delayed the implementation of the tool.
Through the development of the GIS Workbench, Caltrans staff emphasized to upper management the role of GIS as a foundational tool for environmental and planning professionals. Upper management support was essential in ensuring committed support from IT and other environmental units and in developing and sustaining the vision of an enterprise platform through periods of steep budget cuts.
3.3 Consider a Generic Design
Avoiding an overly complex system design can increase a tool's ease of use and allow it to be developed in a more user-driven fashion, increasing its flexibility and longevity. For example, SCDOT decided to develop its PST in phases, improving user satisfaction within the agency.
At WSDOT, the Workbench has undergone an incremental, user-driven evolution process because of the relatively straightforward and generic nature of the original. In fact, the original Environmental GIS Workbench tool was so successful that a broader tool was developed based on the same principles to cater to additional needs. The user-friendly nature of the Workbench has helped make it flexible without compromising the ability to use of all of the tools provided by the GIS software program.
3.4 Create Quality Control Standards
Setting and maintaining high standards for data accuracy, quality, and consistency is an important part of developing any GIS-based system. It is important that State DOTs think strategically about developing these standards, assigning clear roles for data maintenance and identifying upfront the necessary level of data quality.
Caltrans addressed the issue of data maintenance by hiring dedicated data stewards. After staff members add their data into Caltrans' system, the data stewards check this data for accuracy and consistency daily before it is submitted into the database. Data stewards not only ensure quality control but also provide others within the agency with a known GIS point of contact.
WSDOT emphasized the importance of consistent and detailed metadata for all datasets. Informative metadata allows users to decide for themselves whether a particular data layer is appropriate for their use. Additionally, Workbench users build custom layer files in order to make the data more accessible for business users. This helps to maintain consistency across all of the maps that are created using the Workbench.
3.5 Maintain Open Communication with Internal and External Stakeholders
Frequent and transparent communication with interested parties or future application users can help ensure that the effectiveness of GIS4EST tools is maximized. For example, TDOT found that it was essential to build awareness and develop a sense of ownership among future TDOT users throughout all phases of the project. Staff from all TDOT program areas participated in building SEMS in order to ensure that the system will fulfill program requirements. Early engagement has also helped to ensure that the agency will be ready for the system when it goes live, proactively addressing any resistance to change that may have existed.
Similarly, PennDOT established active collaboration with local planning partners and focused strategically on communication throughout the development of its GIS4EST tool. This strategic effort allowed the agency to more effectively achieve consensus and move quickly towards implementation. Monthly agency coordination meetings between PennDOT, local planning partners, and resource agencies provide an opportunity to use the tool to approach mitigation from a programmatic level rather than a project level.
3.6 Develop Training Strategies
State DOTs should be strategic in how they train users in applying GIS4EST tools. Although GIS technology has been in use for decades, exposure to GIS tools remains limited for some staff members, and many existing business practices were not put in place with the use of GIS in mind. Caltrans, for example, has developed a detailed user guide along with two separate training trajectories for Caltrans staff: beginner and advanced. This two-pronged approach has ensured that all future users can develop their respective skillsets at appropriate speeds. Through this training, novice users are taught to access historical maps, display overlays, and link projects to GIS data in approximately 1 hour.
APPENDIX A: INTERVIEW GUIDE
Introduction and Background
- What is the goal or purpose of the application?
- Will you use it to track continuing/long term changes or is it just related to a specific project?
- Who are its primary users?
Development
- What business drivers inspired its development?
- Who was involved in the development?
- How long did it take?
- When was it developed?
- What hardware and software were used to generate this application?
Management/Maintenance
- How will the application be managed and maintained? (i.e. how will you collect, standardize, host, and update the data and metadata?)
- Is this a joint project with another agency (or multiple agencies)?
- Are you aware of nationally available datasets, and are these useful?
- How will you train staff and/or the public to use this application?
- How have you addressed the issue of data quality/accuracy?
- Is it only an internal tool or is there a general public version?
- Do all users have the same level of access to the data?
- Do all users use the same interface to access the data?
Stewardship and Streamlining: Benefits
- What are the benefits of this product?
- How has the application improved agency decision-making in terms of planning, project design, and/or maintenance?
- How is success being measured?
- Are there environmental issues that you can now address that you couldn't before?
- Has the GIS application fostered new types of inter-agency collaboration? How?
- How do NEPA practitioners use this?
- At what stage of the NEPA process is this application useful?
- Can you provide an example of a successful use of the product? (e.g. internal design coordination for public and agency involvement, etc.)
Stewardship and Streamlining: Savings
- Can you tell us about cost and/or staff time savings achieved through the GIS application? What are the costs relative to overall project costs?
- How much has it cost to develop the application? Who is paying for the application?
- Can you estimate the amount of money and staff time?
- Can you estimate how much it sped up project implementation?
- How does the cost to date compare with cost estimates made early in the project?
Next Steps and Lessons Learned
- What was institutional support/lack of support like for this project? Upper management support?
- What have you learned from this project? Biggest successes? Biggest obstacles?
- What challenges/obstacles have you or your agency encountered? How have they been addressed/handled?
- What feedback/responses have you gotten, either internally or from the public/partnering agencies/whoever-else-is-involved?
- Have your efforts been documented?
- Do you have any plans to update and/or change the current application?
- What words of advice would you give to other States that are thinking of undertaking a similar project?
- What plans do you have for expanding, modifying, or scaling back your use of GIS in the future?
APPENDIX B: CASE STUDY CONTACTS
Caltrans
Lissa McKee
lissa_mckee@dot.ca.gov
510-622-5458
Anmarie Medin
anmarie_medin@dot.ca.gov
916-653-6187
Carie S. Montero
carie_montero@dot.ca.gov
510-286-5636
Florida DOT
Peter McGilvray
Peter.McGilvray@dot.state.fl.us
850-410-5885
Pennsylvania DOT
Frank DeSendi
fdesendi@pa.gov
717-787-3738
Brian O'Hare
bhare@pa.gov
717-783-9359
Brian Wall
bwall@pa.gov
717-772-0827
South Carolina DOT
Nasser Vakili Rad
RadNV@dot.state.sc.us
803-737-4661
Tennessee DOT
Lori Kirby
Lori.A.Kirby@tn.gov
615-253-2473
Washington State DOT
Elizabeth Lanzer
LanzerE@wsdot.wa.gov
360-705-7476
https://gis.fhwa.dot.gov/documents/GIS_ESS.htm.