USES OF CLOUD TECHNOLOGIES FOR GEOSPATIAL APPLICATIONS
Case Studies of Select Transportation Agencies
November 2013
| Prepared for: Office of Planning Federal Highway Administration U.S. Department of Transportation |
Prepared by: Organizational Performance Division John A. Volpe National Transportation Systems Center Research and Innovative Technology Administration U.S. Department of Transportation |
TABLE OF CONTENTS
- LIST OF FIGURES
- LIST OF TABLES
- ACKNOWLEDGMENTS
- EXECUTIVE SUMMARY
- 1. INTRODUCTION
- 2. OBSERVATIONS
- 3. CASE STUDIES
- APPENDIX A: LIST OF INTERVIEW AND PEER EXCHANGE PARTICIPANTS
- APPENDIX B: INTERVIEW GUIDE
- APPENDIX C: PEER EXCHANGE AGENDA
- APPENDIX D: PEER EXCHANGE ROUNDTABLE QUESTIONS
- APPENDIX E: ESTIMATED RETURN ON INVESTMENTS
- ENDNOTES
LIST OF FIGURES
- Figure 1. Types of cloud service models
- Figure 2. IPLAN platform design
- Figure 3. ITD's security configuration for IPLAN
- Figure 4. The MUTTS application and utility location viewer in eGIS
- Figure 5. Cycle MD mobile application showing how users can choose bicycle routes based on different conditions
- Figure 6. Relation of the MD iMap templates within the cloud configuration
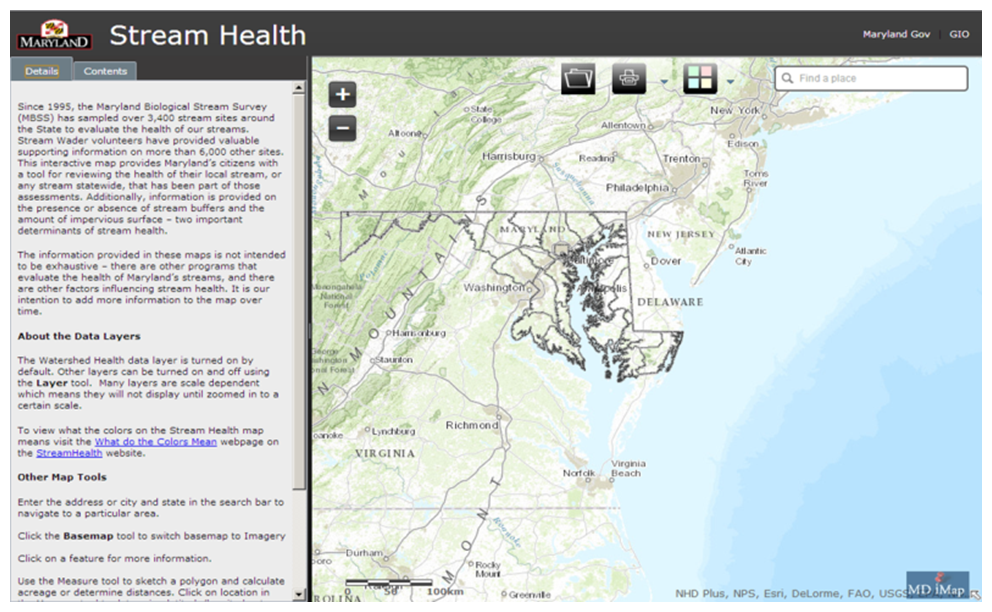
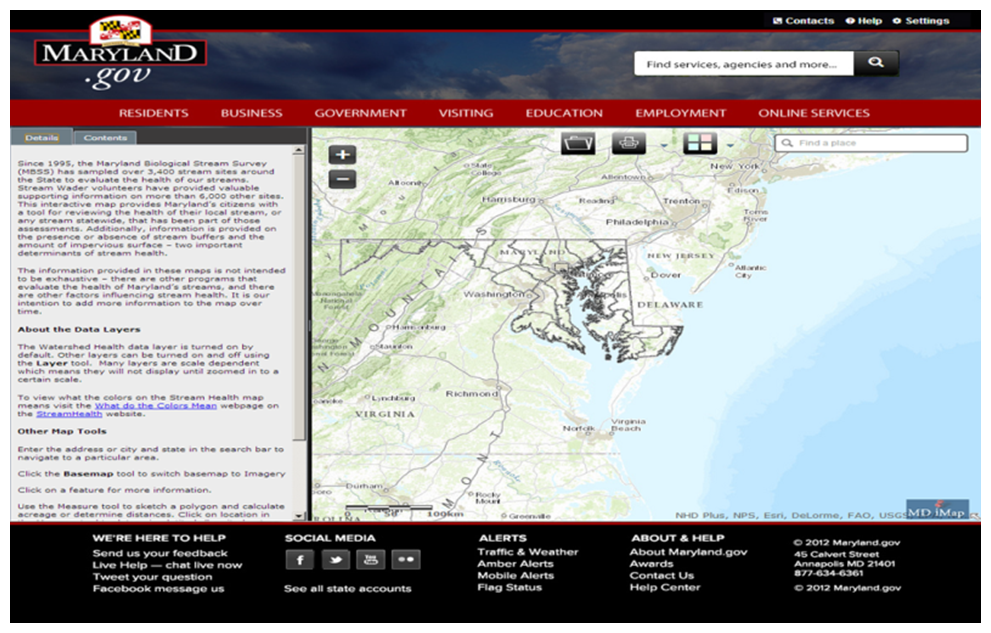
- Figure 7. Top screenshot showing MD iMAP's StreamHealth application as it currently exists when accessed through MD iMAP's ArcGIS Online portal. Bottom screenshot showing the StreamHealth application in ArcGIS Online when the template is applied
- Figure 8. Configuration of the Franklin County LBRS system
- Figure 9. Screenshot of customized topographic base map, with environment and parcel data added
- Figure 10. Screenshot of metrics for the Utah Unified Transportation Plan Map in UPlan
- Figure 11. Transportation deficiency map developed by WATS using Google Fusion and Tables
- Figure 12. Maps in Mi Community Remarks with proposed projects in the LRTP depicted with colored pins
LIST OF TABLES
- Table 1. Cloud deployment models
- Table 2. Configuration and deployment models used by interviewed agencies
ACKNOWLEDGMENTS
The U.S. Department of Transportation John A. Volpe National Transportation Systems Center (Volpe Center) in Cambridge, Massachusetts prepared this report for the Federal Highway Administration's (FHWA) Office of Planning. The project team included Alisa Fine and Paige Colton, both of the Volpe Center's Organizational Performance Division, and Jaimye Bartak of Cambridge Systematics.
The Volpe Center project team wishes to thank the staff members from several organizations nationwide, listed in Appendix A, for providing their experiences, insights, and editorial review. The time they kindly provided was vital to preparing the case studies and reviewing this final report.
EXECUTIVE SUMMARY
Public agencies are increasingly turning to cloud technology to help streamline workflows and allow data sharing among a broader audience. In particular, transportation agencies are beginning to use cloud computing to more easily store, manage, manipulate, analyze, and share geospatial data and business information. Cloud technology can replace traditional data-sharing mechanisms such as File Transfer Protocol (FTP) sites by displaying data in an interactive manner. Even modest efforts to use cloud technology have led agencies to ask fundamental questions about how transportation agencies will conduct business in the future.
Great potential exists in using cloud technologies to support GIS applications, but their use is still evolving. To explore this in more depth, the Federal Highway Administration (FHWA) and Volpe National Transportation Systems Center (Volpe Center) interviewed selected agencies and developed case study reports that document these agencies' GIS and cloud computing initiatives. FHWA also sponsored a peer exchange that brought participating agencies together to discuss their experiences in greater detail. The resulting case studies presented here include:
- Idaho Transportation Department's IPLAN
- Maryland Department of Transportation's Miss Utility Tracking System (MUTTS), interactive mobile applications, iMap Application templates, and Enterprise GIS system
- Ohio Department of Transportation and Mid-Ohio Regional Planning Commission’s Location Based Response System (LBRS) programs
- Utah Department of Transportation's UPlan
- Washtenaw Area Transportation Study's long-range transportation plan deficiency maps and Mi Community Remarks application, and interagency data sharing initiative.
This report is expected to support GIS practitioners and decisionmakers to identify examples of noteworthy practices, consider the pros and cons of using cloud technologies for GIS applications, and determine how cloud technology can be best used to support their own business practices.
The majority of the participating agencies are still in the early stages of determining how they can most effectively use the cloud in their GIS activities; all are planning to expand their use of the cloud to serve additional business needs of their organizations. The agencies have explored a variety of cloud deployment models and have generally come to prefer off-the-shelf or third-party platforms over developing applications with original or customized code.
These initial efforts have yielded significant and sometimes unexpected benefits to the agencies' GIS activities, business operations, and partnerships. The cloud has increased the user base and impact of spatial data and reduced the time and costs associated with managing and displaying GIS data. Agencies have also been able to foster and strengthen multi-agency collaboration and partnerships, and enhance their interactions with the public.
As transportation agencies have begun to encounter challenges with implementing cloud technologies related to data security, procurement policies, and leadership support, they have started reconsidering the role and purpose of information technology systems and security; data storage, maintenance, and collection; and how to add value to geospatial data and visualization. As they experience successes and lessons learned in these areas, and as technology rapidly advances alongside their progress, agencies believe that cloud computing is destined to greatly influence the way that transportation agencies conduct their business in the future in terms of efficiency, transparency, and cost-effectiveness.
1. INTRODUCTION
For many years, access to databases, networks, web services, and various other computing resources at public transportation agencies was largely limited to transportation agency staff. As computing technologies have evolved, the term “cloud computing,” commonly referred to as “the cloud,” has emerged to describe a way of linking these resources via the Internet to provide information to both internal and external users. More than simply a way to exchange information, the cloud also enables agencies to share processing and visualization tools. This allows agencies to present data in a more interactive manner than with traditional data-sharing mechanisms, presenting opportunities for expanded sharing of geospatial information.
To explore how transportation agencies are using the cloud to support geospatial applications, the Federal Highway Administration (FHWA) and the Volpe National Transportation Systems Center (Volpe Center) interviewed select transportation agencies and developed a series of case studies focusing on their experiences using cloud-based applications. As a follow-up to the case studies, FHWA sponsored a peer exchange in Boise, Idaho, on May 9-10, 2013, which convened case study participants to discuss their experiences in greater detail.1
Participants in both the case study interviews and peer exchange included staff and representatives from the Idaho Transportation Department (ITD), Maryland State Highway Administration (MDSHA), Maryland State Transportation Authority (MDTA), Ohio Department of Transportation (ODOT), Mid-Ohio Regional Planning Commission (MORPC), Utah DOT, and the Washtenaw Area Transportation Study (WATS). Staff from the North Carolina DOT (NCDOT), the Utah State Geographic Information Council, and a consultant from BioWest Inc., currently assisting ITD with the development of its cloud-based application, also participated in the peer exchange. Appendix A includes a complete list of participants.
ITD hosted the peer exchange at its offices in Boise (see agenda in Appendix C). Participants demonstrated their respective agency's current use(s) of the cloud to support geospatial applications and then participated in four roundtable discussions. These roundtables focused on areas of interest identified during the telephone discussions, including: (1) defining the cloud and why its use is important in geospatial applications; (2) deploying the cloud to users and different configurations for cloud technologies; (3) strategies used to implement cloud-based technologies; and (4) overall trends and new areas of opportunity for using the cloud to support geospatial applications. Appendix D provides a list of questions proposed or discussed during the roundtables.
The purpose of developing the case studies and holding a peer exchange was to allow transportation agencies, including State and regional transportation agencies, the opportunity to:
- Identify the state of the practice in using the cloud to support geospatial applications;
- Share related experiences, including technical approaches and innovative examples;
- Discuss benefits, challenges, success factors, and lessons learned;
- Identify potential opportunities to expand the use of the cloud in geospatial applications; and,
- Support such an expansion through networking and the formation of a community of practice.
The case studies and peer exchange were conducted as part of FHWA's GIS in Transportation program.2 Through technical support, resources, and capacity-building opportunities, the program aims to assist transportation agencies in more effective uses of GIS and geospatial applications.
The Cloud: Definition and Use
Defining the Cloud
The term “cloud” does not describe a new technology but rather a way of purchasing, sharing, and distributing computing resources. There are many definitions of what constitutes the cloud. This report uses the National Institute of Standards and Technology's (NIST) definition, which is endorsed by the General Services Administration (GSA).3 According to NIST, cloud computing “is a model for enabling ubiquitous, convenient, on-demand network access to a shared pool of configurable computing resources (e.g., networks, servers, storage, applications, and services) that can be rapidly provisioned and released with minimal management effort or service provider interaction.”4
Core characteristics of the cloud include the following:5
- On-demand access. Services are available automatically, regardless of the user's location, and consumers are not required to interact with each service provider. Consumers do not necessarily need technical knowledge of computing services to be able to access and share information.
- Broad network access. Services are accessible over a network and available to any device connected to that network, from enterprise servers to individual desktop computers to web-enabled smartphones.
- Resource pooling. Computing resources (e.g., bandwidth, storage, memory) are pooled to serve multiple consumers and can be dynamically adjusted to address varying demand. One server can be converted into many virtual machines, which contributes to economies of scale for the consumer.
- Rapid elasticity. Computing resources and capabilities can be rapidly adjusted depending on the level of consumer demand or unpredictable traffic fluctuations. Consumers have few restrictions, if any, in their ability to access computing resources at any time.
- Measured service. Vendors use a pay-as-you-go pricing model, where subscribers pay for services based on resources used.
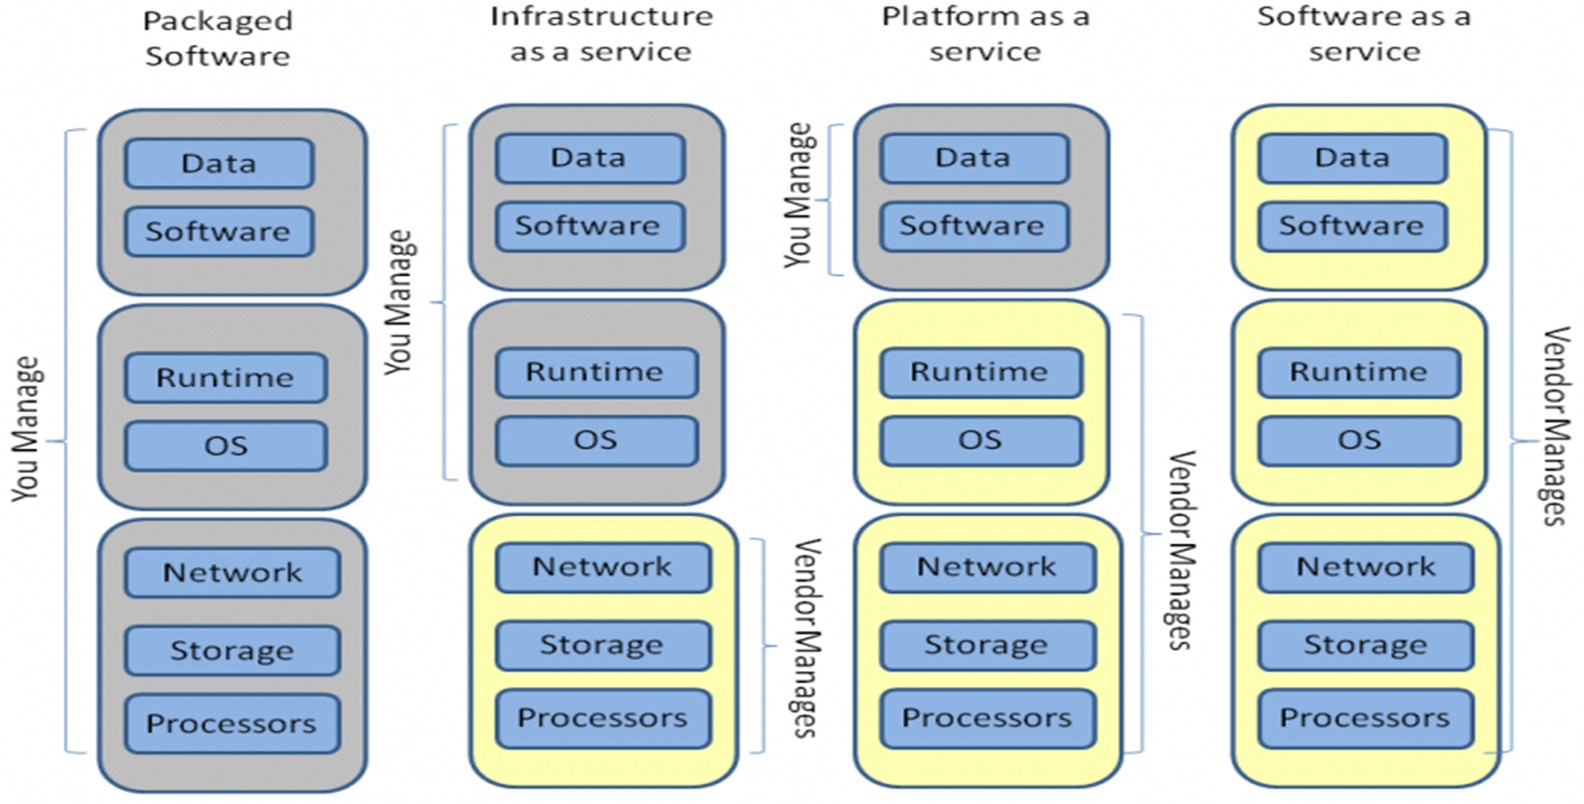
There are various implementation models for cloud-based computing services. For example, services may be implemented via computing infrastructure, software, or platforms (see Figure 1).6
A cloud service implemented through computing infrastructure (“infrastructure as a service,” or IaaS) is a complete package of computing functionality, including hardware, software, servers, and networking components. A user accessing an IaaS application needs only a web connection; through this connection, the user has extensive flexibility to design, develop, and manage a variety of cloud-based applications ranging from small-scale websites to large enterprise systems. IaaS is the most robust implementation model because it allows the subscriber maximum flexibility to customize software and operating systems (OS) for sharing, storage, and manipulation of data.
A cloud service can also be implemented through software (“software as a service,” or SaaS). SaaS provides one or more software applications designed for specific purposes as opposed to the complete package of computing functionality of IaaS. SaaS services are typically vendor-managed and vendor-designed “out of the box” applications, with some customization possible by users.
Cloud services implemented through a platform (“platform as a service,” or PaaS) fall in between IaaS and SaaS in terms of functionality. PaaS services provide users with some flexibility to customize applications but these changes are tied to the vendor's specific OS and network environment.
Figure 1. Types of cloud service models.7
In addition to these service models, there are also several different deployment models through which different user groups can manage and access data. Table 1 provides additional detail.8 Agencies typically identify who needs access to the cloud and what information will be shared to identify an appropriate cloud deployment and service model to use when developing an application that uses cloud computing.
Use of the Cloud for Geospatial Applications
The public sector is increasingly adopting cloud technology to streamline workflows and to allow data sharing among a broader audience. Traditionally limited to GIS experts or displayed on static maps, transportation agencies are moving geospatial data to cloud-based formats to adapt to new mobile technologies and an increased general expectation for on-demand and interactive access to information. The cloud offers an opportunity to merge the benefits of mapping with information technology (IT) and supports transportation agencies' drive towards more interdisciplinary practices by serving as a platform for data-sharing and collaboration among different organizations. As society increasingly shares and receives information in a spatial format, the cloud provides a relevant approach for transportation agencies to maintain their role as providers of official geospatial transportation data and information.
Recent Federal initiatives are encouraging the public sector's adoption of the cloud. These include the 2010 U.S. chief information officer's (CIO) “Cloud First” policy, which encourages government agencies to adopt cloud technologies to increase information technology (IT) efficiencies.9 The CIO and NIST also recently published a strategy document, a guide to creating cloud contracts, and a specific cloud “roadmap” to support the adoption of cloud technologies by Federal agencies. These and other initiatives are encouraging use of the cloud as a method to improve efficiencies through sharing computing resources and making information more easily accessible through a single platform.10 The Federal government has also emphasized the importance of data sharing, most notably in the recent Executive Order – Making Open and Machine Readable the New Default for Government Information, which requires the Federal government to “mak[e] information resources easy to find, accessible, and usable.”11
Use of the cloud for geospatial applications is increasing and continues to evolve as the cloud's capabilities and potential benefits become more widely understood.12 In addition to simply storing and sharing geospatial data and business information, cloud computing can support a number of functions that allow users to manage, analyze, and manipulate data, such as through mapping functions. This also provides nontechnical users or organizations, especially those with limited budgets, the capacity to access and manipulate geospatial data.
For the transportation sector, which is traditionally divided into many smaller organizational divisions, cloud computing can help bridge information gaps that exist between agency functions and facilitate collaboration. Cloud-based GIS systems and applications can also compile information from a wider array of sources via the web, encouraging data-sharing among agencies to support the interdisciplinary nature of transportation services. Collaboration through cloud-based applications or systems can increase efficiencies in agency activities by allowing diverse agency divisions to access the same data and eliminate duplicative data collection activities. Access to a wider array of data also enables faster and more effective analysis, leading to better-informed transportation planning and decisionmaking and more coordinated business activities.
Emerging Issues
Cloud-based systems and applications have been slower to develop in the public sector than the private sector. Public sector agencies often have security and privacy concerns about sharing information via the cloud, particularly if external users have access to the information through a public, community, or hybrid deployment model. To help address these concerns, the U.S. CIO established the Federal Risk Authorization Management Program (FedRAMP). FedRAMP is intended to streamline the security assessment process for third-party cloud providers. Once authorized by FedRAMP, providers are added to an approved list that makes procuring third-party cloud services easier for Federal agencies.13 State agencies could potentially use FedRAMP policies as a model.
Procurement policies at many agencies may not be designed to accommodate cloud services, particularly if contracts with cloud service providers are elastic and based on monthly usage of bandwidth instead of the acquisition of hardware. As the industry is relatively new, cloud service providers have not yet developed long-term pricing models. The Western State Contracting Alliance has emerged as a leader by providing a cloud service contract mechanism that State and local public agencies can join to compare vendor pricing and expedite procurement.14
Most of the agencies participating in this research effort are still in the early stages of determining how to most effectively use the cloud in their activities, but even their modest efforts have led to fundamental questions about how transportation agencies will conduct business in the future. For example, as agencies encounter challenges related to data security, procurement policies, and leadership support, they have begun to reconsider the role and purpose of IT systems and security; data storage, maintenance, and collection; as well as how to add value to geospatial data and visualization. As agencies experience successes and lessons learned in these areas, and as technology rapidly advances alongside their progress, agencies believe that cloud computing is destined to greatly influence the way that transportation agencies conduct their business in terms of efficiency, transparency, and cost-effectiveness.
Table 1. Cloud deployment models.
| Model | Consumer | Computing Infrastructure | Data | Public Sector Example | Graphic Description15 |
|---|---|---|---|---|---|
| Private | Single organization (e.g., a State DOT) |
Owned, managed, and/or operated by a single organization or third-party provider. | Data in a private cloud typically remain within the subscriber organization's servers. | Los Alamos National Laboratory developed a private cloud to consolidate its numerous data servers; users access an internal portal to obtain information from these servers.16 |  |
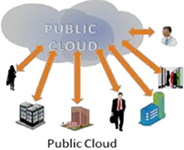
| Public | General public | Owned, managed, and/or operated by a vendor or organization interested in distributing information as a public service. | Typically, a public cloud offers access to a broad range of user types. Data may be stored on the host agency's or third-party servers. Selected users may be able to share their data as well. | GSA developed a public cloud infrastructure for Data.gov, a repository of different datasets generated by the Federal government. Data.gov is accessible to any user from a variety of platforms (e.g., desktops, smartphones) and allows agencies to post their own data directly to the site rather than posting links to where data are hosted on their own servers.17 Case study examples: IPLAN |
 |
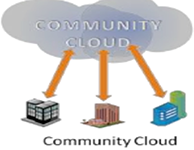
| Community | Specific community of consumers with shared concerns (e.g., policies, mission, goals); may include several different organizations | Owned, managed, and/or operated by a single organization, third-party provider, or a combination of entities. | Data on a community cloud may be configured similar to a private or public cloud, but access to it is limited to authorized users. | The Defense Intelligence Agency and the National Geospatial-Intelligence Agency are developing a common, cloud-based desktop for users in the intelligence community. This desktop will allow any user with access rights to obtain information that previously would have been located behind various agency firewalls.18 Case study examples: WATS' use of Google Docs, Fusion Tables, and Drive; MORPC. |
 |
| Hybrid | Any combination of the above | Applications are owned, managed, and/or operated by a combination or linkage of entities (e.g., a State DOT may own data that are stored on a third-party provider server and shared via the provider's interface). | Data are typically stored on a subscriber's servers, but accessed, viewed, and/or processed through cloud-based applications. Conversely, data may be stored in the cloud while processed using a subscriber or user's server. |
The Department of Energy and the National Nuclear Security Administration developed a hybrid cloud that combines a private cloud and commercial cloud services. The cloud will allow designated users to access common datasets to develop different kinds of applications, tools, and dashboards that serve various user communities.19 |
 |
2. OBSERVATIONS
This section describes overall observations of how the State and regional transportation agencies interviewed are using cloud-based systems to support their GIS activities, as well as the associated benefits, challenges, and lessons learned resulting from these experiences. As most transportation agencies are only just beginning to integrate cloud-based computing into their business processes, the findings below primarily describe recent, self-developed efforts of those interviewed that generally do not rely on outside agency efforts as models.
State of the Practice
Most agencies are in the early stages of using cloud configurations for GIS data-sharing and mapping but are not yet using the cloud for GIS analysis. Approaches to using the cloud are varied and still evolving. Some agencies already support a variety of business processes using cloud-based technologies, while other cloud-based tools are pilots or prototypes. GIS activities supported by the cloud mainly provide data-sharing and mapping capabilities; agencies continue to perform complex GIS analysis processes locally. Overall, none of the interviewed agencies has yet fully incorporated cloud-based applications, mapping, or data sharing into their workflows at the agency- or department-wide levels, though all noted that they intended to expand their use of cloud-based systems to support a wider range of activities. For example, MORPC developed its LBRS file in response to the State of Ohio's need for up-to-date road data from its localities for emergency response systems. However, it plans to add other data, such as bicycle paths and sidewalks, to make the file useful for other activities.
Agencies are using a variety of deployment models. A common thread among most agencies is their use of hybrid cloud configurations, which allows the agency to control access to data stored on agency servers, often for security purposes. For example, MDSHA wanted an easy method to connect dig requests with data on nearby utilities without moving utility data onto their software provider's servers, so it developed a hybrid configuration that linked the third-party, cloud-based MUTTS application to MDSHA's servers. Table 2 provides details on the configurations and deployment models used by each agency interviewed:
Table 2. Configuration and deployment models used by interviewed agencies.
| Agency/Application | Deployment Model | Software development | Service Model | Data storage | Data maintenance |
|---|---|---|---|---|---|
| MORPC: LBRS files |
Community | Off the shelf | Packaged software | On agency server | Agency, partner agencies |
| UDOT: UPlan |
Hybrid | Customized off-the-shelf | SaaS | On agency server & third-party server | Agency, partner agencies |
| ITD: IPLAN |
Hybrid | Off-the-shelf | SaaS | On agency & partner agency servers | Agency, partner agencies |
| WATS: Google Docs, Google Fusion, and Mi Community Remarks |
Hybrid | Off-the-shelf | SaaS | On third-party servers | Agency |
| MDSHA: MUTTS, truck routing application, MD iMap Templates, MDTA enterprise GIS system |
Hybrid | Custom and customized off-the-shelf | SaaS/SaaS (self-developed)/SaaS/PaaS | On agency server & on third-party servers | Agency |
Cloud technologies are being used at the interviewed transportation agencies in response to a need for more integrated and accessible GIS data. As the use of geospatial applications and data has expanded over the past few decades, agencies have begun to address the proliferation of disconnected, large, and often redundant datasets. At the same time, as the use of mobile technology increases, transportation agencies are responding to a general expectation for more open, accessible, and interactive data that have been cultivated by the Internet. Furthermore, the use of the cloud reflects transportation agencies' increasingly interdisciplinary activities, such as in asset management and environmental streamlining. For example, information and data once siloed in individual departments is now needed in a centralized format to respond to the asset management reporting requirements of MAP-21. Agencies view the cloud as a way to gain a better understanding of the full scope of their assets and business activities to reduce redundancies and make more efficient and informed decisions.
Off-the-shelf or third-party platforms are preferred over developing custom code for cloud applications. In particular, most agencies are using or have considered using Esri's cloud-based GIS SaaS, called ArcGIS Online,20 in part because of many agencies' existing licenses with Esri. Some agencies have attempted to custom-code their own cloud applications but noted the large time investment needed. For example, UDOT initially wrote its own code for its UPlan application before switching to a customized version of ArcGIS Online due to the staff time required to maintain the code and interface. Based on UDOT experiences, ITD opted to use ArcGIS Online rather than develop custom code for its cloud application, IPLAN.
Cloud-based technologies are accompanied by data standardization and quality control efforts. Agencies that have moved data to the cloud or use cloud-based applications need some level of format and quality standardization in order to display disparate datasets in a web viewer or to make the data compatible for integration into larger datasets. For some agencies, such as MORPC, a cloud-based solution was the outcome of an initial goal to consolidate and centralize data into a common location and format to reduce redundancies and allow locally collected data to be viewed across jurisdictional boundaries. Other agencies are finding that as data are published to the cloud, data stewards are motivated to improve the quality of the data on their own. For that reason, some agencies, such as UDOT, are letting data stewards assume responsibility for quality based on their own needs.
The functionality and design of cloud-based applications influence data standardization and quality control efforts. For example, data quality and standardization may be important at the statewide level to prevent inaccurate data from being incorporated into other agency datasets and analyses. In response, some agencies, such as MDSHA, have initiated proactive data inventory and assessment efforts in order to eliminate redundant datasets and prioritize data as it is fed into its cloud-based system.
Benefits
Overall, the transportation agencies interviewed believed that their cloud-based applications provided significant and sometimes unexpected benefits to their GIS activities, business operations, and partnerships. Although they have not yet developed quantitative performance measures and assessed the effectiveness of their applications, the benefits of using cloud-based solutions are demonstrated by the interviewed agencies' desires to expand their cloud-based tools and datasets in future years.
The cloud increases the user base and impact of spatial data. GIS can produce powerful results by juxtaposing information that previously was only available in an isolated or nongeographic format (such as public comments). However, until recently, the software and expertise needed to process GIS data was primarily limited to GIS specialists. Cloud-based GIS applications such as UPlan, IPLAN, and WATS' Mi Community Remarks enable those without GIS software or GIS expertise to view and manipulate spatially formatted data in more user-friendly, interactive, and intuitive environments. In addition, this information becomes available to the user instantaneously.
Time and costs associated with managing and displaying GIS data are reduced. Cloud services offer agencies the opportunity to store a large amount of information in one place that otherwise must be stored and maintained in a variety of locations on an agency's servers. Cloud services also enable users to access information stored in several locations through a single portal. Using a cloud configuration to store geospatial data can “free up” space on an agency's servers and eliminate the need for individual users to maintain and store their own version of a data file or software, consolidating resources and making data easier to find. Some noted, however, that storing data on a cloud server can be expensive if the service package charges by the amount of bandwidth used for uploads and downloads.
Both UPlan and IPLAN, for example, were developed to harness the benefits of visualizing data in a spatial format while reducing time spent on managing and processing data. This is accomplished through an application design that links to but does not store data. Even if the cloud application is not used for data storage, time and cost savings are nonetheless realized. The application eliminates the need to search for and combine datasets for regular business activities as all data can be accessed from one interface. Agencies also noted that time savings are realized by IT staff not having to manage disaster recovery systems and software updates for third-party software and platforms, which is especially advantageous for smaller agencies with more limited budgets and IT capacity.
Cloud-based systems foster and strengthen multi-agency collaboration and partnerships. The agencies that currently use cloud systems reported that information sharing is easier, faster, and more effective, and that they have benefited from learning of and using data that other agencies collect and maintain. As an example, Ohio DOT notes that many counties hired a vendor to manage LBRS data through third-party cloud-based services. In collaborating with their municipal and local agency partners to establish LBRS data submittal processes, these counties discovered redundant data collection among jurisdictions or were made aware of useful data maintained by another agencies or departments. Sharing this information effectively reduces the “silo” effect between and within agencies and streamlines data collection and maintenance activities.
As new data from various sources become available in a centralized repository, there will be new opportunities for data analysis. For example, UDOT, ITD, and MORPC all anticipate that their cloud-based applications will lead to more regional cooperation among jurisdictions based on the availability of regional-scale data that will be accessible through the cloud. Agencies also noted that users have increased confidence in the quality of GIS data since a cloud-based system can reflect updates and changes coming from different locations and users in real-time. This is especially important as NextGen-9-1-121 routing systems use GIS and will depend upon up-to-date road network data and address information.
Cloud-based applications can improve agencies' interaction with the public. Cloud-based applications provide an online, easy-to-use forum for exchanging spatial information with the public. For example, WATS reported that it received 99 comments on its long-range transportation plan, much higher than in past iterations, and received informed comments from transportation professionals who may otherwise have been too busy to attend public meetings. Transportation agencies see the cloud as a way to present the interdisciplinary nature of their transportation activities and to place them in the context of a larger government service. Additionally, as third-party, crowd-sourced applications emerge due to a demand for geospatial infrastructural data,22 the cloud offers transportation agencies the opportunity to control how their assets and business activities are presented by providing “official” data.
Challenges
Since cloud computing is relatively new, most agencies noted several challenges associated with developing and implementing cloud-based applications. Challenges outlined include:
Security concerns can slow or limit cloud deployment. Agencies expressed concerns about maintaining security for data published on the cloud, and experienced challenges in convincing partners to share data on systems where users could access and possibly misinterpret or misuse data. GIS and IT professionals in transportation agencies are also beginning to discuss how much security is necessary for their various datasets as their cloud-based systems and applications are developed. In some cases, GIS or transportation practitioners turned to the cloud due to IT security complications involved in building an application or publishing data behind the agency firewall.
Overall, agencies view IT policies and processes as a potential hurdle to meeting their customer's needs. While GIS practitioners generally believe that often the benefits to sharing information outweigh the risks to releasing it, in many cases IT policies have evolved to focus on securing rather than providing information. Agencies view this as a challenge to remaining nimble and responsive in meeting customer needs when deploying cloud-based applications and data.
Cloud-based services present unfamiliar, and in many cases untested, cost models. Many cloud-based services, particularly those provided by third parties, are based on a “pay-as-you-go” model, which charges for services (such as bandwidth and data storage) as they are used. Agencies therefore find it difficult to meet procurement policy requirements that call for cost-benefit analysis, as estimating future usage levels of cloud services is difficult.
Private providers of GIS-cloud applications are also still piloting various cost models for their services, contributing to the unpredictability of future cost estimates. Agencies had difficulty justifying cloud computing services that by nature are ephemeral and do not conform to traditional cost models based on the longevity of infrastructure or ownership. Cost-benefit analysis models of different cloud scenarios and the assurance of cost stability are needed to assist agencies in demonstrating the value of cloud technologies to their agency.
The level of expectation for data accuracy and quality of cloud-based data is evolving. When data are published to the cloud, agencies noted that data stewards often took care to improve the data's quality. Yet agencies are also finding they need to determine the level of accuracy, quantity, and detail acceptable for cloud-based activities and whether data quality standards must match those held for paper documents. Several reasons exist for these concerns. First, because increased detail in data may increase storage and bandwidth needs, the costs associated with providing cloud services may increase (this concern may be mitigated by the trend towards increasingly inexpensive storage space). Very detailed data may also attract additional security issues that could lead to more limited accessibility, or result in misinterpretation. However, agencies must also maintain certain data standards if they are to be used in the transportation decisionmaking processes. For that reason, agencies developed standards for data to be published on the cloud while leaving enough flexibility in formats so that the data can be used for multiple purposes. For example, UDOT screens uploaded data to meet minimum standards, even though the data are maintained and actually stored on user servers. For other agencies, such as MORPC, the format of the LBRS files creates a standard that the participating jurisdictions must adhere to in order to contribute their data. These efforts are intended to ensure that data is displayed in the manner intended by the data owner to the appropriate audience.
As use of the cloud increases, agencies are mindful that there must be some level of organization and process development behind the scenes in order to prevent various groups from adding redundant datasets. For instance, MDSHA is currently developing a template for MD iMAP partner agencies to outline their data collection and maintenance schedules to inform new applications as they are developed. Identifying and preventing redundant data, as well as making sure data is easily searchable and generally accessible, are also important for minimizing costs if data are stored on third-party servers.
The dynamic nature of the cloud requires new strategies for recordkeeping. The cloud enables users to update geospatial data in a centralized location in real time. While this provides benefits in terms of access to up-to-date data, it presents challenges in regard to maintaining a historical record. In the event that an agency needs to document its decision to justify or explain a certain outcome, data used from cloud-based systems or applications may have since been updated. Agencies have responded to this in various ways. One approach is to “version” the database from which the cloud-based application draws data by storing only changes to the dataset. This works for scenarios where the agency has direct control over all data used within its cloud-based system or application. For scenarios where users maintain data, agencies may have to rely on data owners to record the version and methodology of data that were used on a particular date. But agencies acknowledge that there is a risk in depending on other entities to maintain records.
Lessons Learned
The interviewed transportation agencies offered the following lessons learned based on their experiences developing cloud-based applications so far:
Remain flexible to adapt to new, unanticipated responsibilities. The ultimate goal of adopting cloud computing is to increase efficiency, but agencies note that doing so can create unexpected responsibilities that might add to or change the nature of staff workload. For example, MORPC found that it had to spend significant time cleaning up initially submitted LBRS data in order to maintain the stability of their LBRS files. MORPC chose not to shift this responsibility to partners in order to encourage participation and buy-in, and the quality of submitted data is improving as users gain experience.
As new uses for publishing data in cloud scenarios are identified, transportation agencies may also find that they spend additional time updating existing or in developing new applications to achieve new efficiencies. After establishing its dig request workflow using MUTTS, for instance, MDSHA is adding a new function that will link construction permits with dig requests. Agencies tended to see the time investments associated with cloud technologies as “time well spent,” and recommended incorporating cloud computing into business processes incrementally in order to remain flexible and able to adjust to new demands. ITD expects that the increased use of IPLAN will also result in increased requests of its GIS staff for GIS analysis, which it views as a positive use of its GIS resources for future problem solving.
Seek input from partners in designing and developing cloud-based tools and systems. Interviewed agencies found that designing their applications and data structures with significant input from internal and external partners helped focus the technology and identify the data they needed to include. Often these partners will be the owners of key data or will be relied upon to maintain the GIS data once the cloud-based system or application is available. Gathering input and creating ownership responsibilities ensures cooperation from partners and also serves to shape the cloud-based tool or system to satisfy the needs and requirements of multiple entities. For example, while MORPC is the primary developer of their LBRS files, it meets monthly with an advisory committee comprised of participating jurisdictions to discuss next steps and to obtain feedback. Agencies recommend including IT representatives in cloud governance bodies but to be mindful of balancing security concerns with an understanding of customer needs. In addition, legacy issues attached to existing data must be considered, and partners must recognize that it may be unrealistic for some agencies to easily modify their data systems and processes to accept and contribute data from the cloud rather than their local servers as originally designed.
Demonstrate benefits to gain support. Some agencies indicated having encountered skepticism or resistance to incorporating cloud computing into existing workflows. This may be due to the disruption of familiar work processes or the perception of additional responsibilities associated with the cloud. Agencies stressed the importance of demonstrating the cloud system or application to both leadership and staff. Proponents should articulate the value the cloud adds to traditional GIS. ITD met with each Idaho Transportation Board (ITB) member, for instance, to describe the purpose of IPlan and also to take the opportunity to listen to what board members hoped to achieve through increased geospatial collaboration.
Regardless, users may still need to pilot the cloud in their regular activities before committing to its long-term use. Cloud-based systems and applications should also be designed for intuitive use, as not all users are familiar with GIS or cloud computing. For example, MORPC did not pursue agreements with its partner agencies—many of which did not have high-level GIS capacity or resources—because it felt the LBRS system would receive more buy-in from users experiencing the tool and its benefits first.
Use the cloud to facilitate and coordinate business interests. Agencies view cloud computing as a collaborative tool among users that may not otherwise have a means to coordinate. Once established, the cloud-based tool or application should reflect and engage the business interests and contribute to the vision of the organization, as well as incorporate user needs, especially as data are added. Agencies regard this process as an opportunity to learn not only what customers find important, but also to help focus the activities and business processes of the organization. For example, after data stewards uploaded data into IPLAN, ITD discussed the purpose of the data with the users. This helped create a better understanding of users' needs and helped users understand the purpose of IPLAN. Such discussions should also occur at the management level to understand program- and department-level needs. This interaction can also help prevent the cloud from becoming too unfocused or cluttered with questionable or redundant data.
Identify risks and develop contingency plans and mitigation strategies to avoid negatively impacting partners. In order to reduce the perception that the cloud will add new, time-consuming responsibilities, agencies recommend developing workarounds and contingency plans. For example, ODOT has developed automated methods to correct common data discrepancies in files submitted to its statewide LRS dataset instead of asking jurisdictions to reformat their data.
Consider the implications of using third-party cloud platforms or data repositories. Third-party cloud-based platforms and software are by nature not under the control of users or the subscriber. Several agencies noted that third-party systems should not be relied on as the sole repository of an agency or program's data and information due to the risk of server failures. For example, in assessing its experience with Mi Community Remarks, WATS identified a need to back up the public comment data it received in case its Google application became unavailable. While agencies felt that third-party cloud vendors have an equal or larger incentive to maintain security as their agency IT departments, they are also aware of the risk of substantial business disruption if a cloud service malfunctions, leaving agency IT staff unable to assist. Some partners may also be wary of sharing information and data on a third-party site for this reason.
Third-party cloud applications also carry different cost implications. Due to outsourcing infrastructure and maintenance costs, third-party cloud scenarios may create the perception of reduced costs among users. Agencies cautioned that any data storage on third-party servers should be strategic, as pricing is often based on file size and bandwidth used during data transfers and geospatial files can be large in size. Hybrid cloud configurations, such as UPlan and IPLAN, were often chosen in part for this reason.
Potential Opportunities for the Cloud in GIS Activities
Agencies noted several areas in which they may consider expanding or refining uses of the cloud.
Cost-benefit analyses of cloud applications may be developed as efforts expand. Most agencies have not yet quantitatively evaluated the uses and effectiveness of cloud platforms and applications, although many have anecdotal or qualitative evidence that indicate the benefits of these tools. The development of quantitative measures and metrics to better assess the cost of cloud technologies might be an area of focus on the part of both agencies and vendors.
Cloud applications can provide powerful opportunities for feedback loops. Agencies noted the potential for cloud applications to become locations where agencies can respond to comments, information, and data that users provide through the cloud. For example, WATS envisioned a mechanism where it could follow up on comments received during its long-range planning process and inform participants how their comments were considered and incorporated into their decision making.
The cloud may influence the reconsideration of data classification and maintenance. Some transportation agencies noted that as data used in the cloud is applied to more uses than it was formerly, data may be re-organized and maintained in terms of how they are used rather than their functional or ownership classification. For example, dirt roads are not currently included in most State linear referencing systems, but emergency responders still need to know where these roads are located. If 911 systems continue to increasingly rely on geospatial data to route calls, the cloud could render this type of data hierarchy obsolete and authority over dirt road location data could shift to more relevant data stewards. In this way, the cloud could relieve transportation agencies of some data maintenance responsibilities, freeing them to focus on other activities.
Potential Areas of FHWA Support
Agencies noted potential areas where FHWA activities could support further advancement of cloud-based geospatial activities, including:
Further develop the national goals related to data sharing. Through documents, standards, best practices, and national guidance, FHWA could assist agencies in pursuing cloud-based technologies by articulating the national importance of linking data from multiple agencies and jurisdictions. For example, cloud-based data sharing of local data could be linked to national initiatives that promote environmental streamlining and ecosystem-scale planning and analysis.
Develop a national model for cloud-based GIS activities. A national-scale cloud-based application that linked multiple Federal agencies could serve as a model to demonstrate the benefits of interagency collaboration and data-sharing to states.
3. CASE STUDIES
This section presents in-depth case studies on the current activities of the State DOTs and regional transportation agencies that participated in the report interviews and the peer exchange. Each case study includes information on how the agency began using cloud technology to support their geospatial applications, how they developed or are planning on developing these applications, and the challenges, lessons learned, and benefits encountered during the process.
Idaho Transportation Department
Overview
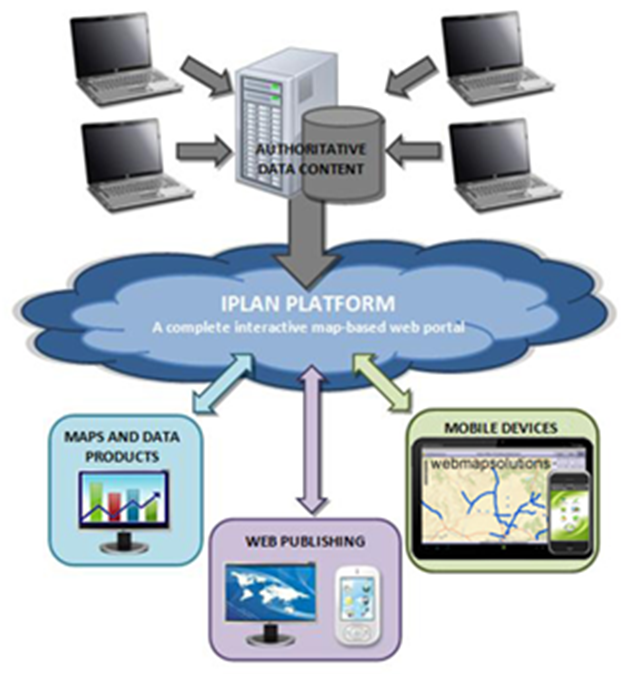
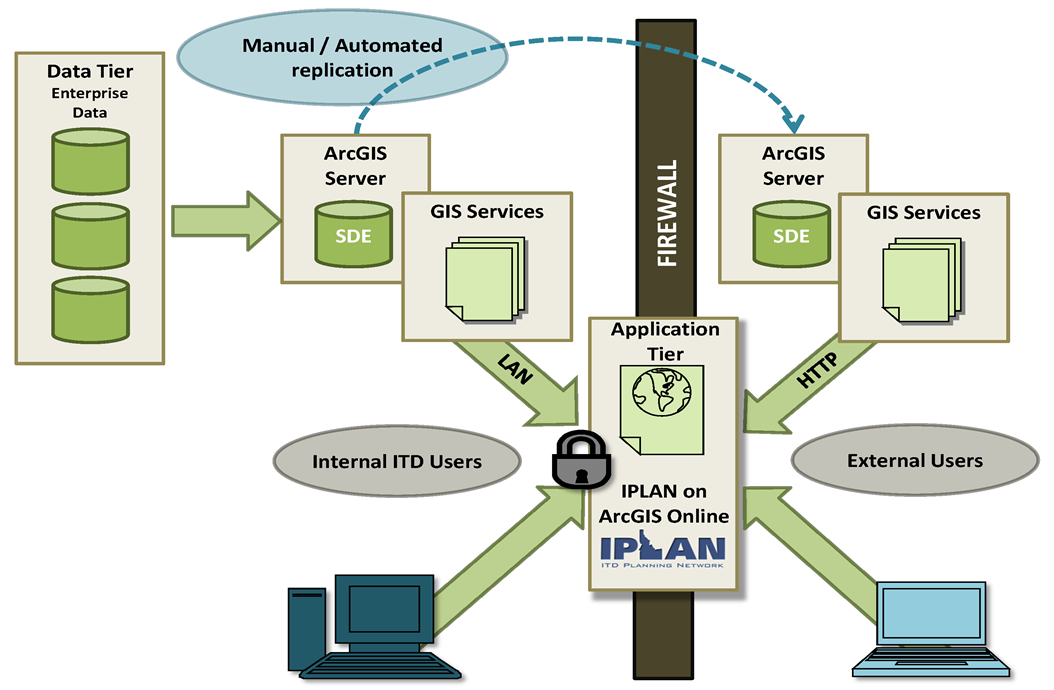
IPLAN is a cloud-based, collaborative tool under development by the Idaho Transportation Department (ITD) that will enable staff, partnering agencies, and the public to visualize GIS datasets via a user-friendly web browser. IPLAN's primary purpose is to improve collaboration, efficiency, transparency, and accountability among ITD's six districts, among ITD and partner agencies, and between ITD and the public through improved data sharing. ITD anticipates that IPLAN will enhance the planning process by allowing users to share critical data, and will be a tool for communicating ITD's progress on MAP-21 goals as well as providing tools for transportation scenario planning by layering system performance measures, long-term system vision, and financial forecasts. IPLAN will also support the streamlining goals of FHWA's Every Day Counts (EDC) initiative.
Figure 2. IPLAN platform design.
ITD was first introduced to the potential benefits of a web-based, data-sharing platform through a GIS consultant aware of a similar initiative. At the time, the Utah Department of Transportation (UDOT) was developing its UPLAN tool. ITD learned of the benefits of UPLAN and decided that ITD might benefit from a similar data-sharing tool. In 2012, UDOT began to help ITD adapt a version of UPLAN for Idaho using ArcGIS Online. ITD is now a member of the American Association of State Highway and Transportation Officials (AASHTO) Technology Implementation Group (TIG), which UDOT created to help States explore how to best build and use cloud-based, collaborative geospatial tools, with a focus on UPlan. The UPlan TIG includes 11 other States in addition to Utah and Idaho.
IPLAN Development
After conducting an Enterprise Architecture Assessment,23 ITD determined that Esri's ArcGIS Online, a cloud-based, off-the-shelf, Software as a Service (SaaS) package, would be the most effective way to develop IPLAN due to ITD resource constraints and a desire to adopt a usable system relatively quickly. Esri's ArcGIS.com will function as a web portal for users to retrieve, visually display, and analyze geospatial data from within ITD. IPLAN's data and GIS services will be stored on ITD and other agencies' servers (see Figure 2). By giving Esri the responsibility for software maintenance, ITD expects to incur less risk since the need for custom software development and future maintenance requirements is eliminated.
To date, ITD has developed an IPLAN pilot website that provides a test case for ITD to explore, discuss, and refine the tool. ITD has also assessed the agency's GIS needs and goals, developed a project charter and business case for IPLAN, and received approval from the Idaho Transportation Board (ITB)24 to continue developing the application. ITD recently finalized the development of IPLAN's system architecture, which included determining how to tie IPLAN into ITD's internal GIS network. ITD's districts are currently using ArcGIS Online to edit, share, and finalize data for their own use. IPLAN is leveraging ITD's GIS server capabilities to host and publish map services, which do not consume credits. Unless specifically configured to do so, data that are served from ITD cannot be edited through IPLAN.
The next step is to develop and configure the IPLAN tool as well as to establish a long-range vision to identify next steps for enhancing IPLAN's capabilities. ITD has not yet determined a detailed scope and contract cost for later phases but ultimately anticipates that ITD will create more focused maps, demonstrate how IPLAN fits into everyday business solutions, and use it as a tool to communicate Moving Ahead for Progress in the 21st Century (MAP-21) goals for ITD.
Intended Users
ITD anticipates that IPLAN will serve three types of stakeholders: ITD internal staff, partnering agencies, and the public.
The tool's primary internal users will be ITD environmental and transportation planners from ITD's six districts. These staff will use the tool to support environmental planning and project streamlining. Other ITD staff, such as design and construction sections, will take advantage of the existing State enterprise airport, pavement, traffic, and safety data to be displayed by IPLAN. Overall, IPLAN will assist staff at all levels of ITD, from technicians to ITB members, to make data-driven decisions.
ITD anticipates that a number of partner agencies will also share and use data on IPLAN. These partners may include State agencies, Federal resource agencies, and local community planners. For example, resource agencies may share data on endangered species, historic preservation, and wildlife migration. By encouraging partner agencies to share information via IPLAN, ITD anticipates making better transportation investment decisions and streamlining transportation planning activities. ITD has started gathering feedback from a variety of stakeholders, including internal ITD staff, Idaho Department of Fish and Game, Idaho Bureau of Homeland Security, Idaho State Emergency Medical Services Communications Center, FHWA Idaho Division, on the data they would like IPLAN to display.
ITD also foresees that IPLAN will provide the general public an opportunity to more easily access information about transportation projects and assets as part of ITD's larger goal to increase overall agency transparency. In the future, ITD may use IPLAN to gather and display public comments on transportation projects during the yearly Idaho Transportation Improvement Program (ITIP) programming cycle, thus enhancing the public involvement process.
Data Collection and Maintenance
ITD does not plan to collect, store, or maintain data included in IPLAN except for those data ITD already manages. IPLAN will automatically draw these data from ITD's GIS databases. Individual data owners, both internal and external, will be responsible for the compilation and maintenance of other data. ITD intends to sign Memoranda of Agreement with stakeholders to ensure that the information provided is updated regularly. Some agencies, such as Idaho Department of Fish and Game, currently have their own data-mining applications, to which IPLAN may directly link. Smaller agencies with limited GIS resources may be able to work with the Idaho Geospatial Office to spatially enable and store their data, and IPLAN could then link to this information.
ITD is also addressing security concerns regarding sensitive data and its availability to the public. Only those using ITD's internal network or with credentials using the Internet will be able to access sensitive data using IPLAN. For example, certain data, such as historical artifact locations, will be restricted and stored behind ITD's firewalls. Data will also be replicated on a GIS server in a secure area25 outside the firewall, allowing only those with a username/password to access the data from an external network (see Figure 3 for a simplified diagram of ITD's security configuration).
IPLAN will potentially display certain datasets to the public more generically than is displayed internally. For example, ITD's bridge department is concerned that the public may misinterpret the current display of bridge data as evidence of a safety risk, when in fact it is just the manner in which bridge engineers record information. Instead of using the National Bridge Inspection Standards (NBIS) condition ratings of “Not Deficient/Structurally Deficient,” IPLAN could convey this message using a green/red color coding system or ranking the bridges as healthy/not healthy.
Figure 3. ITD's security configuration for IPLAN.
Lessons Learned
ITD reported the following lessons learned in its experiences using cloud-based technologies:
- Leverage existing resources and partnerships. One important driver of success for ITD is the close working relationship it developed with UDOT in order to understand the elements of UPLAN. Using UPLAN as a model has allowed ITD to showcase the potential of IPLAN to agency leadership and provides a conceptual framework that ITD can tailor to its own needs. The AASHTO TIG has also been an important resource in supporting collaboration and communication between agencies with similar goals. In addition, ITD is taking advantage of Esri's preexisting ArcGIS Online platform, which allows ITD to achieve results on a quicker time schedule than performing the work in house. ITD's collaboration with Esri has significantly decreased the perceived risk and cost of adopting a new technology, encouraging leadership support at ITD.
- Work to ensure agency leadership buy-in. Agencies must take into account concerns and resistance related to the implementation of new technologies. For example, Enterprise Technology Services (ETS) staff at ITD initially expressed concerns regarding data security and the reliability of using cloud technology. Collaboration and management support has been key to addressing such concerns. ITD demonstrated IPLAN's potential value by presenting the application's return on investment and potential for serving interdepartmental and interagency needs to each individual member of the ITB. After receiving the ITB's approval, IPLAN developers noticed a significant shift in opinion and were able to have more productive conversations with concerned stakeholders.
Anticipated Benefits
ITD anticipates IPLAN will provide a number of benefits to the agency itself, partner agencies, and the public, including the following:
- Enhance data distribution and sharing capabilities. ITD currently considers itself “data rich” but “distribution poor,” as much of ITD's data are stored in various locations and are not easily accessible or searchable. Furthermore, much of the data are in a tabular or spreadsheet format. IPLAN will allow users to spatially display this information and make data more accessible to a broader audience. As searching IPLAN becomes the preferred method of finding data for a project, ITD anticipates partner agencies will be encouraged to further share up-to-date data via the site. Eventually, full cross-agency use of IPLAN will likely save ITD time.
- Enable creativity and improve analysis. ITD predicts that IPLAN will help users share and layer information in formats that allow them to look at issues in new and innovative ways. For example, IPLAN can improve how ITD's Idaho Transportation Improvement Program (ITIP) is displayed. Currently, the ITIP is only available in Adobe Portable Document Format (PDF), which makes searching for and understanding information difficult. IPLAN will also allow ITD to be more aware of potential environmental impacts from the start of a project, leading to more strategic and efficient project design and development.
- Lead to cost- and time-savings. ITD has conducted several assessments to determine the cost-savings that could be realized from the use of IPLAN. Based on these calculations, ITD predicts significant savings derived from more streamlined environmental review processes. For example, ITD believes the use of IPLAN will reduce the cost to complete environmental documents by approximately $350,000 per year by streamlining the data compilation process. Overall, the tool will make it easier to gather data and allow data sharing to become part of everyday business processes. As a result, staff will be able to more easily and efficiently address questions when they are posed, reducing the time needed for decisionmaking. In 2012, ITD estimated that the use of IPLAN could have saved ITD $2 million in the implementation of Idaho's Transportation Investment Program over the previous 5 years (see Appendix E for more information on estimated cost savings).
- Provide a degree of implementation and cost flexibility not previously possible. In some cases, it can be difficult for State DOTs to quickly adopt traditional IT technologies because of challenges in finding the resources necessary to build and maintain their own hardware (e.g., additional servers) and software. ITD believes State DOTs can overcome these challenges by using cloud-based technology (in particular an “out of the box” SaaS that comes with flexible data storage capacity) to implement new applications more quickly. Third-party systems typically require less upfront and maintenance staff time and costs, since a third party manages the software and the agency pays for only the features and server space used.
Next Steps
In the future, ITD envisions using IPLAN as a platform for providing datasets required by Federal legislation. For example, ITD envisions the ability to use IPLAN to generate data and reports required by MAP-21. This functionality will be developed during a later stage of development.
ITD has recently encountered challenges in developing IPLAN because of staff transitions, but is working with a contractor to assist with development of the application. ITD aims to fully deploy IPLAN in fall 2013.
Maryland Department of Transportation
Overview
The Maryland Department of Transportation (MDOT) contains multiple transportation business units (TBUs), including the Maryland State Highway Administration (MDSHA) and the Maryland Transportation Authority (MDTA), which are responsible for maintaining Maryland's roads and Interstate highways. Some of MDOT's business units are currently piloting the use of cloud-based platforms, software, and applications to support various business activities.
This case study examines four cloud-based initiatives at MDSHA and MDTA. The first is a hybrid cloud-based application called Miss Utility Tracking System (MUTTS), which coordinates and tracks responses to requests that construction workers and excavators make to dig holes. MDSHA would like this application to serve as a template for other cloud-based initiatives. The second is a collection of interactive mobile applications that are designed for specific segments of the traveling public, including truck drivers, cyclists, and highway motorists. The applications are also representative of a hybrid cloud configuration.
Third, several of MDSHA's and MDTA's staff members are involved in improving the configuration of MD iMap as part of an interagency technical committee, which is comprised of representatives from MDSHA, the Maryland Transportation Authority (MDTA), MDOT, and other State agencies. Launched in 2009, MD iMap26 is a statewide data and mapping portal that compiles data from various agencies across the State of Maryland. MDSHA is a funding partner for MD iMap. The technical committee's effort includes building templates for web-based applications using Esri's ArcGIS Online, which is a third-party SaaS program.
Finally, MDTA deployed an enterprise GIS system in 2009. This business unit-wide system is currently configured as a private cloud that only MDTA and MDOT staff members can access. The system blends functionality from Esri and Google Earth27, and its data and applications are stored entirely within MDOT's firewall.
Miss Utility Tracking System
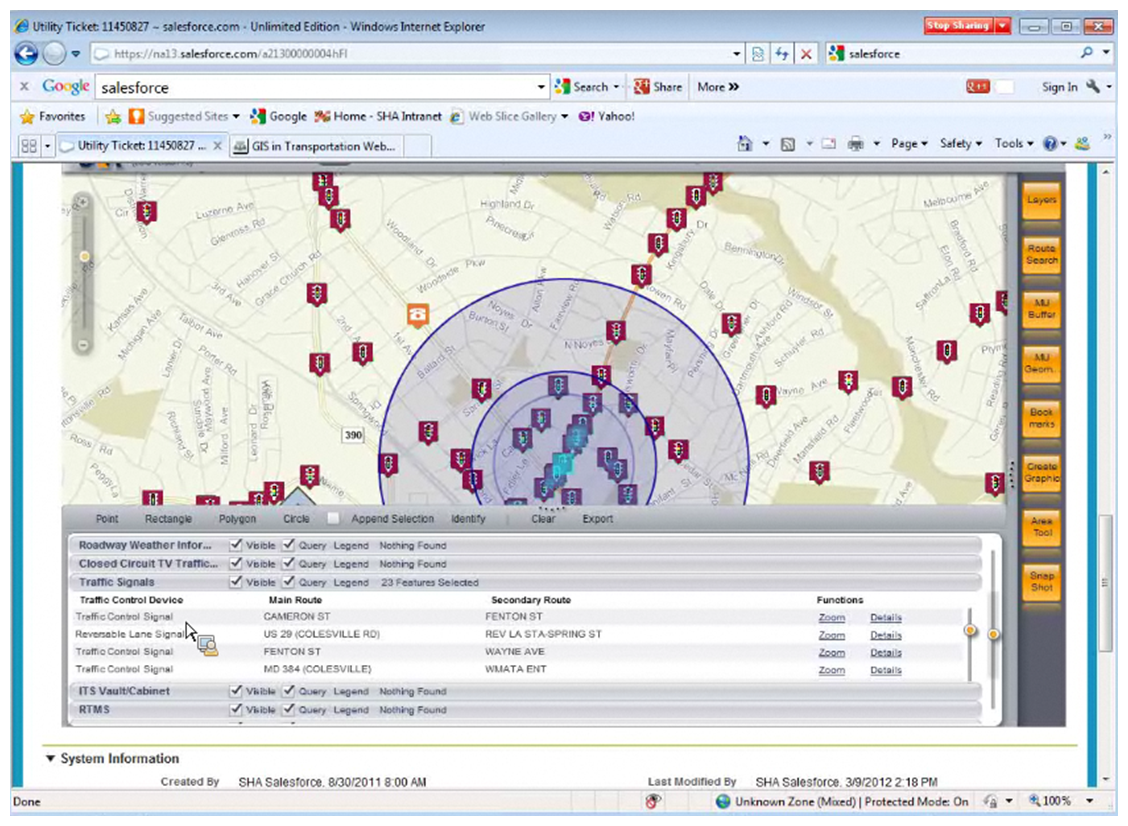
Maryland utilizes MUTTS,28 a notification center that informs construction workers and excavators of underground utilities before digging. The notification system is a web-based application; when an excavator submits a dig request via MUTTS, MDSHA receives an automated ticket. To connect MUTTS with MDSHA's utility data, MDSHA's Office of Information Technology developed a cloud-based interface using Salesforce cloud-based software.29 MUTTS therefore represents a hybrid PaaS cloud configuration, as the web interface is located on Salesforce's servers but also links to MDSHA's eGIS (MDSHA's enterprise GIS system) and databases to create a utility location viewer (see Figure 4). MDSHA staff members use the viewer to locate dig requests on a map that shows other nearby utilities.
When requests to dig within MDSHA rights-of-way are entered into MUTTS, the web application populates a database stored on the Salesforce server with the dig request. The request appears as a link to the MDSHA staff member using the web application.
The dig request link is tied to the address for which the dig permit was submitted, allowing it to be geocoded and mapped within MDSHA's eGIS. An MDSHA staff member may then view the request to see the dig location relative to other nearby utilities within a certain buffer on the eGIS map. The staff person reviewing the request can then notify an excavator of the existence of utilities. MUTTS tracks the entire process, from initial request to closeout, to guide and improve response times.
Figure 4: The MUTTS application and utility location viewer in eGIS.
Mobile Applications
MDSHA is developing several mobile applications to provide information to certain segments of the traveling public. A prototype SaaS truck routing application notifies truckers passing through the State about emergency detours and parking information. The application uses HTML530 and JavaScript31 to make it “device agnostic,” which allows the application to automatically scale to the screen size of various mobile devices as well as desktops or other platforms. Development of this application provided MDSHA an opportunity to test a hybrid cloud configuration, and its success has led to the development of similar applications. The application pushes data outside of MDSHA's firewall for mapping purposes using Esri ArcGIS Server.
MDSHA is currently exploring ways to use automatic vehicle location (AVL) system data, which transmits the location of vehicles, for the truck routing application. Most trucks are outfitted with AVL technology, and these data could be collected through the application and used to provide more geographically tailored information to the users of the application. Data could also be integrated into other datasets within MD iMAP's cloud-based environment and with the University of Maryland's Regional Integrated Transportation Information System (RITIS)32 to aid in congestion monitoring.
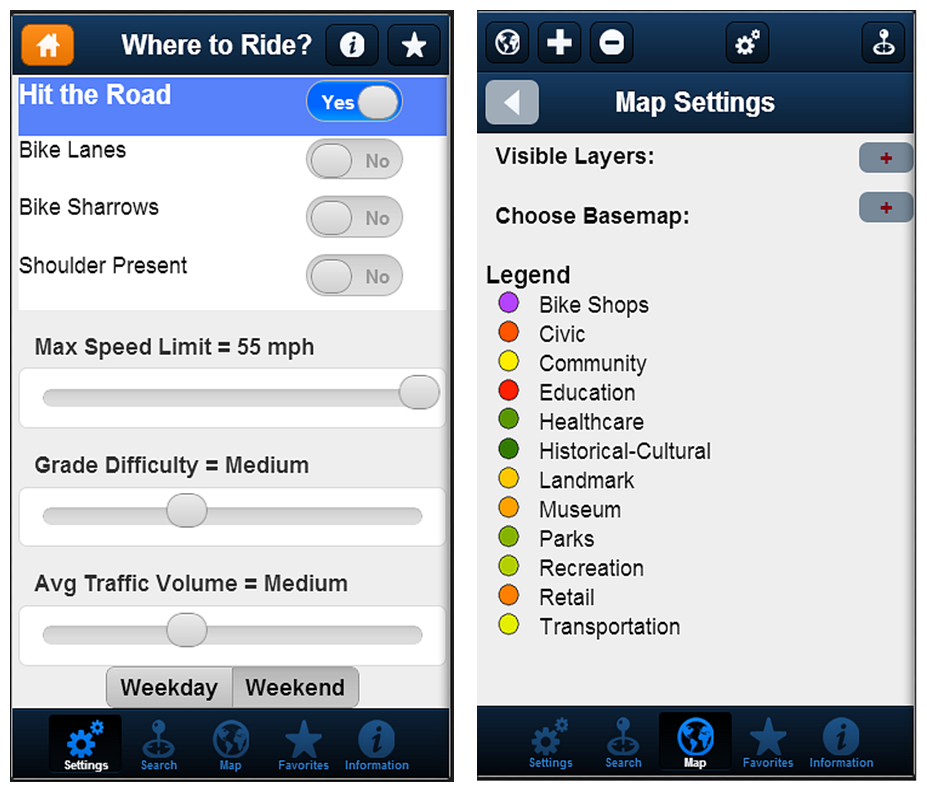
MDSHA is also developing an application for cyclists called “Cycle MD.” The application is configured similarly to the truck routing application, and users to the safest bicycling routes based on their current locations and conditions. The application relies on data collected from two counties by MDSHA's Office of Highway Design that was used to develop metrics for cycling comfort. The application is designed to visualize those metrics and serve as a decision support system to direct cyclists to safe routes (based on traffic, shoulder location, etc.) (see Figure 5). Users can inform MDSHA about cycling-related facilities and infrastructure, such as bicycle shops. Finally, a Points of Interest application will let users view information available on the Maryland Official Highway Map33 in a geospatial format.
Figure 5. Cycle MD mobile application showing how users can choose bicycle routes based on different conditions.
MD iMap Application Templates
MD iMap, a statewide data and mapping portal, is configured as a hybrid cloud. While data remain on servers from various MDOT business units, applications that display the data reside within ArcGIS Online. Existing applications within the iMap portal vary widely in terms of design, format, and function, and at times users have had difficulty consuming data displayed in inconsistent formats. Additionally, many of the applications currently hosted on MD iMap were built using an Arc GIS API for Flex34 configuration, which is not always entirely compatible with mobile devices. Many of the MD iMap technical committee members believe that having a more standardized appearance and functionality for MD iMap's applications would help meet users' needs and that a cloud-based configuration would better respond to the growing market of mobile devices. For that reason, members of the technical committee are working to develop cloud-based templates for all applications on MD iMap that are accessible in the public domain. The committee is planning to use DoJo,35 open-source code, to build these templates, which will provide the format for the geospatial data accessed by public users through the ArcGIS Online-hosted interface. The templates will serve as standard interface formats for users to access, manipulate, and share MD iMap information (see Figure 6 for a diagram of the cloud configuration for the templates and Figure 7 for an example of a template).
The server that currently supports MD iMap can accommodate increased web traffic during emergency events such as hurricanes. Maintaining this hardware requires staff and financial commitment that most of the time is disproportionate to its normal level of use. Members of MD iMap's technical committee are therefore particularly interested in the elasticity that a cloud environment could provide for its geospatial data.
Figure 6. Relation of the MD iMap templates within the cloud configuration.
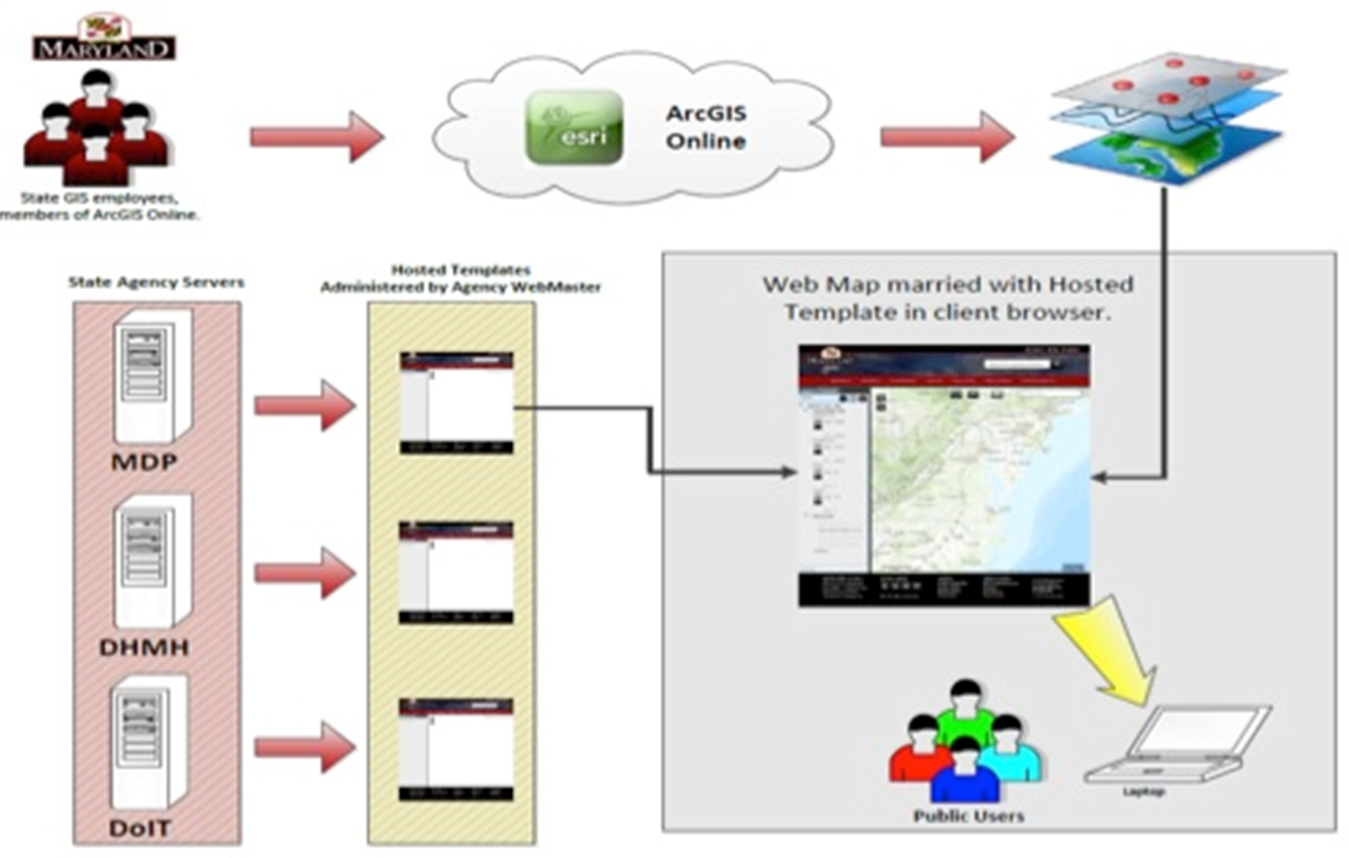
Figure 7. Top screenshot showing MD iMAP's StreamHealth application as it currently exists when accessed through MD iMAP's ArcGIS Online portal. Bottom screenshot showing the StreamHealth application in ArcGIS Online when the template is applied.
MDTA Enterprise GIS System
Prior to 2009, MDTA did not have GIS software. To provide MDTA with GIS capabilities, the business unit's IT department developed a new GIS system using Esri's ArcGIS Server36and Google Earth to serve 1,800 users across MDTA and MDOT. The data the enterprise system uses are stored within MDTA's various departments and analyzed using ArcGIS Server. MDTA's ArcSDE server37 then transfers that data for publication onto Google Earth servers using Google Fusion. In this way, users have responsibility for data maintenance, but the data are accessible to other authorized users within the network via Google Earth Enterprise.38 All data remain within MDTA's firewall. MDTA has also customized the Google Earth application with State-owned background aerial photographs.
Benefits
MDOT sees value in pursuing its current and future cloud-based applications and configurations for the following reasons:
- Cloud-based applications reduce the need for MDSHA to build and maintain servers. With cloud-based applications such as MD iMAP, information from various server locations can be accessed through a single application. Because of this, MDSHA does not need to store data from other agencies on its own servers in order to use them to support its business processes. MDSHA also values not needing to upgrade software across its entire system, as vendors such as ArcGIS Online take care of any upgrades that are immediately accessible by all users.
- Cloud-based applications save staff time. The MUTTS application saves time in searching for data by providing a direct link between the external dig request and the specific internal information that MDHSA staff need to respond. This reduces the need for site visits and streamlines MDSHA's ability to access utilities information.
Challenges
MDOT is experiencing several challenges as it expands its use of the cloud:
Current procurement policies are not necessarily designed for cloud-based services or software. At the agency level, MDSHA staff found that the deployment of cloud-based solutions is limited by the State's current procurement policies. These policies require that competitive bids include Maryland-based small and local businesses; many existing cloud vendors do not fall within this category. Current procedures also incentivize the procurement of hardware by requiring demonstrated longevity and long-term value; the use of cloud-based technologies is, by its very nature, elastic, and pricing structures are often pay-as-you-go.
In addition, if multiple organizations wish to collaborate on a cloud-based initiative, procurement policies require each organization to individually complete the procurement process. For this reason, current efforts to use the cloud occur on a smaller, case-by-case basis as funding and staff time allow, and there is not yet an agency or statewide coordination effort to use cloud-based technologies for Maryland transportation data. MDSHA does not anticipate a joint statewide contract for shared cloud services to develop anytime soon.
- Cloud-based technology is new to many users. MDSHA has encountered some challenges in educating users about cloud-based systems. For example, recently the State transitioned its email services to Gmail, Google's mail services, for 15,000 State employees. While this initiative reduced the amount of server space that needed to be maintained for email, the State found that people did not always understand how to use Gmail's various features and often ended up misusing the email service in the context of business activities. To prevent similar challenges, MDSHA believes that developing a standardized set of templates for web applications when possible (such as through the MD iMAP effort) will help users become familiar with the new technology more quickly, and may provide MDSHA more control in how the agency's data and information is used and disseminated.
- New security considerations must be addressed for cloud-based applications. As MDSHA moves forward to explore cloud-based solutions, it is concerned with placing too much information into one cloud-based server due to the perceived risk of server failure and the need for backup in such situations. MDTA's enterprise GIS system avoids this risk by keeping data stored on Google Earth servers behind its own firewall. MDSHA is also aware of State requirements that data must remain stored within the borders of the United States; with cloud-based servers, it is not always clear where the data are actually stored.
Next Steps
Both the MUTTS application and MD iMAP templates represent efforts to synchronize and link various web-based mapping applications and data sources within the agency and with other State agencies. These efforts will likely serve as models for expanded use of the cloud throughout MDSHA. For example, MUTTS might serve as a model for technologies developed and used to manage and organize customer interactions. Applications could be developed using Salesforce's cloud-based software that are similar in structure to MUTTS but serve different needs, such as providing the public the ability to notify MDSHA about the location of a pothole. MDTA would also like to develop a system similar to MUTTS to link dig requests with data stored on its MDTA servers using a Google Earth software license.
MDHSA's GIS team would like to enhance MUTTS further by using the application to process work permit requests for construction within MDSHA's right-of-way. Currently work permits are granted though another system before dig requests can be submitted into MUTTS; dig requests are entered into eGIS by address rather than by GPS coordinates. By geocoding the work permit within MUTTS directly, MDSHA could more easily pinpoint the dig request and respond more accurately. Similarly, data from other Salesforce-based applications (such as the truck-routing application) could eventually be fed into MD iMAP.
Overall, MDSHA seeks to create a suite of web-based tools to be repurposed and tailored to various audiences and uses. MDSHA staff members are collaborating with colleagues involved with the MD iMAP application standardization effort to share lessons learned. In the meantime, the MD iMAP technical committee continues to discover duplicate datasets that different agencies maintain. In response, the technical committee has created a data-sharing/ownership template to identify the owners and data maintenance schedule so that personnel monitoring MD iMAP applications will be better able to organize and prioritize data as various agencies feed them into MD iMAP applications.
Mid-Ohio Regional Planning Commission
Overview
In 2003, the Ohio Geographically Referenced Information Program (OGRIP), a statewide GIS data integration program, launched the Location Based Response System (LBRS) initiative.39 The LBRS program is intended to collect, maintain, and integrate locational information on roads and addresses from Ohio counties in order to reduce redundant data collection among local governments in Ohio. OGRIP maintains LBRS data files that contain street centerline data along with site-specific, field-verified address points. Participation in OGRIP's LBRS program requires county officials to sign a memorandum of agreement (MOA) with OGRIP. As the lead organization in establishing the Franklin County LBRS files, MORPC is a signatory to the MOA. The MOA outlines roles and responsibilities for updating, submitting, and maintaining LBRS data according to OGRIP's standards.
Ohio counties voluntarily partner with OGRIP to contribute their data through the LBRS program. Seventy-six of 89 counties in the state currently participate. Counties may apply to receive up to $100,000 to fund the collection of LBRS data within their jurisdictions from OGRIP.40 The Ohio Department of Transportation (ODOT) then provides technical support and ensures that LBRS data meet quality standards. Once the LBRS data are integrated into OGRIP, they are referenced by local, regional, State, and Federal governments to support emergency response, planning, and other maintenance and service activities such as paving and snowplowing. The LBRS data are also used to help meet the State's Federal transportation safety data reporting requirements.
In 2008, the Mid-Ohio Regional Planning Commission (MORPC) partnered with agencies in Franklin County, a large urban county, and its municipalities to coordinate county-level LBRS data as part of the statewide LBRS program. Other counties in the region participated in OGRIP's LBRS program in partnership with their own county auditor's offices. MORPC's initiative was termed the “Franklin County LBRS project,” and aimed to address the county's need for a single source of county centerline data that is regularly updated, maintained, and available on-demand. Dedicated servers and an Arc Spatial Database Engine (ArcSDE) geodatabase provided by MORPC allow jurisdictions and agencies to access, add to, and manipulate the compiled data.41 MORPC is also currently developing a web-based editing tool that allows organizations without GIS capabilities to provide and update their data as well.
Development
MORPC serves as the metropolitan planning organization for 1.5 million residents, including Franklin County and all of the jurisdictions located within it. When the statewide LBRS program was launched in 2005, MORPC recognized the increased efficiency and collaboration that standardized and centrally accessible centerline and address data presented, as well as the potential to expand the system to accommodate the collection of other datasets.
Franklin County's agencies, departments, and local municipalities previously collected centerline and address data in disparate locations for their own specific purposes. The Franklin County engineering office, for example, originally initiated its collection of countywide road centerline data to assist with snowplowing, but the centerline data format was not entirely compatible with LBRS requirements. From conversations with various county agencies and departments such as the Franklin County 911 office and the Central Ohio Transit Authority (COTA), MORPC determined there was significant demand to access regional data in a central location. This enables the various agencies to engage in regionally focused activities without having to individually host and maintain large data files. For example, many municipalities have municipal aid agreements for safety/emergency services and require access to information about infrastructure and addresses outside of their service areas.
Currently, eight participating “power users” (including the City of Columbus and the county engineer and auditor offices) contribute data to the Franklin County LBRS files. COTA, the 911 office, the Ohio Department of Public Safety, MORPC, and ODOT all contributed funding to the Franklin County LBRS initiative.
Cloud Configuration
The Franklin County LBRS files represent Platform as a Service (PaaS) and a community cloud deployment model that are maintained by a specific group of users and can be expanded based on their individual or collective needs. The data reside in an ArcSDE geodatabase located on a MORPC server that is accessible to multiple agencies (see Figure 8) through ArcServer. Partners access the LBRS files by connecting to MORPC's map and geodata services. After adding this connection to their GIS servers through ArcCatalog, partnering agencies can access the LBRS files. Because each participating agency has different firewall installations, MORPC had to address unique connection requirements associated with each user's network configuration.
Those agencies or departments with access to ArcInfo or ArcEditor42 are considered GIS “power users.” Power users access their own “version” of the LBRS file on the MORPC server through a secure log-in. The “version” acts as an image of the original file—not as a copy—that users then replicate from the SDE geodata service43 to their respective local networks. The replicated version is still connected to the original file stored on MORPC's server through a map service. Power users then make edits to their local “version” and synchronize their changes with the MORPC server. “Synchronization” is a process through which changes to each partner's version are automatically integrated with the master file and each partner's version through a code script. An editor at MORPC reviews the changes to ensure compatibility with the LBRS standards' and file configuration. Quarterly meetings among the Franklin County LBRS power users provide a forum for technical issues to be addressed and also serve as opportunities for MORPC to advocate approaches to make data collection and maintenance more uniform among the LBRS partners.
Figure 8. Configuration of the Franklin County LBRS system.
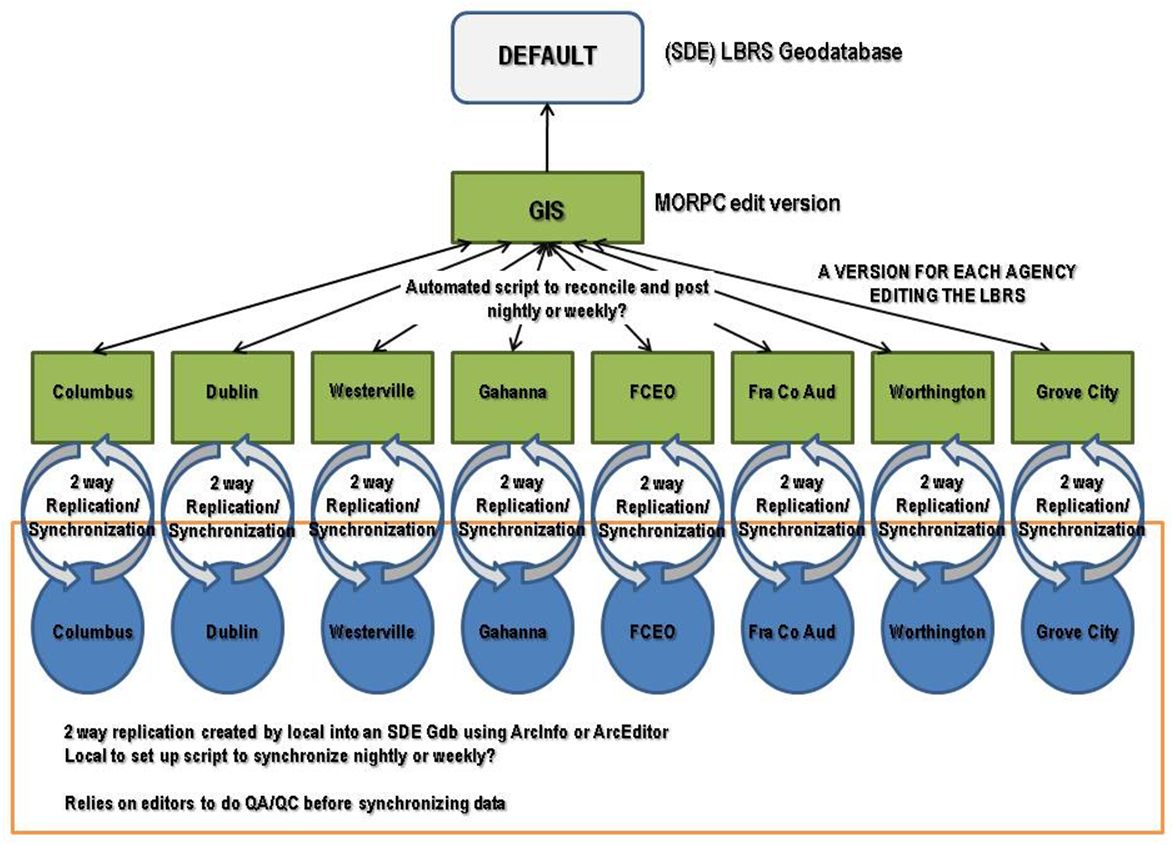
Data Collection and Maintenance
OGRIP provides standards for data collection and maintenance for all participating counties. The first guidance was issued in 2005 and revised in 2007 to address the modeling of roads, overpasses, and roundabouts, as counties indicated they wanted to include more detail in their LBRS data. OGRIP based its standards on the commonly used National Emergency Number Association (NENA) standards for street names and addresses.44 The benefit to using NENA standards is that the statewide LBRS data can eventually be incorporated into NextGen 9-1-1,45 a cloud-based emergency response system that the State is interested in pursuing.
While other counties across the State have hired consultants to collect centerline and address information, MORPC favored building off of existing datasets from partner organizations to foster a sense of ownership and responsibility to maintain their LBRS data. Because the format and content of the various participating agencies' data were so varied, a consultant was hired to develop a base file of centerline and address data from the existing datasets of the participating organizations. This required manipulating the data to meet OGRIP's standards for the LBRS program.
Configuring the base file was time-consuming and complicated—partners' datasets needed to be linked through common data structure and field names with unique identifications. Moreover, the topology of the line work, or how the features share geometry, needed to be adjusted to assure connectivity. In addition, relationships needed to be built between the line segments and address points. While additional fields can be added locally as needed to accommodate legacy data processes, the structure of the shared LBRS files is based on standards provided by OGRIP and cannot be altered. For example, adding roundabouts, cul-de-sacs, and other features must be drawn according to OGRIP guidelines. Because these requirements added a level of complexity that most partners had not previously encountered when building their own GIS datasets, the consultant developed a manual for data entry. MORPC also held training sessions as the Franklin County LBRS files were launched.
Since the Franklin County LBRS tool was established, several municipal safety services have been using the data for its emergency response activities. Some communities have also used the LBRS files to coordinate snowplowing and paving programs on shared streets. The file can also be used to coordinate street maintenance programs so communities can share costs. MORPC is unsure of the extent that smaller communities currently use the file for their business activities.
At the State level, once the LBRS data are integrated into OGRIP, they can be referenced by local, regional, State, and Federal governments to support emergency response, planning, and other maintenance and service activities such as paving and snowplowing. The LBRS data are also used to help meet the State's Federal transportation safety data reporting requirements. ODOT intends to knit all county-level files into a statewide system in the future. Requiring that the files are maintained and updated by the local communities relieves ODOT of the responsibility of tracking municipal roadway data. Franklin County LBRS data are submitted to OGRIP and are currently available for download through OGRIP's website.46
Web-Based Tool
Some of the participating partners of the Franklin County LBRS system do not have access to the full suite of ArcGIS tools. The Franklin County auditor and engineer collect road and address point data, respectively, from these partners, and edit the LBRS files on their behalf. MORPC is developing a web-based ArcServer application that will allow non-power users without ArcGIS to add information through a web application by drawing an overlay onto an image of their file.
Challenges
MORPC encountered several challenges in developing a community cloud platform for the Franklin County LBRS data:
Building the LBRS base file and editing data took more time than anticipated.
While MORPC had institutional capacity to manage and analyze data, building the LBRS files required new expertise and significant staff time. To build trust, all partners were encouraged to participate in selecting a consultant to build the base file. MORPC's IT staff then had to speak with each of their partner agency counterparts to develop a method to connect them to the LBRS file and obtain their data.Integrating data can require changing institutional practices to implement common fields and data structure. For this reason, MORPC emphasized the benefits of having access to a larger, more comprehensive dataset. Because MORPC wishes to encourage continued partner participation by not overburdening partner staff, the agency took on the responsibility for addressing data discrepancies that often arise as changes are made to the data. For instance, adding alleys to the centerline file may break line segments or be inconsistent with other jurisdictions' data. MORPC frequently must address maintenance issues as the file evolves, which has required more staff time than originally anticipated.
- Updating software versions caused significant problems. Multiple errors in the underlying database structure arose when MORPC updated ArcGIS from version 9.3 to 10. Partners that did not have ArcGIS version 10 were unable to replicate their data. MORPC used Esri's help hotline frequently to inquire about this issue (at no additional cost as such technical assistance is part of MORPC's Esri software maintenance fee). Because it takes time for some partners to update their GIS software, MORPC decided to continue using ArcGIS version 10 instead of upgrading to version 10.1 until the replication problems are addressed.
- Lack of a statewide boundary file limits data integration. To accommodate municipalities that include areas in adjacent counties, the Franklin County LBRS files also include LBRS data from areas just outside Franklin County. But because there is no statewide boundary file, county boundaries currently do not align, and MORPC had to work with each adjacent county LBRS manager to address misalignments between roads. Creating a statewide county boundary file with updated county surveys could correct some discrepancies, though this project is not a priority at the State level due to the impacts it could have on private property owners.
- Partners were initially hesitant to participate. MORPC had to gain the trust of partner organizations to ensure they would share their data using the LBRS standard. Trust issues mainly stemmed from the partners' concerns with releasing in-house centerline and address data and associated attributes to an outside agency. MORPC currently does not have MOAs with municipalities to establish data-sharing procedures. The agency believes that the LBRS project is too early in its advancement to request that agencies make a formal commitment to the system's long-term upkeep and expansion. However, county participation in the statewide LBRS program does require that county officials, including the Franklin County Commissioners, county engineer, auditor, 911 dispatches, sheriff's office, Emergency Management and Homeland Security department, and the State sign an MOU with OGRIP to assure that the file will be maintained. MORPC is a signatory to this MOU.
Benefits
MORPC believes the benefits of using a community cloud configuration for the Franklin County LBRS files include increased opportunity for collaboration and the reduction of redundant services and data collection/maintenance. Use of the cloud enables the maintenance of an accurate, centralized, regularly maintained centerline and address point file that adheres to an agreed-upon set of standards, which encourages users' confidence in the data as it is used as a base map for various business activities.
As many counties around the State prepared to participate in OGRIP's LBRS program, they were able to learn what types of data were being collected within their own jurisdiction. Beforehand, local agencies were often unaware of the data their counterparts in the county were collecting. This process helped them to discover new data resources or areas of redundancy. Many agencies responded to these new opportunities for data collaboration by turning to cloud technologies. Approximately eight different State agencies in Ohio now use LBRS data to support activities such as tax district determinations, business relocation efforts, and others.
OGRIP also noted that its transportation safety data is of higher quality than what is currently mandated by Federal regulations due to the ability to better locate crash locations using LBRS data (90 percent of crashes are currently geolocated on a roadway as compared to 40 percent prior to implementation of the LBRS files). The standards and regular updates made easier by cloud technologies facilitated this improvement in its data quality.
Lessons Learned
- Work closely with consultants. MORPC recommends working closely with consultants to integrate and standardize data from multiple sources. Building the base map was time-consuming and several project managers phased in and out of the project. MORPC believes it was important to engage in regular quality control with consultants to ensure that unanticipated issues do not arise from legacy data once datasets are integrated.
- Develop solutions to work around discrepancies in data collection and identification. Since county boundary lines differ, OGRIP is still determining how to best merge LBRS files from around the State. ODOT recommends that agencies develop systems to account for data discrepancies. In the case of the LBRS program, discrepancies can include county boundaries and cross-jurisdictional road names. In the latter case, ODOT had to develop a transportation network reference system and apply this to the data. ODOT notes it would have likely been more efficient to develop this system beforehand and educate the counties on completing this step themselves. As OGRIP has integrated LBRS data from multiple counties around the State, the standards for submitting LBRS data have improved.
- Cloud-based data collection and maintenance systems are most reliable for collecting up-to-date data from disparate organizations. OGRIP does not currently use a cloud-based platform to collect LBRS data from across the State but considers the use of a cloud-based data maintenance and storage system to be a best practice. Approximately 40 Ohio counties have contracts with the same vendor to maintain their LBRS data through a cloud-based system. The vendor checks updated data on a nightly basis for accuracy and compliance with data standards and then posts the data for use by the individual county. OGRIP believes that this approach is helpful to ensure data quality control and that information is up-to-date and accurate.
Next Steps
Shortly after MORPC began working with a consultant to build the web-based tool, Esri released ArcGIS Online. MORPC is currently considering whether to continue with its web-based tool development or if ArcGIS Online will meet its needs. MORPC noted potential security concerns, however, about releasing partners' data to a third-party entity as well as cost concerns.
Based on feedback from power user quarterly meetings, MORPC would like to expand the LBRS files to include other data such as bikeways and to make the information available to the public through an online mapping tool. Data such as capital improvement programs, pavement schedules, and other datasets may also be considered. Adding new types of data would require building additional databases, as well as expanding the MORPC server database capacity. MORPC's goal is to work with the power user group every six months to determine priorities for adding new data to the files.
ODOT does not have immediate plans to use the cloud as part of its OGRIP activities but would like to locate all its statewide data, including LBRS data, in a centralized location. A cloud configuration may be considered in the future.
Utah Department of Transportation
Overview
UPlan47is a cloud-based mapping tool that compiles, integrates, and displays a broad range of data from many different sources within the Utah Department of Transportation (UDOT), other Federal, State, and regional agencies, private utility companies, and the Utah Automated Geographic Reference Center.48 Initially, UDOT intended UPlan to primarily support transportation planning activities. Over time, the tool has expanded to support other business functions, including asset management, safety, operations, and maintenance. UPlan now provides a “one-stop shop” for users in UDOT and other agencies to quickly access transportation and related information, assist UDOT staff in performing business tasks more easily, and improve collaboration between UDOT and partners.
Development and Configuration
In 2007, UDOT staff members began to consider developing a collaborative, interactive geospatial information portal for spatially enabled transportation and environmental data. The portal was intended to make this information, much of which was previously available only in tabular format, more accessible to UDOT staff and partners. UDOT investigated various tools other State DOTs were using that might serve as a model for UDOT's tool, but determined that existing applications did not have the entire range of capabilities that UDOT wanted. Therefore, UDOT decided to create its own tool.
Between 2007 and 2009, UDOT developed the first version of UPlan using custom code built onto an Esri ArcGIS Server platform. Using an ArcGIS Server platform meant that UDOT had to host all of the tool's data on its own servers and manage a web-based interface that used Adobe Flash as its platform. Maintaining the custom code and interface, however, created an unsustainable workload burden on staff. For this reason, UDOT began evaluating a second version of UPlan that used ArcGIS Online,49 an out-of-the-box Software as a Service (SaaS) package. UDOT was introduced to ArcGIS Online at the 2011 Esri Users' Conference and determined that this platform would be the most effective way to support a second version of UPlan.50 UDOT and Esri collaborated to adapt UPlan for ArcGIS Online.
UPlan is an example of a “hybrid cloud.” Non-sensitive information and data that do not need frequent (e.g., daily) updates are stored in Esri's cloud environment. Sensitive data and information that require frequent updating are stored on an internal ArcGIS server behind a UDOT firewall and are only available to UDOT users. UDOT does not provide any formal user training, although it has developed a UPlan training manual and short training videos that are posted on YouTube.51 UDOT also encourages users to access Esri's ArcGIS Online training videos on the company's website.
User Experience and Access
Per Esri's ArcGIS Online policies, UPlan allows for two general types of users. Any individual with web access can use UPlan for free without logging in. These public users can access and view a subset of the application's data that are public content. Agencies can also establish organizational subscriptions (beginning at $5,000 annually), which allow a limited number of individual users within an agency to access UPlan and manage information, both private and public, in an ArcGIS Online environment. Organizational subscriptions offer users more functionality than public users, and they are able to create and make public a variety of maps, as well as analyze and manipulate data via Esri's cloud environment. Designated UDOT staff and consultants have privileges to publish content and view sensitive data, such as Fatal and Serious Injury crash locations within UPlan, as well as other information viewable only to subsets of registered users.
Users can customize how they view these data, including choosing a desired base map, and can edit data to add their own shapes and features along with descriptions. All data layers are searchable, so a user can type in key words to narrow down the layers visible on the map (see Figure 9). Users can also choose to view pre-saved maps, which they can overlay with their own customized set of data.
Figure 9. Screenshot of customized topographic base map, with environment and parcel data added.
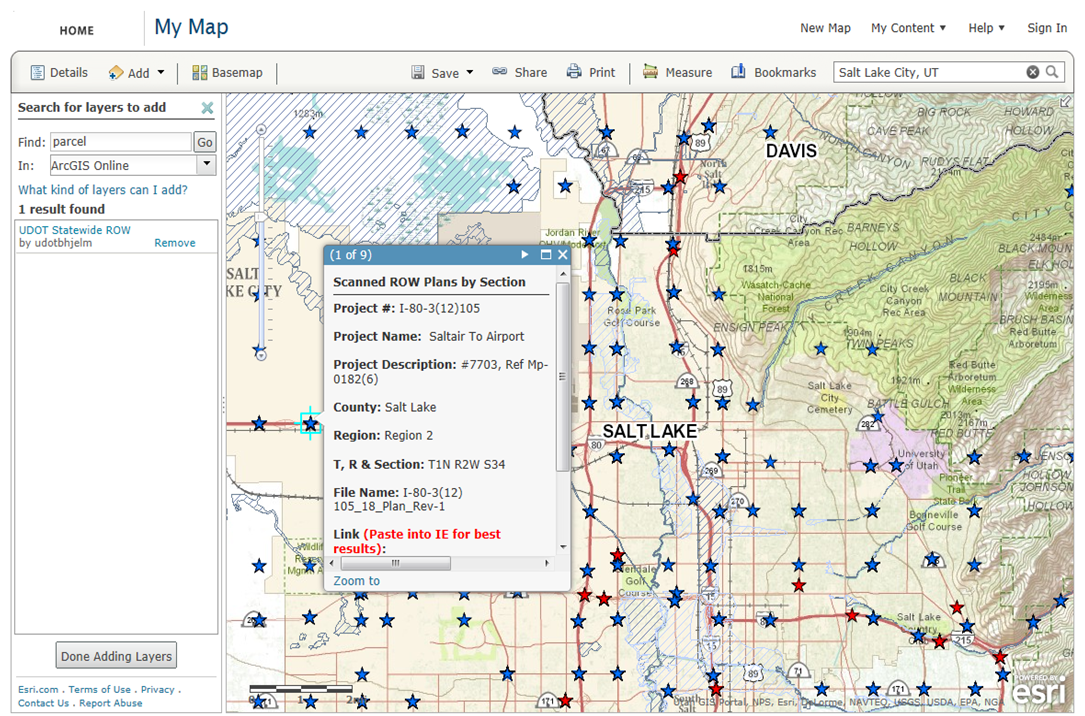
UPlan Data Management
While UPlan's user group has expanded beyond UDOT staff, UDOT has maintained its role as the lead agency for making strategic decisions about UPlan. However, UDOT intentionally adopted a decentralized management structure for UPlan as it believes individual data owners are best able to ensure data quality. This frees UDOT to focus on increasing access to information instead of maintaining data. Most data owners directly upload information or updates to UPlan using an automated process, though three of UDOT's GIS staff members still act as “gatekeepers” to ensure uploaded data meet minimum requirements. Aside from these responsibilities, UDOT believes that a user-driven approach to data maintenance is the most effective way to encourage information sharing and innovation. A more centralized structure may be adopted in the future.
UPlan records its own usage and quality-control metrics. For example, each data layer is associated with a star rating derived from user rankings and user-submitted comments (see Figure 10). The tool shows the number of views each data layer has received. UDOT's Engineering Technology (ET) staff evaluate how many views UPlan has received, the number of maps developed, and what data are most frequently downloaded. Staff then use this data to evaluate which maps and data to feature on the homepage, to determine if people are using the platform effectively, and to organize data for certain topics.
Figure 10. Screenshot of metrics for the Utah Unified Transportation Plan Map in UPlan.
The cost for UDOT's enterprise ArcGIS Online license is approximately $17,500 annually. UDOT has a credit account set up to use ArcGIS Online; credits are deducted for use of the platform but UDOT does not have to pay for bandwidth associated with uploads or downloads. Since most commonly used data are saved in Esri's cloud environment, UDOT has not encountered any internal challenges related to its own server storage space.
UDOT's approach to internal data collection for UPlan has evolved over time. During UPlan's early phases, staff members supporting the tool would approach others within the agency, explain the purpose of the tool, and collect the desired data from these other staff via flash drive. Some staff members were hesitant to share data because they did not fully understand how the information would be used. Ultimately, UDOT found that it was most effective to demonstrate UPlan to these staff and emphasize how the tool could support business needs. In a few cases, UPlan staff found that some data owners had not previously viewed their data in a geospatial context. Once these data owners saw their information displayed on a map, they recognized how the tool could support new analyses. Generally, when staff saw the tool operate and understood its benefits, they were more comfortable sharing data from their respective disciplines.
UPlan data now include files from UDOT sources, online sources, and numerous agencies. One of the primary sources of internal UDOT data is UGate, which is the agency's enterprise GIS database. UGate links to all of UDOT's business data and provides UPlan with the majority of its enterprise content. UPlan also accesses data available on ArcGIS Online from any number of external agencies, groups, and individuals. Users can access these data via a search feature embedded in the UPlan tool. In addition to this information, Esri maintains its own ArcGIS Online data files, which comprise a large amount of transportation infrastructure and demographic information, as well as 12 different base maps (e.g., imagery, streets, topography, etc.). The first version of UPlan contained several hundred data layers before it was integrated with ArcGIS Online. Now, with full integration complete, the second version of UPlan offers access to thousands of layers from sources that include ArcGIS Online, and GIS servers or files from which data owners have uploaded their own data.
UDOT distinguishes between “static” and “dynamic” data. Static data are updated infrequently (e.g., annually) while dynamic data are updated regularly. Currently, about 75 percent of UPlan's data are static, and the remainder are dynamic. UDOT aims to have a higher percentage of dynamic data in the future. Currently, UDOT's IT staff assists data owners in writing scripts that allow for automated updates, although there is no formal schedule for data updates. Data owners can determine how frequently their data should be updated or modified and can decide how much information they want to share. For example, UDOT's Traffic and Safety Division shared some general accident data through UPlan but restricted access to detailed crash information (currently, only two UDOT staff members can view these data on UPlan). Overall, data owners are responsible for maintaining and updating their information, which includes performing quality control checks.
Since UPlan is configured as a hybrid cloud (e.g., some data are stored on UDOT servers while other information is stored on Esri's cloud), the agency can use Esri's cloud storage capabilities for ad hoc or basic data needs and extra capacity, and dedicate more space on local infrastructure for complex data storage. UDOT has also encountered challenges in using its own internal data storage to distribute draft data content, making cloud use a flexible, attractive option.
Lessons Learned
UDOT has not created any formal directives requiring the use of UPlan for certain business activities (e.g., long-range planning). UDOT believes that as people experience the benefits of UPlan and grow more comfortable using it, they will naturally develop a sense of ownership and will want to continue using UPlan to support their own business areas. Additionally, UDOT noted that the tool is expanding so quickly—both in terms of available data as well as its user base—that having formal directives might limit users' creativity and ability to collaborate.
As UPlan grows, UDOT is working to ensure UPlan remains useful by keeping tools simple and engaging both management and users in the tool design process. For example, as one result of this collaboration, UDOT GIS specialists are now able to show all Statewide Transportation Improvement Program (STIP) projects through UPlan using its iMap tool. UDOT has updated its databases to spatially define STIP projects based on the State's linear referencing system, and new data associated with those projects are flagged for publication on UPLAN. Anyone within the State, including regional agencies and the public, can now see and interact with planned projects, which helps agencies communicate project priorities. After a tool has been created, UDOT noted that it is important to ensure that people understand what the tool can do and are able to use it for their day-to-day jobs. UDOT also believes it is important to consider the value of off-the-shelf software. UDOT experimented with using custom code for UPlan but found that this created a larger workload due to ongoing maintenance requirements. UDOT found that buying off-the-shelf software and customizing it as necessary helped keep staff-related costs down and thus reduced risk for the agency. Additionally, this approach allowed staff to spend more time on strategic tasks rather than on maintenance and upkeep.
Benefits
UDOT has informally collected anecdotal evidence, along with a smaller amount of quantitative evidence, to assess UPlan's effectiveness. UDOT anticipates developing formal performance measures in the future, particularly to help evaluate how UPlan has led to time- and cost-savings. Overall, UDOT believes that use of UPlan:
- Provides better, more reliable access to a broader range of information via cloud-based technology. Previously, much of the data provided through UPlan would have been difficult for users to access since it was housed in a variety of locations and was not provided in one consistent geospatial format. UPlan serves as a central, searchable repository for this data. Users can now visualize data most useful to them by layering different types of data stored in one format.
- Increases system capacity without increasing maintenance requirements. UPlan can be easily scaled to demand, meaning that increased use of the system at certain times will not cause slow network speeds or crashes. Esri's cloud environment ensures that UPlan is scaled to demand, leaving UDOT IT and GIS staff free to focus on supporting project delivery.
- Encourages new analyses by expanding access to more information. UPlan allows users to compile a larger range of information in a geospatial context, which previously might have been viewable only in spreadsheet or tabular format. This has helped encourage new forms of analysis. For example, in publishing their data via UPlan, UDOT's pavement group was able to identify opportunities to synchronize planned pavement projects with bridge reconstruction efforts.
Supports new collaborations and strengthens partnerships both within and outside UDOT.
UDOT has many examples of new collaboration that resulted from UPlan. For instance, in the past, there were few opportunities for UDOT and Utah Department of Wildlife Resources (DWR) staff to engage in dialogue and information sharing. UDOT staff members would provide a small paper map of a planned transportation project for DWR staff to provide feedback on potential natural resource impacts. This proved difficult since the map was static and could not contain detailed information. Now, DWR staff members have made wildlife data, such as animal migration paths, available on UPlan. Using UPlan, UDOT staff can easily overlay wildlife data onto a map of a planned transportation project and share it with DWR. The DWR can then manipulate the map to assist with its analysis and provide quicker feedback based on the best information available.UDOT has also forged better working relationships with several of the State's utility companies as a result of UPlan. Prior to developing the tool, UDOT did not have opportunities to share data with utility companies until a project's construction phase. Conflicts would occur when utility companies would identify issues with a project's alignment that could not be easily resolved at a late stage. Now, using UPlan, UDOT has made information on planned transportation projects available to utility companies. These companies can better understand UDOT's priorities and respond earlier in the project development process, reducing the potential for conflict and streamlining project development. UDOT is currently developing a memorandum of understanding to formalize how data will be shared with utility companies.
Realizes cost- and time-savings.
UDOT estimated that its staff used to spend 80 percent of its time collecting and managing information and 20 percent of its time on strategic tasks; this has now been reversed due to UPlan. While UPlan does not eliminate the need for on-site investigations, it minimizes “guesswork,” which saves time. For example, to support analysis of the State's energy development activities, GIS analysts developed an energy map using UPlan that contained information about energy extraction and production across the State.52 Prior to UPlan, conducting this type of analysis would have required more effort and time, as staff would need to investigate where relevant data were stored, contact data owners, determine how to extract the information, and geocode the data. In contrast, the energy map was created within a few days using UPlan and is available for future analyses.UDOT also developed a Planning and Environment Linkages (PEL) tool for use with UPlan, which assists with streamlining project development and delivery. Specifically, staff can use the PEL tool to better assess how transportation project alternatives might affect natural resources, and to develop categorical exclusions (CE) and related analyses. Previously, CE determinations could take days or weeks, but with UPlan's PEL tool they take only minutes. Developing a CE now costs approximately $1,000 instead of roughly $50,000. Additionally, the reports the tool creates are more accurate and resource agencies have more confidence in the information, strengthening relationships between UDOT and resource agencies.
Challenges
One challenge faced by UDOT is that even user-added and user-maintained data requires quality control. UDOT GIS specialists use a workflow process that transforms UDOT's business data into GIS data available in UGate and for web-based consumption on UPlan. Specifically, they use a spatial Extract, Transform, Load (ETL) tool to convert tabular data into location data. UDOT believes the ETL process is cumbersome and time-consuming, and the agency is looking for a new strategy of converting its existing data. Generally, UDOT faces the challenge of ensuring the UPlan data and platform are useful to all levels of staff and the public, while avoiding the duplication of data.
Next Steps
UDOT anticipates that UPlan will continue to evolve over time as more information is added, more users become comfortable with the tool, and the agency uses UPlan to support more of its business processes. For example, UDOT might develop public involvement tools that allow the public to comment on projects displayed within UPlan.
Currently, UDOT is developing a UPlan template map that helps the agency respond to the requirements of the Moving Ahead for Progress in the 21st Century Act (MAP-21). A UDOT staff person could use the template to easily build highly detailed, customized maps that display features that respond to a particular MAP-21 requirement. UDOT is working with other States and FHWA to develop a national MAP-21 template.
UDOT is also working with Esri to determine whether there might be a method to develop a national-scale geospatial tool similar to UPlan that could combine information currently available in different State' MAP-21 maps or others (e.g., highway performance monitoring system [HPMS] maps53) to assist States in responding to MAP-21. UDOT would also like to partner with FHWA in this conversation to better determine what information (e.g., roadway functional class, freight flows, and intermodal activity) States would want to appear on the template and what information States would want to customize. UDOT has informally talked with other agencies about this effort, including Washington State DOT, which has expressed interest in working with UDOT to coordinate MAP-21 information. In the past, UDOT has found sharing data with bordering states about traffic, construction, and safety issues useful.
UDOT is also partnering with a number of other States to assist them in developing their own State applications similar to UPlan. Many of these partnerships are being advanced as part of the AASHTO Technology Implementation Group (TIG). The TIGs provide resources to transportation agencies to advance select transportation technologies and innovations. UDOT and the Idaho Transportation Department (ITD) jointly worked with AASHTO to establish a TIG comprising 13 States, including Utah and Idaho.54 This TIG focuses on exploring how to best build and use cloud-based, collaborative geospatial tools such as UPlan in other States beyond Utah through site visits with other States. UDOT is conducting site visits with other TIG States to share UPlan's framework and discuss ways that the TIG States can implement similar tools. Esri and Bio-West, a consulting firm, are providing pro bono technical capabilities to assist the TIG States with tool implementation.
Washtenaw Area Transportation Study
Overview
Washtenaw Area Transportation Study (WATS) is a multijurisdictional agency responsible for transportation planning in Washtenaw County, Michigan. WATS serves 325,000 residents in 27 cities, villages, and townships, including the City of Ann Arbor. Recently, WATS began using cloud-based systems to support long-range transportation planning activities. In the past, WATS had difficulty soliciting what it believed to be a meaningful level of public participation in its long-range transportation planning process. In response, during the development of its 2040 long-range transportation plan (LRTP), the agency created transportation deficiency maps using Google Maps and Google Fusion for the public to access online as part of its 2040 long-range transportation plan (LRTP) development. WATS also supplemented their LRTP project maps with an online collaborative tool called Mi Community Remarks, which is used to solicit and record public feedback on the maps. The agency is also using Google Fusion and Google Docs to share data and information both within and outside the agency.
LRTP Deficiency Maps
WATS' transportation deficiency maps show transportation facilities, infrastructure, and other elements of the transportation system within the agency's jurisdiction that fail to address the needs of all users, or will likely require improvement within the LRTP timeframe. In the past, WATS produced paper deficiency maps as part of the LRTP development process and sought input from community members.
Since early 2012, several WATS staff members have become familiar with cloud-based tools such as Google Maps and Google Fusion. Google Maps is a free online mapping service that both displays and allows users to display and store spatial information. Google Fusion allows users to store and share tabular data, as well as to easily visualize the data in charts, graphs, and maps. WATS decided these tools could more effectively convey deficiencies in the transportation system to the public, particularly during public meetings where there is a need to quickly and easily share information in an interactive, easy-to-understand format. In previous public meetings, WATS would print paper maps and spreadsheets containing information about deficiencies. By displaying these maps on Google maps with iPads staff brought to public meetings, the public could zoom in and out and click on individual deficiencies to find out more information about each one.
To create its Google-based transportation deficiency maps for the LRTP effort, staff members compiled up-to-date tabular information and shapefiles on deficiencies from a variety of existing sources, including safety data from law enforcement, congestion data from WATS' travel demand model, transit data from transit providers, and bridge data from a State database. Personnel then assembled these data using WATS' GIS program, TransCAD,55 uploaded them into Google Fusion tables, and mapped them using Google Maps (see Figure 11). WATS then displayed these maps on iPads at public meetings in order to gauge the accuracy of deficiencies already listed and identify new ones. WATS also made Keyhole Markup Language (KML) versions of the maps56 available from WATS' website and social media such as Twitter. By providing a deficiency map using Google Maps, WATS allowed the public to both view the entire study area and zoom in to specific deficiencies without ever leaving the webpage.
Figure 11. Transportation deficiency map developed by WATS using Google Fusion and Tables.
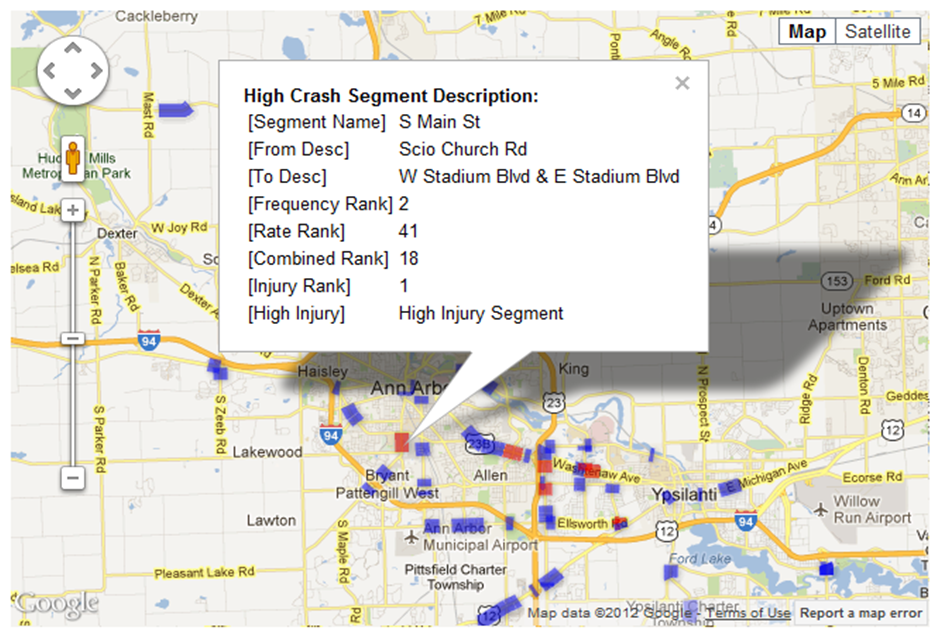
LRTP Project Maps and Mi Community Remarks
After WATS collected feedback on the transportation deficiency maps, local transportation agencies proposed improvements to include in the LRTP. WATS decided to use cloud technology to solicit and accept real-time, public feedback on the resulting proposed project maps. WATS used an application called Community Remarks, a private, Google-based community participation tool. WATS decided to use the tool because its staff currently has limited database programming or Structured Query Language (SQL) expertise available to develop a customized website that could collect feedback. This tool was recently used by the Ann Arbor Transportation Authority (AATA), the region's transit provider, in developing its Countrywide Master Plan.
To customize Community Remarks to best serve the LRTP process, WATS worked with a consultant and with PlaceVision Inc., the Community Remarks developers, to create a custom application called Mi Community Remarks. The customization cost approximately $4,000. Data maintenance and storage for the tool is a third party contractor's responsibility.
Mi Community Remarks, available on WATS' website,57 displays a map of Washtenaw County. Pins on the map, color-coded by project type (e.g. bridge, intersection improvements, non-motorized) indicate the locations of proposed transportation projects in the LRTP (see Figure 12). Users can choose to display one type of proposed transportation project at a time.
Users select a project on the map, add their comments, and suggest new improvements by adding a “new project” as a pin to the map. They can also view others' comments and, similar to some social media applications, reply or “like” or “dislike” these comments. WATS left the tool open for public comment during a 45-day open period and received 100 mostly high-quality comments. The majority of the comments were related to non-motorized projects, and many of the comments were added by transportation professionals. The comments were analyzed according to location and jurisdiction, and will likely be included as additional notes or appendices in the LRTP. The comments may be added to a list of suggested unfunded improvements.
Figure 12. Maps in Mi Community Remarks show proposed projects in the LRTP depicted with colored pins.
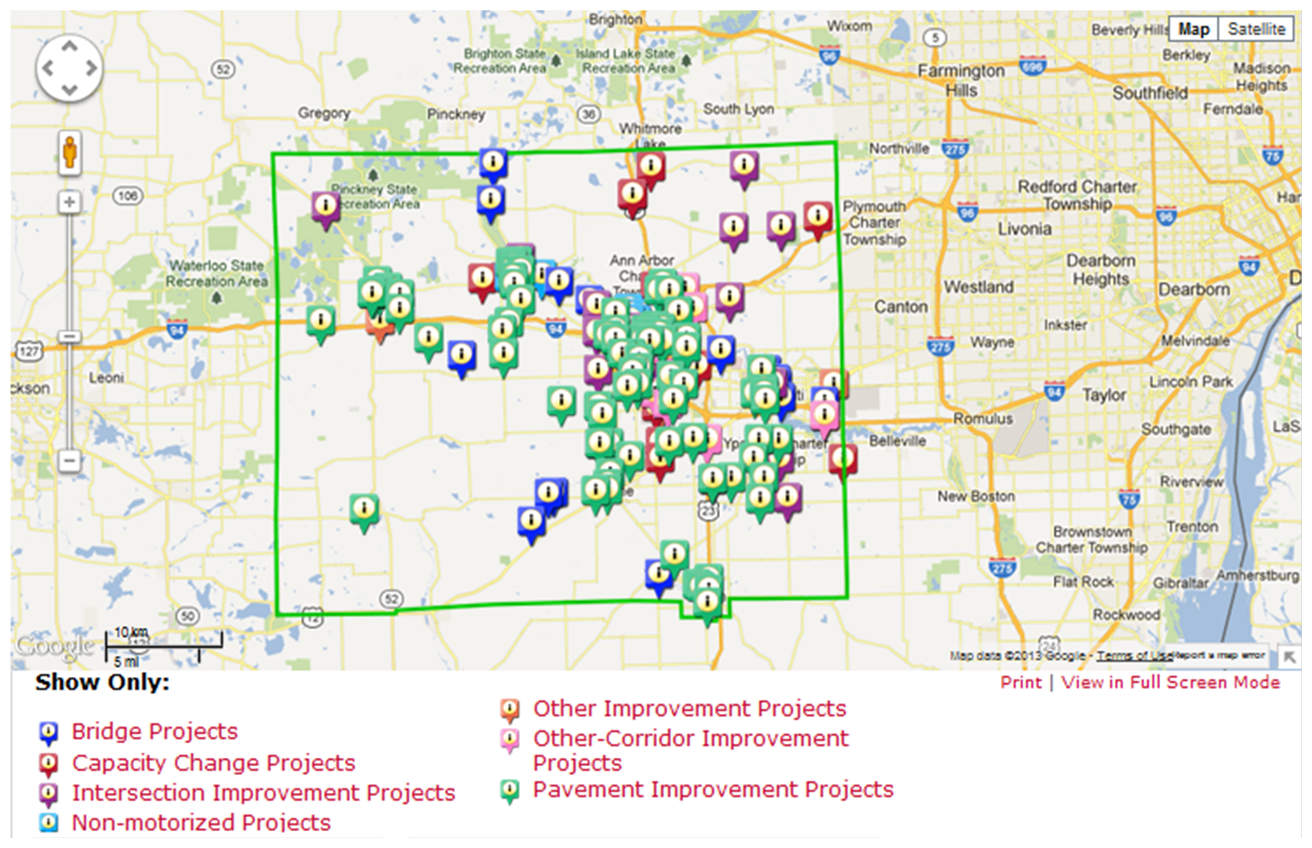
Interagency Data Sharing
In the past, WATS and its partner agencies had difficulty sharing geospatial map files because some of the smaller partner organizations it works with have lacked GIS programs or the technical expertise to create and share large GIS files. Small email server space has also limited WATS' file-sharing abilities.
To address these issues, WATS now uses Google Docs, Fusion Tables, and Drive58 to send data and map requests to partner agencies. Rather than sending large data files, WATS can now send a weblink to a map or table stored in Google Docs or Fusion Tables. WATS also uses Google Drive instead of its own server to store blog posts for the blog it maintains59 to provide the public with updates and information on how to participate in the LRTP process. This has simplified the blog posting and file editing processes, freeing up space on WATS' server. WATS also used Google Docs to write the majority of its LRTP document, which allows collaborative editing outside the office.
Lessons Learned
WATS reported the following lessons learned in its experiences using cloud-based technologies:
- Agencies should reevaluate security concerns as new technologies are adopted. For example, the agency is trying to determine what data would be most appropriate to include on a shared Google Drive versus its own server. Maintaining the security of sensitive or protected data is also a concern, as is developing a process to back up information that lives and evolves on the cloud. WATS found that such concerns complicate how the organization shares data.
- Even modest cloud applications can create powerful results. By using Google Maps, an accessible, user-friendly, and free application, WATS believes it was able to significantly enhance public involvement in the development of its LRTP. In previous LRTP processes, receiving more than 10 comments was rare. Using Mi Community Remarks, WATS received close to 100 comments, often from transportation professionals that might not otherwise have time to participate. In the future, the agency would like to launch the Mi Community Remarks maps in conjunction with public meetings. WATS would also like to bring laptops that display the comment tool to public meetings at informal venues (such as coffee shops, grocery stores, etc.) so the public can easily provide input. This is intended to encourage participation from those not already interested in transportation issues or those without access to computer technology.
Benefits
Cloud technology provided numerous benefits to WATS, its partner agencies, and the public. WATS, a relatively small agency with limited budget and staff, was able to enhance and streamline its business processes at a low cost. Using Google Fusion and Google Maps has made it easier to develop and distribute transportation deficiency maps to a broader audience; in addition, cloud-based applications enabled the maps to be more interactive and publicly accessible than previous paper-printed maps. While learning how to use Google Fusion and Google Maps required some staff time, there were no external costs associated with these tools, and WATS did not face costs associated with paying for a custom application.
Partner agencies were able to take advantage of the free storage space offered by Google Docs and Fusion Tables to share data with partner agencies. This helped streamline agency response to requests for feedback on maps and allowed agencies more flexibility in how they share data.
WATS enhanced collaboration with its stakeholders by using cloud-based technologies. The project maps on Mi Community Remarks, for example, provided an interactive platform through which the public could communicate directly with WATS on their own time and develop new and improved ideas for the LRTP. Setting up a map (e.g. transportation deficiency maps) online allows a partner agency and/or the public to interact more easily with the data than would a paper or static PDF map containing the same information. Using Google Docs and Drive to share documents with the public and partner agencies also supported a more dynamic, collaborative environment by allowing users to share comments and data more easily.
Next Steps
WATS has not yet empirically evaluated the effectiveness of the cloud technologies it used but plans to continue to integrate more cloud-based applications into agency business processes moving forward. The agency foresees increasing the use of tools such as Google Drive for data storage and supporting a mobile office environment in which employees working from home or in off-site locations can use an Internet connection to access internal agency information. In addition, WATS would like to share all maps internally, with partner agencies, and with the public using the cloud. For future LRTPs, WATS will most likely use collaborative technology similar to Mi Community Remarks to solicit public feedback.
APPENDIX A: LIST OF INTERVIEW AND PEER EXCHANGE PARTICIPANTS
| Agency | Name | Title | Work Phone | Work Email |
|---|---|---|---|---|
| Utah DOT | Frank Pisani | GIS Manager | 801-633-6258 | fpisani@utah.gov |
| Bert Granberg | Director, Utah Automated Geographic Reference Center (AGRC) | 801-538-3163 | bgranberg@utah.gov | |
| Steve Quinn | Technology Director | 801-503-6451 | squinn@utah.gov | |
| John Thomas | Planning Director | 801-550-2248 | johnthomas@utah.gov | |
| Bio-WEST | Andrea Moser | GIS Consultant to UDOT and ITD | 435-752-4202 | amoser@bio-west.com |
| Idaho Transportation Department | Bill Shaw | Senior Planner | 208-745-5608 | bill.shaw@itd.idaho.gov |
| Maranda O'Bray | Transportation Planner | 208-334-8483 | maranda.obray@itd.idaho.gov | |
| Erika Bowen | Planning and Program Management Unit Director | 208-334-8552 | erika.bowen@itd.idaho.gov | |
| Washtenaw Area Transportation Study | Ryan Buck | Acting Executive Director | 734-994-3127 | buckr@miwats.org |
| Mark Ferrall | Associate Transportation Planner | 734-994-3127 | ferrallm@miwats.org | |
| Mid-Ohio Regional Planning Commission | Nancy Reger | Deputy Director of Transportation | 614-233-4154 | nreger@morpc.org |
| Cheri Mansperger | GIS Manager | 614-233-4158 | cmansperger@morpc.org | |
| Ohio DOT | David Blackstone | GIS Manager Office of Technical Services |
614-466-2594 | dave.blackstone@dot.state.oh.us |
| Jeff Smith | Spatial Data Infrastructure Manager (OGRIP) |
614-466-8862 | jeff.smith@ohio.gov | |
| Maryland State Highway Administration/Maryland Transportation Authority | Kaushik Dutta | IT Program Manager Maryland Transportation Authority |
410-537-6727 | kdutta1@mdta.state.md.us |
| Mike Sheffer | Assistant Division Chief/GIS Coordinator | 410-545-5537 | msheffer@sha.state.md.us | |
| Barney Krucoff | State Geographic Information Officer | 443-370-3008 | barney.krucoff@maryland.gov | |
| Jason Keppler | Senior GIS Analyst, State Geographic Information Analyst | 410-260-7872 | jason.keppler@maryland.gov | |
| North Carolina DOT | John Farley | Manager, GIS Unit | 919-707-2151 | jcfarley@ncdot.gov |
| U.S. DOT - Federal Highway Administration | Mark Sarmiento | FHWA Office of Planning | 202-366-4828 | mark.sarmiento@dot.gov |
| U.S. DOT - Resource Center | Ben Williams | Metropolitan Planning Specialist | 404-562-3671 | Ben.Williams@dot.gov |
| U.S. DOT - Volpe Center | Jaimye Bartak | Transportation Analyst | ||
| Paige Colton | Environmental Protection Specialist |
*Those whose names are bolded participated in the interviews. Those whose names are italicized participated in the peer exchange.
APPENDIX B: INTERVIEW GUIDE
Introductory Questions
- Please describe [name] application/project/tool.
- What is the general purpose of this tool? (i.e., is it intended to facilitate data manipulation, data sharing, collaboration, improved communications, storage, etc.?)
- What problems/issues does it attempt to address?
- How does it use the cloud?
- Who are the intended users?
- What types of data are included (can you provide some examples)?
Decision-Making
- Why did you decide to use cloud technology?
- What did this technology offer that traditional technologies/systems did not?
- Why did you think this technology could meet your business needs?
- Does cloud-computing hold a particular advantage for GIS? If so, in what way? (cost, storage space, speed, etc.)
- Did you look to any other examples from other States (or within your own State) when deciding to use the cloud?
- What did you have to consider before pursuing cloud-based technologies?
Development
- Who was involved in developing the tool and its use of cloud technology? (i.e., did you partner with other agencies, hire a consultant, etc.?)
- Did you previously use cloud infrastructure, platform, or software applications (or all)?
- How did you decide how much of the tool to locate in the cloud? (i.e. Was this decision based on functionality, security, cost, etc.?)
- What cloud and software vendors will you be using or are using?
- How do the cloud-based elements of this tool integrate with existing systems/data?
- Does using the cloud enhance/add to existing systems/data? Or does it require reconfiguration of data/systems?
- How much did developing the tool cost? Are there any ongoing costs (e.g., maintenance) and if so, can you estimate these costs?
Configuration
- Where is your cloud “located?” Is it on-site at your agency or managed off-site by a third party?
- Why did you choose this configuration?
- Where do the GIS data come from?
- How were these data initially obtained and from what sources (e.g., internal or other agencies?)
- Were any formal mechanisms required (like MOUs) to formalize data-sharing arrangements?
- How often are data updated?
- If you host a private cloud, what are the benefits of this configuration?
- Are there savings in terms of time/cost?
- How do you grant access to users outside your organization? How were terms of access established?
- If you use a third-party or community cloud, what are the benefits of this configuration?
- How did you choose a vendor?
- How do you pay for ongoing use of the third-party cloud? (e.g., general terms of contract/use)
- What are the terms of access for those who joined with your organization to form the community cloud?
- If you use a hybrid cloud, what are the benefits of this configuration?
- What were the reasons to pursue this configuration?
- Can data from the third/party or community cloud be integrated with private cloud data/systems?
Management and Maintenance
- How is this tool managed (e.g., collectively, or by one organization/division)?
- Who oversees the data input and maintains data and software/infrastructure?
- What type of user support is provided?
- How do users learn to interact and use the tool?
Evaluation
- How has this tool impacted delivery of transportation projects or government services?
- Has there been a reduction in redundant activities?
- Have partner agencies or users been able to reduce their reliance on their current infrastructure/software/data sources?
- How has this tool impacted inter- or intra-agency collaboration? What are some of the outcomes of that collaboration?
- Has your agency experienced cost-savings in using the cloud (through reduced cost of data storage, reduced IT support, reduced capital investments in software, etc.)
- What feedback have you received on your cloud-based GIS tool from users, agency leadership, etc.?
- Where do you see this tool headed in the future? (expansion, greater access, increased number of partners/users, etc.)
- Do you have plans to use the cloud in new ways in the future?
General Benefits/Challenges and Lessons Learned
- What are some of the challenges you have encountered in using cloud-based technologies?
- Do you use cloud-based technologies for other business needs besides GIS?
- Please identify any lessons learned from pursuing, developing, or maintaining a cloud-based geospatial tool.
Additional Questions
- Do you feel there are adequate resources available for agencies to pursue this type of tool/configuration? If not, do you have suggestions for what additional resources might be useful?
- Are there any other resources (online or otherwise) related to your application/effort/tool that you suggest we take a look at, or other contacts you suggest talking to?
- Would you be interested in participating in a follow-on peer exchange sometime in the spring? What topics would you be interested in learning about?
- How can FHWA best support you in using cloud-based technologies?
- Would you be willing to write an article for the FHWA GIS in Transportation newsletter by the end of January or be featured in a short webcast in late February?
APPENDIX C: PEER EXCHANGE AGENDA
Goal: Share lessons learned, best practices, and challenges in using cloud technology for geospatial applications.
| Thursday, May 9 | ||
|---|---|---|
| 8:30 - 9:15 | Welcome, Introductions, and Background | USDOT Volpe Center and Idaho Transportation Department |
| 9:15 - 10:30 | Demonstrations/Presentations 1 |
|
| Break | ||
| 10:45 - 12:00 | Roundtable 1: Cloud Definitions and Background | All Participants |
| Lunch | ||
| 1:00 - 1:45 | Overview of FHWA GIS and Cloud Activities | Federal Highway Administration |
| 1:45 - 3:00 | Demonstrations/Presentations 2 |
|
| Break | ||
| 3:15 - 3:40 | Demonstrations/Presentations 3 |
|
| 3:40 - 5:00 | Roundtable 2: Cloud Configurations | All Participants |
| 5:00 - 5:15 | Day 1 Key Points/Wrap-Up | Federal Highway Administration |
| 6:00 | Informal Dinner | (Location TBD) |
| Friday, May 10 | ||
| 8:00 - 8:15 | Day 1 Re-cap | Federal Highway Administration |
| 8:15 - 9:30 | Demonstrations/Presentations 4 |
|
| 9:30 - 10:30 | Roundtable 3: Implementation and Data Considerations | All Participants |
| Break | ||
| 10:45 - 11:45 | Roundtable 4: Next Steps and Areas of Opportunity | |
| 11:45 - Noon | Day 2 Key Points/Wrap-Up | FHWA |
| Noon | Adjourn | |
APPENDIX D: PEER EXCHANGE ROUNDTABLE QUESTIONS
Roundtable 1: Cloud Definitions and Background
- How do you define “the cloud?”
- Why is using the cloud important in geospatial analyses and use of GIS?
- What are the potential, perceived, and actual benefits of using the cloud?
- How do government agencies’ uses of the cloud for geospatial analyses differ from other sectors?
- What are some general barriers, challenges, and potential areas of opportunity in using the cloud for geospatial analysis?
Roundtable 2: Cloud Configurations
- What are the different cloud configurations in use at your agency?
- How can agencies determine the most appropriate cloud configuration for their needs? What factors should be considered?
- What are the best ways to determine financial arrangements/procurement for cloud technologies? Who pays for what and what are the best ways to determine this (e.g., does agency pay for data downloads or just the platform)? How can agencies best use current funding mechanisms (some of which may be restricted) to support cloud activities?
- How can agencies best work with third parties (e.g., vendors, local governments) in setting up or running cloud systems?
- ArcGIS Online seems to be important in most agencies” use of the cloud – why is this the case? Have agencies worked with other vendors?
- Do all cloud deployment models (e.g., hybrid cloud, private cloud, community cloud) have the same benefits or are there certain benefits that are specific to certain models?
- How are agencies using the cloud to support interaction with multiple devices (e.g., mobile devices, tablets)? What are the benefits, challenges, and potential areas of opportunity?
Roundtable 3: Implementation and Data Considerations
- How do or did agencies present a business case for the use of the cloud to support geospatial analysis? Is agency leadership generally supportive of these efforts?
- Have agencies developed statewide or agency-wide strategies for using the cloud or are cloud-based initiatives more ad-hoc at this point?
- How can agencies ensure that high quality/accurate data are being shared using the cloud? How can data security/privacy be assured in cloud environments?
- What kinds of challenges are agencies encountering in using the cloud?
- Policy challenges (e.g., procurement)
- Legal issues (e.g., ensuring data privacy)
- Other (e.g., training, cultural shifts, leadership support)
Roundtable 4: Next Steps and Areas for Opportunity
- What are some “driving trends” that currently or will influence the landscape of how public sector transportation agencies use the cloud?
- How can States best work with partner organizations, Federal agencies, and local agencies/jurisdictions in using the cloud for geospatial analysis? Can agencies provide any examples of success stories?
- What new areas are agencies exploring or considering, in terms of enhancing existing applications, developing new applications, or pursuing other efforts/avenues in utilizing the cloud?
- What resources do agencies need to successfully use the cloud for geospatial analysis and how can FHWA help?
APPENDIX E: ESTIMATED RETURN ON INVESTMENTS
ESTIMATED RETURN ON INVESTMENTS
November 14, 2012
Potential Tangible Savings:
| Est. Total Savings FY07-11 | Description | Est. Savings per year (future) | |
|---|---|---|---|
| Corridor Inventories | $78k | Collect and Review Data Conduct Environmental Scan Develop Inventory Report |
$60k |
| GIS Map Requests | $81k | Simple map requests Assume 25% per 1 staff member |
$16k |
| ITIP Publication | $127k | Draft STIP and associated public involvement printing costs | $7k |
| Construction Change Orders | $163k | Breakdown in communication and coordination with utilities | $20k |
| DMV Over Legal permit requests | $34k | Routing permit requests Assume 5% per 6 temporary records specialists |
$7k |
| Environmental Documents | $1.75M | Compiling data for environmental documents (ITD and consultant costs combined) |
$350k |
| $2.2M | $460k |
Detailed Breakdown:
| Corridor Inventories | Collect and review data, conduct environmental scan, develop inventory report | ||||
|---|---|---|---|---|---|
| FY | KN | District | Project Name | Estimated Cost Savings | Work Tasks |
| 07 | 9801 | D2 | SH-8 Moscow to Troy Corridor | $13,200 |
|
| 07 | 9967 | D3 | Idaho 55 Access Management Plan | $10,800 |
|
| 07 | 9968 | D3 | US-95 Access Management Plan | $20,300 |
|
| 08 | 9972 | D3 | US 20-26 Environmental Scan | $9,800 |
|
| 09 | 9971 | D3 | Idaho 45 Environmental Scan | $13,600 |
|
| 11 | 12295 | D1 | SH-53 Access Management Study | $10,000 |
|
| Total Estimated Savings for FY07-11 | $77,700 | ||||
| Estimated Savings per Future Fiscal Years |
All | Every District is annually expected to create a new corridor plan or refresh an existing plan. Assume $10,000 savings |
SH-53 Access Management Study | $60,000 | |
| GIS Map Requests | Assume 5% per 1 staff member to perform department-wide simple map requests | |||
|---|---|---|---|---|
| FY | District | Project Name | Estimated Cost Savings | Work Tasks |
| 07-11 | HQ | Statewide Planning | $81,250 (total) |
|
| Estimated Savings per Future Fiscal Years |
HQ | Assume continued potential savings in simple map making requests. |
$16,250 | |
| ITIP Publication | Draft ITIP and associated public involvement printing costs | ||||
|---|---|---|---|---|---|
| FY | KN | District | Project Name | Estimated Cost Savings |
Work Tasks |
| 07 | HQ | Statewide Planning | $35,000 |
|
|
| 08 | HQ | Statewide Planning | $35,000 |
|
|
| 09 | 10703 | HQ | Statewide Planning | $35,000 |
|
| 10 | 10705 | HQ | Statewide Planning | $15,000 |
|
| 11 | 11194 | HQ | Statewide Planning | $7,000 |
|
| Total Estimated Savings for FY07-11 | $127,000 | ||||
| Estimated Savings per Future Fiscal Years | HQ | Assume future potential savings in ITIP and concurrent public involvement printing costs | $7,000 | ||
| Construction Change Orders | Only captured specific examples where savings could be determined. Sporadic due to data availability. | ||||
|---|---|---|---|---|---|
| FY | KN | District | Project Name | Estimated Cost Savings |
Work Tasks |
| 07 | 8465 | 1 | SMA-7155, HONEYSUCKLE AVE TO MILES AVE, HAYDEN | $6,350 |
|
| 08 | 9509 | 3 | SMA-7803, INT CHICAGO ST & 21ST AVE, CALDWELL | $2,881 |
|
| 09 | 6961 | 4 | US 93, FALLS AVE TO POLELINE RD, TWIN FALLS | $11,000 |
|
| 10 | 8065 | 1 | US 95, WYOMING AVE TO SH 53, HAYDEN | $10,000 |
|
| 10 | 12276 | 1 | STC-7208, FRONTAGE RD for US 95; S of LANCASTER TO BENTZ | $17,000 |
|
| 11 | 9791 | 1 | US 95, GARWOOD TO SAGLE, ATHOL STG | $45,000 |
|
| 12 | 8670 | 3 | SH 55, N FK PAYETTE RV BR, CASCADE | $70,500 |
|
| Total Estimated Savings for FY07-11 | $162,731 | ||||
| Estimated Savings per Future Fiscal Years | ALL | Assume future potential savings in better earlier communication and coordination with utilities. | $20,000 | ||
| DMV Over Legal Permit Requests | Assume 5% savings per six temporary records specialists | |||
|---|---|---|---|---|
| FY | District | Calculations | Estimated Cost Savings |
Work Tasks |
| 07-11 | DMV | (6 temps) x (8 month/12) = 4 FTE (4 FTE) x (2080hrs/yr) = 8,320 hrs (8,320 hrs) x (5%) = 416 hrs (416 hrs) x ($16.50/hr) = $6,864 |
$34,320 (total) |
|
| Estimated Savings per Future Fiscal Years | HQ | Assume future potential savings in ITIP and concurrent public involvement printing costs. | $7,000 | |
| Environmental Document Preparation | Based on estimated hours spent compiling data on a project. | ||
|---|---|---|---|
| FY | District | Calculations | Estimated Cost Savings |
| 07-11 District Effort |
All |
|
$1,250,000 (total) |
| 07-11 Consultant Effort |
All |
|
$500,000 (total) |
| Estimated Savings per Future Fiscal Years | ALL | Assume future potential savings in environmental document preparation for both consultants and District staff. | $350,000 |