July 2018
A Newsletter from the Federal Highway Administration (FHWA)
www.gis.fhwa.dot.gov
DDOT Using Centerlines for Safety and Beyond
Article by James Graham, GIS and Applications Manager at District Department of Transportation
Upcoming Events
- MidAmerica GIS Consortium (MAGIC) announced its 2018 symposium marking the network’s 30th anniversary.
April 23-26
Omaha, Nebraska
Introduction
At the 2017 FHWA Highway Information Seminar (HIS), representatives from several states gathered to discuss a great variety of topics: roadway GIS inventory, spatial analysis, traffic data modeling, Big Data, pavement data, and a multitude of other topics. One of these discussions involved the future of data collection and how states might implement new approaches to make the process more efficient. The heart of the conversation was that programs should strive to ‘make things once and use them a bunch;’ and that GIS data should fulfill a multiplicity of uses while reducing ‘one-off,’ static data products.1
The Model Inventory of Roadway Elements (MIRE) Report is a ‘comprehensive listing of data elements needed for safety analysis.’2 Looking beyond its rather staggering size (there are over 200 individual data items), the District Department of Transportation (DDOT) sees MIRE as an opportunity to take a look at our systems of record (namely, the linear referencing system, or LRS) and reflect how we can improve them to ‘make things once, then use them a bunch.’
This article suggests two primary approaches to aid in the automated extraction of a large number of MIRE data elements (81, estimated), however the benefits go beyond MIRE. DDOT contends that the LRS centerline should be regarded as more than simply ‘where the centerlines come from.’ Taking a new look at what’s possible with LRS can yield additional data in support of MIRE and potentially much more.
Background: FHWA’s MIRE Report
The ‘MIRE Report’ (‘MIRE 1.0’) lists individual safety data elements and describes the data collection requirements for those elements.
The report states unequivocally: simply having high quality crash data is not enough. Detailed GIS roadway and traffic data are essential elements, enabling a more comprehensive safety data analysis and providing more context and understanding to the entire safety picture. According to the MIRE Report, “(t)he Interactive Highway Safety Design Model (IHSDM), SafetyAnalyst, the Highway Safety Manual (HSM), as well as the National Cooperative Highway Research Program (NCHRP) Series 500 Data and Analysis Guide, all require crash, roadway, and traffic data to achieve the most accurate results.”2
MIRE 2.0
| MIRE |
Description |
| 18 |
Direction of Inventory |
| 21 |
Federal Aid |
| 24 |
Surface Type |
| 35 |
Median Type |
| 110 |
Unique Junction Identifier |
| 112 |
Location Identifier for Road 1 Crossing Point |
| 113 |
Location Identifier for Road 2 Crossing Point |
| 116 |
Intersection/Junction Geometry |
| 121 |
Intersection /Junction Traffic Control |
| 129 |
Unique Approach Identifier |
| 168 |
Unique Interchange Identifier |
| 172 |
Interchange Type |
| 177 |
Ramp Length |
| 181 |
Ramp AADT |
| 182 |
Year of Ramp AADT |
| 185 |
Roadway Type at Beginning Ramp Terminal |
| 187 |
Location Identifier for Roadway at Beginning Ramp Terminal |
| 189 |
Roadway Type at Ending Ramp Terminal |
| 191 |
Location Identifier for Roadway at Ending Ramp Terminal |
Table 1: MIRE FDE Which are Not Satisfied by HPMS Data
In early February 2018, the MIRE 2.0 Report was released.3 Below are a few of the major changes:
- 3 additional elements (2 items were split; 1 new item)
- Each element has a very useful ‘crosswalk’ table. This table notes where what other system or program this data item can be imported from.
- One rather significant retraction: FHWA no longer indicates which items are optional or required by the above-referenced safety programs/systems.
Overall, the updates are a welcome change: bringing useful references to help point DOTs in the right direction for building their inventory of safety data for analysis.
MIRE FDE
In 2011, FHWA classified 37 data elements within MIRE as critical for safety data analysis: Fundamental Data Elements or FDE. The FDE were classfied as ‘essential’ items needed to meet the basic requirements of most any safety analysis system, including the safety analysis tools mentioned above.4 Additionally, the MIRE FDE are a requirement established by the MAP-21 legislation and reaffirmed by the FAST Act. With some minor adjustments in MIRE 2.0, the total number of FDE now rests at 38 data elements (Federal Aid/Route Type was split into two elements). Thankfully, the true count of the FDE is actually less than that:
- Duplicated MIRE Elements: Of these 38 FDE, four elements are duplicated, appearing twice, but in different sections. This brings the total unique elements down to 34. The duplicates are:
- Functional Class
- AADT
- AADT Year
- Governmental Ownership
- Already Covered by HPMS: We found that of those remaining 34 MIRE elements, nearly half (15) are satisfied by a statewide HPMS full-extent submission.
The remaining 19 non-HPMS FDE shown in Table 1 should then become the central focus of the state’s responsibility as it relates to MIRE.
Making MIRE More Sustainable
The goal of this project is to maximize the automated extraction of the MIRE elements to the greatest extent possible. From DDOT’s perspective, there are two main factors which inhibit the automation:
- Limited Guidance for ‘Linking’ Related Data
Throughout the MIRE Report (both 1.0 and 2.0), a multitude of MIRE elements mention that the item “…(m)ust be consistent with other MIRE files for linkage.” Although it is only a suggestion, we view this as an absolutely critical requirement. In his presentation from the 2017 GIS for Transportation Summit, Jesse Day stated “what MIRE needs most is a data model.”5 Many of these data are heavily interrelated. Without a data model to relate and link the vast array of data items, MIRE data can be potentially difficult to manage and collect.
- Existing Roadway Data Sources Require Continuous Collection and Recollection
In FHWA’s MIRE MIS Lead Agency Data Collection Report,6 the efforts of two states highlight many of the challenges currently facing most states. The two states (New Hampshire and Washington) provided very good approaches to the problem by deriving data from GIS (or other systems) and also performing field and in-office collection to capture remaining MIRE data elements. But one major issue remains: if subsequent changes are made to the roadway, many of the MIRE elements would need to be recollected. Collecting data in this way is difficult to sustain because the MIRE elements are collected and maintained individually. To the greatest extent possible, we should derive and extract from GIS/LRS. If the LRS does not have the data which allow for the automated extraction of MIRE elements, we should seek to add high-value datasets to our LRS which do.
To address these issues, DDOT has chosen two approaches which when used in combination, have helped us automate a significant quantity of LRS-referenced MIRE data items:
- Intersection Model:
Create a simple intersection model which maintains key topologic relationships between the intersection and roadways, derived from the LRS.
- Roadway Cross-section Data:
Create a sectional LRS inventory of the road and include relevant types of information which are commonly needed by MIRE such as lanes, buffers and medians, widths and directionality.
MIRE Intersection-Leg Model
The MIRE Report gives special attention to at-grade intersection/approaches, which comprise over one quarter of the total MIRE listing (58). Most of these elements are relational in nature. For example, in MIRE 2.0, element #147 is Crosswalk Presence/Type. Simply collecting the crosswalk location is not sufficient because a link/reference ID must be stored to persist the relationship between the crosswalk and the Intersection Approach ID (MIRE #128). Similarly, a link must also be stored between the intersection approach and the main intersection point which is MIRE element #110, or Unique Junction Identifier.
To account for this complexity, it is preferable to maintain a data model that can accommodate the complexity. DDOT created a very basic ‘Intersection-Leg’ data model which addresses our need in this regard. A single point represents an at-grade intersection; LRS event segments are created to relate the intersection to the intersecting routes. (NOTE: For this project, we chose to focus on modeling for the at-grade intersection types, but have plans to address interchanges in a secondary project).
Below are the primary components for this basic intersection model:
- Intersection Points
- Roadway Segments
- Intersection Approaches

Figure 1: Reducing Roads and Highways Intersections to Single Intersections
Intersection Points
ESRI Roads and Highways (DDOT’s enterprise LRS platform) manages intersections as a collection of points—two or more points for each intersecting road at that intersection. For MIRE, a single, unique entity/point should represent the intersection. Similar to other DOTs, we have authored a script process to reduce this collection of points to a single point feature to serve as the representative point for the intersection.7 This script reduces the stack of intersection points (#1 as shown in Figure 1) into a single representative point (#2).
Roadway Segments
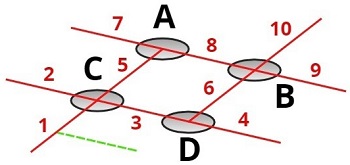
Figure 2: Illustration of roadway segmentation
A LRS is typically designed with centerlines as single, unbroken route polylines. For DDOT, a Roadway Segment is a segmented route polyline which falls between two intersection points. This is somewhat similar to the GIS process of ‘planarizing’ line features, but instead of splitting polylines at every intersection, DDOT requires that driveways and other private road polyline types are ignored. Because DDOT needs to be selective about what necessitates a break in the geometry, we’ve created a script that does just that.7 Figure 2 illustrates the segmentation results. Note that the private driveway (the green dashed line), has been excluded. Because of this, segment #1 remains unbroken.
Intersection Leg Segments
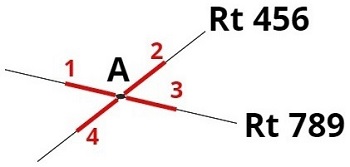
Figure 3: Generating Intersection Approaches at Intersections
Leveraging both the Intersection Points and Roadway Segments, it is then quite straightforward to create ‘leg’ segments for a given intersection. In final script for the intersection model, we create a series of linear events (up to 10 meters in length), offset from the related intersection point for every connected Roadway Segment.7 Figure 3 illustrates the results at an example intersection. Once the events are created, we persist the azimuthal direction and all relevant topological relationships into the attribute table. Another purpose for the Approach Segments in this context is to provide a discrete linear selector for roadway cross-section event data (discussed below in Extraction).
Other Intersection Modeling Tools
While the above may work for DDOT, there are a few commercial firms that offer much more advanced LRS-based intersection modeling tools for LRS intersection creation and MIRE data management. DDOT plans to use Intersection Manager8 from Transcend Spatial Solutions to help us manage and extract MIRE data for interchanges.
Cross-sections, Directionality and Relationships
Having an intersection model is a great start to organizing and structuring the LRS for MIRE, but a model alone will not make much of a dent in the MIRE data elements. You must have a rich data source that lends itself to many uses. At the start of the article, we stated that an overarching goal should be to ‘make it once, use it a bunch.’ Looking at the MIRE elements with this perspective in mind, we attempted to identify elements which are amenable to automation. We noticed that many elements were simple descriptions, having one or more of the following three key characteristics:
- Cross-sectional roadway data
- Lane type counts
- Width or length
- The presence/absence of a lane type or feature
- Directionality
Traffic flow/direction in relation to one or more of the above
- Relationships
A topological relationship between an intersection and/or a connected roadway
Cross-section Events
Looking at the above key items, we determined that capturing a linearly referenced ‘high-definition’ cross section of the roadway would capture a significant percentage of MIRE and potentially benefit other program needs well beyond MIRE. Since LRS is our system-of-record and maintaining a connection to that system is highly valued, DDOT determined that every element of the cross section should be stored as a linear event within the LRS. Additionally, the events are indexed from the left to right, according to the ascending geometry direction of a given route. A cross-section event can be any number of features that occupy a meaningful portion of the roadway such as through lanes, turn lanes, medians, parking lanes, painted buffers, bike lanes, or a painted centerline. This is very similar to the graphical cross sections often used by transportation planners and designers (see Figure 4). For a comprehensive listing of the cross-section elements DDOT collected, please visit our detailed data dictionary on the DDOT GIS wiki site.9
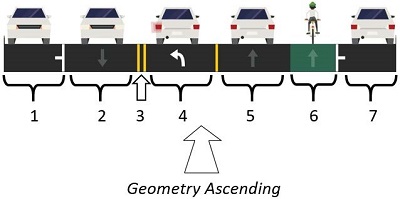
Figure 4: Cross section of indexed LRS data using Streetmix
Primary attributes for the DDOT LRS cross section include:
- Index Position (left to right as geometry ascends)
- Cross-section Types
- Lanes
- Medians
- Barriers and Buffers
- Direction of Section (Lanes only)
- Width (ft)
Roadway Context
A key point to highlight is that this method captures all section features as they appear in the roadway from left to right. Capturing the data in this way preserves the ‘context’ of the roadway as a core component of the data. For example, it’s easy to determine from the data whether or not a bike lane is directly adjoining a parking lane. Referring to Figure 4, one can tell the bike lane in the graphic is index 5; since the parking lane is index 6, they are adjoining. Table 2 shows how Figure 4 looks in the LRS cross-section event table.
For more detailed discussion on the LRS data and the data collection project which captured these data, please visit DDOT’s GIS Wiki which discusses the data structure and provides additional background.
| LRS Cross-section Index |
1 |
2 |
3 |
4 |
5 |
6 |
7 |
| Type |
Parking |
Through |
Double-Yellow Centerline |
Left-Turn Only |
Through |
Bike |
Parking |
| Width (ft) |
8 |
10 |
—— |
10 |
10 |
6 |
8 |
| Direction |
Inbound |
Inbound |
—— |
Outbound |
Outbound |
Outbound |
Outbound |
Table 2: LRS Data Corresponding to Figure 4
Extraction in Action
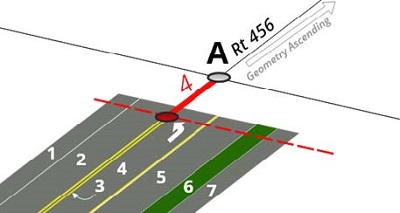
Figure 5: Example of Using an Intersection Leg (ID 4) to Access Cross-section LRS data for Route 456
With an intersection-leg model combined with cross-section linear event data, we now have the ability to perform extremely detailed queries on our LRS cross section using the route/measure location of any intersection leg and extract MIRE data as needed. Figure 5 below is an expanded illustration of Figure 4 above, focusing on approach #4 on intersection A. Using script tools, we can automatically access and extract all cross-section event data present at the beginning of the approach.7
What can be extracted?
In just the Intersection-Leg (Approach) category, we can use our Python script library to extract 12 out of approximately 40 MIRE elements in this category that would usually require a manual data collection: For both states in the aforementioned MIS study, many of the elements in Table 3 were evaluated to be manual collections.
Conclusions, Next Steps
| MIRE Element (2.0) |
Value |
| Intersection Identifier for this Approach |
A |
| Unique Approach Identifier |
4 |
| Approach Mode |
1 |
| Approach Directional Flow |
2 |
| Number of Approach Through Lanes |
2 |
| Left-Turn Lane Type |
2 |
| Number of Exclusive Left-Turn Lanes |
1 |
| Right-Turn Channelization |
1 |
| Number of Exclusive Right-Turn Lanes |
0 |
| Length of Exclusive Left-Turn Lanes |
30 |
| Median Type at Intersection |
1 |
| Approach Traffic Control |
1 |
Table 3: Example Results from Automated Extraction of Cross-section LRS Data
DDOT is convinced that the time and effort to collect high-value, ‘core’ roadway inventory data is a much better investment than capturing the MIRE data items individually. Automating the intersection-leg model is easily done (we have referenced the script repository below). An LRS roadway cross section is not an insignificant investment, but one that has the potential to reward your agency many times over. Once collected, we intend to incorporate cross-section events as a standard maintenance item when performing updates to our LRS. This will ensure that items such as the 12 listed above will never need to be individually collected again. Simply refreshing MIRE via scripts is now an achievable objective for DDOT. Out of the 205 MIRE 2.0 elements which are not provided via HPMS, we estimate that we can perform a fully automated extract for approximately 40% of those (81 total) via our Python script library for MIRE. (Note: This project is ongoing and this estimate is preliminary.)
One of the more exciting future possibilities relates to what more we could do with our roadway cross-section data. Once the MIRE Python automation scripts are complete, we hope to create additional Python scripts which can extract a routable network from our LRS. The elusive ‘hard-to-get’ piece has historically been turning movements at intersections. Our LRS roadway cross-section data types contain the full array of turn lane types; after linking with our relational intersection-leg model, we believe we can use the lane type as a initial proxy to automatically generate a turning movements table for every intersection leg in the network.
References
- HPMS State Panel Discussion, Highway Information Seminar, (2017)
- MIRE, Version 1.0, (2011) Page 1
- MIRE, Version 2.0, (2018)
- Background Report Guidance for Roadway Safety Data to Support the Highway Safety Improvement Program, (2011)
- MIRE MIS Lead Agency Data Collection Report, (2013)
- DDOT Roads and Highways Tools Repository, (2018)
- Intersection Manager, Transcend Spatial Solutions, Inc (2018)
- Cross-section LRS Data, DDOT GIS Wiki, (2018; link updated October 2022)
Bird’s-eye Views to Birding: Pairing Remote Collaboration with Field Work to Design Better Tools
Editorial by Anders Kosnett, Operations Research Analyst at the Volpe National Transportation Systems Center
The US Fish and Wildlife Service (FWS) exists to preserve the nature of America, entrusted with the dual mandates of managing and restoring wild places and of ensuring public access to them. In partnership with the Federal Highway Administration, the Service regularly inventories and maps the extent and condition of all of the roads and parking areas in the National Wildlife Refuge System and National Fish Hatchery System, the better to enable visitation and conservation.
This process, the Road Inventory Program, occurs in two phases: FWS-led webinars held by regional transportation coordinators with station staff to update maps and inventories, followed by FHWA field assessments to confirm data and record physical conditions. With our FWS partners, we developed an ESRI web map app that allows station staff to collaborate with regional transportation coordinators to draw or modify roads and parking areas, as well as produce a CSV of updates for FWS and FHWA databases. Similarly to Google Docs, changes made by one user in the web map appear for others in real time, and its interface is simple enough that non-specialists can at least sketch in assets for others to refine afterward. We usually speak in real time over a conference line, but non-specialist field staff have managed to input data in advance of meetings. Granted, the ESRI web tools are simpler than desktop apps, but we anticipate richer tools that enable generalists, technicians, and volunteers to collaborate to maintain these and other public infrastructure.
As sophisticated as our GIS toolset has become, there’s still no substitute for getting out there. The best moments occur when we can step through the screen to visit Refuges, Hatcheries, and personnel in person. Trading screens for binoculars to watch eagles and sandhill cranes while touring the very roads and trails that we document provides better context for the Road Inventory Program, and a deeper appreciation for the Mission of the FWS overall. Conservation allows and depends on dynamic changes; we should aspire to the same in the furthering it.
Other News
Upcoming Events
CMM Workshop at GIS-T
At the upcoming GIS-T symposium in Little Rock, AR, Ian Kidner will be leading a workshop on a new Capability Maturity Model assessment specifically designed for State DOTs. To partcipate in this workshop, please register for GIS-T. For information on registration, please visit: https://gis-t.transportation.org/.
Peer Exchange on GIS for Maintenance Purposes
Pennsylvania DOT will host a Peer Exchange on April 10th and 11th of this year. The purpose of the peer exchange is three-fold: to review the current state-of-practice in GIS-use for maintenance activities across transportation agencies; identify common challenges, opportunities, and best practices from each peer; and to engage in hands-on review of the current GIS maintenance tracking process in place at PennDOT.
New Report Available
A report summarizing a peer exchange is now available. This peer exchange was hosted in September 2017 and focused on participant States’ experience using Capability Maturity Models (CMM), what their respective agencies would gain by completing a CMM, and developing a new draft CMM for State DOT use. It’s available here along with our other reports: https://www.gis.fhwa.dot.gov/reports.aspx.
Coming Soon
Case Study Report on a new CMM assessment for State DOTs
In our last newsletter, we announced that we were piloting a Capability Maturity Model assessment designed specifically for State DOTs among a select group of participants. The results of the case study will be available soon. The case study will be posted on this page along with all of our previous case study reports: https://www.gis.fhwa.dot.gov/reports.aspx.
Webinar Summary
Ian Kidner from Ohio DOT recently presented at FHWA’s GIS in Transportation webcast series. The topic of the presentation was “Data Integration Through Data Management,” and detailed Ohio DOT’s internal Data Review project. FHWA is working on a webinar summary and will make it available here: https://www.gis.fhwa.dot.gov/webinars.aspx.
For more information about this newsletter, please contact Mark Sarmiento, FHWA Office of Planning, at Mark.Sarmiento@dot.gov.
The contents of this publication reflect the views of the authors, who are responsible for the facts and accuracy of the data presented herein. The contents do not necessarily reflect the official policy of the Department of Transportation. This publication does not constitute a standard, specification, or regulation.

