SUMMER 2011
A Newsletter from the Federal Highway Administration (FHWA)
www.gis.fhwa.dot.gov
A Look at the New Jersey Department of Transportation's (NJDOT) Traffic Monitoring System
This edition's Q&A is with Chris Zajac (Principal Engineer, Planning), of NJDOT, Bud Luo, Ph.D. (Project Manager), and James Yeager, P.E. , PTP (Project Manager), both of Michael Baker Jr., Inc. (Baker). They discuss developing a traffic monitoring system, which helps NJDOT and system users to monitor and manage traffic conditions.
Upcoming Events
- GIS in Public Transportation Conference
St. Petersburg, FL
September 13-15, 2011
- National States Geographic Information Council's Annual Conference
Boise, ID
September 26-29, 2011
Q. What is the history of the application?
NJDOT's Traffic Monitoring System (TMS) program has collected traffic count information for decades. Using a set of permanent and short term traffic count stations, NJDOT annually produces a large amount of traffic volume data to support multiple Federally mandated programs. These collected data are made available to the general public via the Internet.
In 1998, NJDOT developed a public website to publish data as annual and monthly reports. However, the approach used to update data was very cumbersome, and the public website was difficult to navigate. As a result, many users elected to either call or email NJDOT with questions or to request information. Responding to these requests was time consuming, inefficient, and placed resource strains on NJDOT staff.
In 2004, NJDOT engaged Baker to provide a technical solution for publishing and distributing traffic count reports. After conducting an in-depth analysis, Baker implemented an ESRI ArcIMS-based solution that NJDOT hosted.
In 2009, NJDOT replaced the solution with an open source-based web 2.0 technology stack to make publication of the reports easier and more intuitive. With this technology, users can now more quickly and easily find traffic reports to meet their needs and address areas of interest.
NJDOT's Bureau of Transportation Data Development (BTDD) initiated the TMS website effort. BTDD and Baker staff collaborated on the system's design and implementation.
Q. How was the application developed?
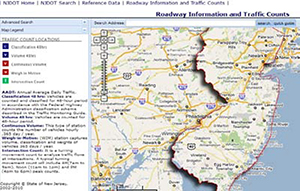 Figure 1. TMS mapping interface.
When the project started in 2004, the NJDOT information technology (IT) department's geospatial technology stack was solely based on ESRI's ArcIMS platform. It was a shared environment that hosted multiple applications from different projects and used a variety of licensed software. The first TMS web application was implemented based on this existing infrastructure. However, increasing public demand stressed the aging IT infrastructure and resulted in decreasing performance.
With the proliferation of open Internet mapping engines (e.g., Google Map, Bing Map), NJDOT and Baker agreed to a new design that took advantage of these technologies to achieve the goals of low cost, good scalability, and platform and infrastructure independence. The new solution can be hosted on many commercial internet service providers, including cloud services, and has a user-friendly interface.
Spatial and attribute data are stored in PostgreSQL although Oracle, MSFT SQL Server, MySQL can also be supported.
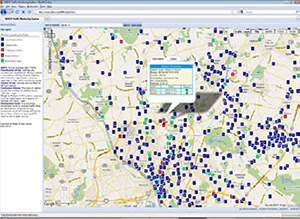 Figure 2. Map interface with simple query pop-up window.
Q. How do people use the application?
Users can access the TMS web application at www.njtms.org/njdot/tms/index.jsp (link no longer valid).
Once on the site, users are presented with an interface similar to Google or Bing Map sites. The interface features an address bar on top of a Google basemap.
Traffic monitoring stations are represented by different symbols, distinguished on the basis of the type of traffic count they provide. The symbols are defined in a legend and a description tab on the left-hand side of the map. Users can access information and reports in two different ways:
First, users can type in a location of interest by entering a street address or by entering a pair of geographic coordinates in the address bar.
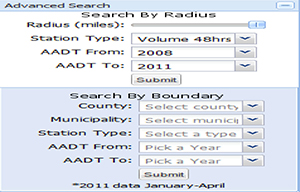 Figure 3. Advanced search tab window.
When a search is entered into the address bar, the map immediately zooms to that location, showing available traffic monitoring stations. The map also displays a “draggable” icon. By dragging and dropping the icon on a station symbol, a user can access a pop-up window containing more detailed information.
Typically, users who conduct this type of search are the general public, real-estate developers, outdoor advertising agencies, engineering firms, and county and municipal planners interested in traffic patterns at a specific location.
Second, users can view information is by accessing the advanced query tab on the left-hand side of the map. Users can perform advanced spatial queries by radius, station type, administrative boundary, and date of count collection. Results from this type of query are presented in a tabular format with hyperlinks to more information.
Users who conduct this type of search are typically professional NJDOT staff (e.g., planning, project development, and maintenance staff) who want highly detailed traffic count information.
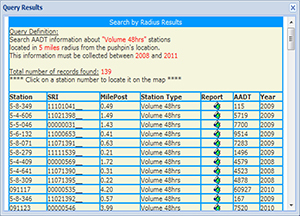 Figure 4. Advanced query result in tabular format.
Q. What were the factors contributing to development of the application?
When the TMS website was designed, NJDOT's main concern was ensuring ease of use, cost reduction over time, and scalability for implementing additional data type and functional support in the future.
While ease of use can be achieved with a thoughtful architecture design, it was more difficult to realize cost reductions over time and scalability given the existing State IT environment.
The new TMS solution includes the ability to host applications using a flexible cloud infrastructure. This infrastructure is cost effective and supports use of public web mapping solutions and open source databases.
Q. Where did NJDOT obtain data for the traffic monitoring system?
BTDD provides data for the TMS website. BTDD gathers traffic counts from multiple sources throughout NJDOT. Data files are processed and loaded into a central shared database repository that feeds quarterly updates to the application.
Q. How is the application funded?
NJDOT's TMS activities are funded through FHWA's State Planning Research program.
Q. What have been some signs of success?
Since the site was launched, requests from the general public about traffic counts information and received through traditional means have decreased more than 90 percent. This has amounted to savings equivalent to the labor hours of one full-time staff member.
NJDOT's IT department monitors hits on hosted application sites as well as externally hosted NJDOT application sites linked through NJDOT's main website page.
The IT monitoring system has ranked the TMS application within the top 10 most popular sites on NJDOT's website.
Q. What are some anticipated future plans for the application?
The application continues to be successful. Given interests within NJDOT, it is likely that staff will work with data stakeholders within the department to publish their information on the same platform. Even given the addition of new data sets and new data types, this can be done without decreasing the application's performance and responsiveness.
A charting module showing weigh in motion monthly classification count is now being added the application. Users will be able to view monthly changes to the traffic patterns by vehicle class.
Additionally, staff members are considering a migration to Amazon Elastic Cloud Compute (EC2), a cloud infrastructure solution, to further reduce cost and improve scalability and reliability.
Q. What have been some critical success factors?
Critical success factors for the TMS website have included the following:
Be solution focused instead of technology bound. Applications should provide a solution to a pertinent problem. In NJDOT's case, staff had difficulty identifying a good approach for providing users with access to traffic count information. As a public-facing website, the application can now easily disseminate state traffic data to a broader audience and allow NJDOT BTDD staff to focus their time on other tasks. The application is nimble, integrating multiple databases and deployable in different IT environments regardless of their infrastructure.
Solve problems with measurable and visual results. The TMS application has resulted in significant time-savings for BTDD staff. As a result, the application has increased productivity and helped support customer satisfaction. The website's popularity within NJDOT continues to increase.
Keep it simple. TMS application is a simple technology with a low ownership cost. No annual licensing or upgrading fees are required since it was built using open source technology.
For more information, please contact:
Chris Zajac – Chris.Zajac@dot.state.nj.us
Bud Luo – yluo@mbakercorp.com
James Yeager – Jyeager@mbakercorp.com
How Enterprise-Wide Asset Management Helped Allegheny County Improve its Transportation Network
Editorial from Craig Schorling, Transmap Corporation
Budgeting and documenting rehabilitation projects are difficult tasks for most counties and cities across the country. Allegheny County, Pennsylvania, successfully implemented a GIS-based, enterprise-wide asset management solution to address budgeting and rehabilitation.
Allegheny County is responsible for maintaining nearly 400 miles of roadway that serve approximately 1.2 million people living in the Pittsburgh metropolitan area. With support from the information services group, the county's engineering department created a GIS-based asset management system (AMS) to improve the county's transportation network and manage ongoing maintenance.
The overall goal of the AMS project was to build a system that could help the county improve the overall performance of its street network with a limited budget.
The AMS uses ESRI's ArcGIS software. Road centerlines form the geographic reference frame. These centerlines are divided into 10 networks, each representing a different class of roadway. Asset and pavement condition data are integrated into these networks.
Planning and implementing paving projects require network level pavement surveys available in the AMS. Allegheny County uses these surveys to objectively prioritize repairs and allocate financial resources based on the condition of each roadway.
County personnel use the AMS to support:
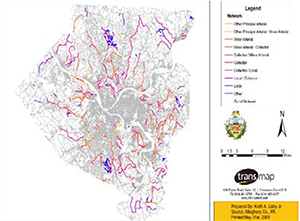 Allegheny County pavement network.
- Pavement condition surveys:
The AMS is used to plan a mobile pavement condition survey that utilizes a mobile mapping system provided by Transmap Corporation of Columbus, OH.
- Pavement condition analysis:
AMS MicroPaver is used to analyze pavement data and compute condition indices for samples collected in the field. Because MicroPaver integrates with GIS, technicians can visualize the condition of the network and its interaction with street centerlines to support development of rehabilitation strategies.
- Planning rehabilitation:
AMS network maps show road conditions in different colors. Staff use these maps to help plan resurfacing projects and select the type of work and budget needed to achieve optimum improvement.
- Budget justification:
Staff members use the AMS pavement condition maps to justify a budget and ensure that county funds are utilized in the most effective way.
The AMS project was internally funded using operating funds. While developing the AMS involved high upfront costs, the county believes that the investment was justified as it has allowed engineers to more reliably identify streets that need improvement and it has supported overall staff decision-making about the road network.
Allegheny County plans to re-inspect its road network every three years. For projects that require rebuilding sections of roadways, the county will supplement condition data in the AMS with project-level surveys, including ground penetrating radar and falling weight deflection testing. These efforts are also tied to the street network and can be tracked in ArcGIS.
The GIS-based AMS has been successful because it has allowed Allegheny County to accomplish more with a smaller budget. As a result of using the AMS, the overall level of service on the county's road network has significantly improved, resulting in fewer complaints and a higher degree of satisfaction among the traveling public.
For more information, contact Craig Schorling at:
cschorling71@gmail.com
614-481-6799 ext.14
Other News
Website Update
FHWA has updated the GIS in Transportation website at www.gis.fhwa.dot.gov. The new website offers information on GIS events, industry news, and innovative GIS applications from around the country, as well as the FHWA GIS in Transportation quarterly webcasts and newsletters.
Reports
FHWA produces reports on uses of GIS tools and applications to support transportation decision-making. Most recently, FHWA released Applications of GIS for Livability in March 2011. The report summarizes the results of a study conducted to assess how GIS applications are being used to identify, evaluate, and assess livability issues from a transportation point of view.
This report and others are available at www.gis.fhwa.dot.gov. Please visit the site to learn more or to submit information about your agency's transportation GIS applications.
For More Information
For more information about this newsletter, please contact Mark Sarmiento, FHWA Office of Planning, at mark.sarmiento@dot.gov.