WINTER 2015-2016
A Newsletter from the Federal Highway Administration (FHWA)
www.gis.fhwa.dot.gov
Vermont Agency of Transportation (VTrans): Using ROIs to Implement GIS Technologies
This month's Q&A is with the Vermont Agency of Transportation (VTrans). They discuss the utilization of a new GIS software and its validation through a Return on Investment (ROI) study.
Upcoming Events
- Transportation Research Board Annual Meeting
January 10-14, 2016
Washington, DC
- AASHTO GIS for Transportation Symposium
April 4-7, 2016
Raleigh, NC
What transportation-related mapping and data needs existed at your agency? What approach was taken to address these needs?
While modern technology is widely utilized in transportation work today, modernization of data remains a challenge. A transportation agency's investment in data collection and data management tools has to compete with other critical funding needs, such as roadway and bridge construction, operations, and maintenance funds. A Return on Investment (ROI) study can serve to explore use cases, feasibility, benefits, costs, and other relevant information for making an informed investment decision.
The leadership at the Vermont Agency of Transportation (VTrans) champions technology, but they do so with careful scrutiny. As part of a push to modernize our geospatial technological capabilities, the VTrans project team approached their leadership to approve a new statewide Geographic Information System (GIS) parcel mapping project. GIS Parcel data is versatile because it benefits nearly all state agencies, along with the private sector and the public. Subsequently, the project team was asked to first develop an ROI, as well as a data maintenance strategy.
With so many stakeholders it was important to fully understand the intricacies of implementation and the complexity of maintaining the resulting data into the future. VTrans worked closely with the VT Statewide Parcel Mapping Workgroup and hired a consultant to develop a methodology to estimate the ROI. The consultant produced a detailed report that has served as a consistent and authoritative tool for communication with leadership across agencies. This report can also function as a template for future ROI studies.
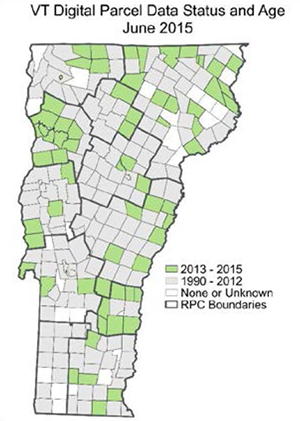 Figure 1. VTrans' GIS State Parcel Map
What are the key ways that your approach, or an ROI in general, is used?
An ROI analysis allows transportation agencies to:
- Quantify costs
- Identify benefits
- Identify use cases by working with stakeholders across agencies, the private sector, research institutions, and municipality officials
- Present findings in a clear format to decision makers
- Serve as a tool for collaboration between agencies on development of the application
- Determine a time frame
- Articulate and formalize project objectives and align project priorities with stakeholders.
Why did VTrans choose to conduct an ROI analysis before investing in the GIS data initiative?
Before investing in the development of parcel mapping, VTrans executive leadership, in consultation with the VTrans IT Governance Committee, requested an ROI analysis on the use of GIS for parcel mapping. The IT Governance Committee is comprised of the Agency Directors, with key IT staff who review IT related projects. The intent of this request was to ensure that the proper approach had been thought through and that a maintenance strategy was defined to keep the data current.
Who initiated the application of the geospatial technology and project evaluation to meet transportation needs? Who brought it to completion?
The ROI study was approved by VTrans' Deputy Secretary. The project team hired a contractor, Applied Geographics Inc., to execute the study. VTrans recognized that the scale of a statewide parcel data project required input from other agencies for it to be sustainable in the future.
How does the project team use the ROI study to meet geospatial data needs? Who else currently uses this analysis?
The project team uses the report for planning purposes and communication to stakeholders. In addition to VTrans, the project team is composed of the Vermont Center for Geographic Information, the Vermont Agency of Commerce and Community Development, and the Enterprise GIS Consortium (EGC) Statewide Parcel Data Workgroup.
ROI METHODOLOGY AND ANALYSIS
What data did you collect to prepare the ROI analysis?
Information was initially compiled based on a review of what other states had done to date. With the understanding that each state has its own unique challenges managing parcel data, an in-depth analysis on Vermont parcel data was implemented. This analysis was an inclusive and collaborative effort that consisted of the following components:
- A survey distributed through all relevant communication streams to answer critical questions about how users currently access parcel data, how long it takes, and what the uses are (140 participants).
- Three workshops were held across the state where these questions, along with alternative programmatic approaches for implementation of the project, were explored more thoroughly (57 participants).
- Finally, individual interviews held with key users helped flesh out the last details.
The total number of participants in the full process was about 200. Participants were affiliated with the following general groups:
- Cities/Towns (Listers, Assessors, Public Works, GIS Techs, Planners)
- Regional Planning Commissions
- State Agencies (VTrans, Agency of Commerce and Community Development (ACCD), Agency of Natural Resources (ANR), Dept. of Tax)
- Non-Profits and Research/Academic Institutions
- Private Sector (GIS services, consulting foresters, land surveyors, real estate)
How did you use this data to calculate an ROI?
Once costs and benefits were identified, the responses were enumerated and Net Present Value (NPV) and ROI were calculated. NPV is the difference between the present value of benefits and the present value of costs.
NPV = ∑[(Bt-Ct) / (1 + r)t]
where Discount Rate = r = .4%,
(1+r) = 1.0040,
t = time in years = {0,1,2,3,4}
The ROI Calculation uses the results of the NPV calculations as inputs, the ROI formula is:
(Discounted Benefits - Discounted Costs) / Discounted Costs
The result was an ROI ratio that ranging from a very conservative 1.58 to 4.55 for the recommended program (anything above zero means the return will be higher than the investment). The ROI has helped build support for developing a statewide parcel dataset, and the first Phase of the project is expected to begin in 2016.
How did you fund the ROI analysis and study? Did you use any Federal funding? If so, describe?
A one-time cost was incurred for the ROI, and it was supported by our FHWA representative with an 80% investment from federal funds. FHWA also agreed to fund 80% of the development phase of a statewide parcel dataset.
LESSONS LEARNED AND NEXT STEPS
How has the use of an ROI analysis met the transportation, financial, and/or technical needs of your agency?
At a time where financial planning is imperative for managing resources, the project has allowed VTrans to identify realistic costs. The ROI provided several alternative approaches, which gave VTrans and the Parcel Mapping Workgroup discussion items that allowed for the development of the overall project and the ability for better decision-making.
Are there future plans to change or modify this evaluation approach? If so, how and why?
The findings from the ROI analysis and subsequent reports have been through several iterations, accounting for new findings in each case. The final reports, as well as other supporting documentation are available on the VT EGC website: https://vcgi.vermont.gov/document/egc-geospatial-data-exchange-protocol
What have been the critical success factors or lessons learned while applying the application/geospatial technologies to meet transportation needs?
A collaborative approach between agencies, customers, and stakeholders can produce a more robust product. One issue with this approach, however, is that it can also be significantly more time consuming and therefore require more resources.
When developing contracts for ROI studies, we have identified that it is imperative to clearly list the essential information you are seeking. Some examples include:
- Enumeration of specific costs, including full-time equivalent (FTE) staff
- Cost estimate ranges accounting for risk
- Alternative approaches
- Identification of funding sources
- Recommended funding strategies and likelihood of success
For more information, please contact:
Nina Safavi, Survey & GIS Project Manager
ROW Section, VTrans
Nina.Safavi@state.vt.us
Ryan Cloutier, Plans & Titles Chief
ROW Section, VTrans
Ryan.Cloutier@state.vt.us
Regional Coordination: Creating Connections and a Common Vision with GIS
Editorial from Eric Adolfson, COMPASS
The Community Planning Association of Southwest Idaho (COMPASS) was determined not to let the regional long-range transportation plan sit on a shelf, forgotten, soon after it is adopted. We initiated a process to make the regional plan relevant to local decision-making. This process has led to improved regional coordination.
COMPASS set the stage for this process by engaging hundreds of stakeholders to develop a land use vision that is the basis for the regional plan. The vision, created using a GIS-based analysis tool called CV, is backed by an extensive inventory of regional data and is aligned with local plans.
At the same time, COMPASS began developing a regional data center which is a virtual set of servers using ESRI's ArcGIS server completely existing on Amazon Web Services (i.e. in the cloud), where regional partners automatically provide updates to regional datasets through means such as replication synchronization or automated ftp. Updates from each jurisdiction are comprised of their local, authoritative data. This ensures access to accurate and timely information for performance analysis.
Together, these efforts inform a process where COMPASS provides input to local agencies on proposed developments regarding how those developments align with the regional plan. We share that input, the results of performance tracking, and the data behind it, on the COMPASS Performance Dashboard.
COMPASS Planning Area
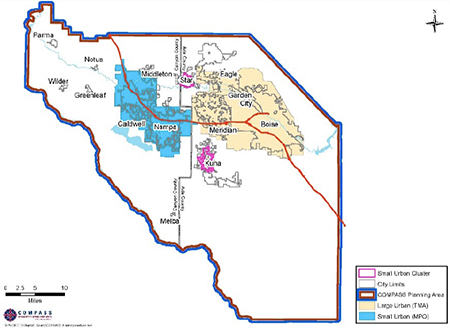 Figure 2. COMPASS GIS Map of Planning Area
The main takeaways:
#1. GIS technology has moved from a support role to a lead role in regional planning. No part of the current plan would be possible without it.
#2. Participation is critical on all levels. For regional coordination to work, partners must commit to the regional planning process, from sharing data, to actively collaborating, to using the regional plan to inform local decision-making.
#3. Technology can't replace the human touch. Data gives us knowledge, but people make the decisions. Relationship building is key to ensure a collaborative and productive decision-making process.
COMPASS is using GIS to help local decision-makers make the connection between their regional plan and local decisions. Connections are being made in ways that can help foster involvement through the life of the plan.
For more information, please contact:
Eric Adolfson
EAdolfson@compassidaho.org
208-855-2558
Eric Adolfson is a Principal Planner for GIS for the Community Planning Association of Southwest Idaho (COMPASS).
Other News
King County GIS Center and Idaho DOT: Making a Business Case for GIS Technologies
Webinar Summary Available
A summary of the most recent GIS in Transportation webinar is now available on the GIS in Transportation website. Greg Babinski of the King County GIS Center in Washington discussed the county's decision to investment in a centralized GIS data management system, and the development of benefit-cost analyses to quantify the value and return on investment (ROI) of that investment. Nicole Hanson of the Idaho Transportation Department (ITD) reviewed some initial findings on the value the agency is getting from its ArcGIS Online (AGOL) solution, IPLAN. This webinar summary and recording are available at: www.gis.fhwa.dot.gov/webinars.aspx
GIS for Transportation Performance Management
Upcoming Peer Exchange and Case Study Reports
FHWA sponsors peer exchanges, in which GIS practitioners gather to share and learn about effective practices, methodologies, and lessons learned about the use of GIS to support transportation decision-making. This summer, FHWA hosted a peer exchange looking at how local and State transportation agencies are using geospatial tools to implement transportation performance management programs or initiatives. FHWA is currently conducting case study interviews to develop a companion report to the peer exchange summary. Both reports will be available this winter at www.gis.fhwa.dot.gov/reports.aspx.
Making a Business Case for GIS
Upcoming Case Study Report
Last spring, FHWA held a peer exchange on how transportation agencies are making the business case for GIS applications or geospatial tools. A case study report based on the peer exchange discussion and case study interviews, will be released this winter at www.gis.fhwa.dot.gov/reports.aspx.
For more information about this newsletter, please contact Mark Sarmiento, FHWA Office of Planning, at Mark.Sarmiento@dot.gov.