Making a Business Case for Geographic Information System (GIS) Technologies
Case Studies of Select Transportation Agencies
July 2015
DOT-VNTSC-FHWA-15-17
Prepared for:
Office of Planning
Federal Highway Administration
U.S. Department of Transportation
Notice
This document is disseminated under the sponsorship of the Department of Transportation in the interest of information exchange. The United States Government assumes no liability for the contents or use thereof.
The United States Government does not endorse products or manufacturers. Trade or manufacturers’ names appear herein solely because they are considered essential to the objective of this report.
| REPORT DOCUMENTATION PAGE |
Form Approved
OMB No. 0704-0188 |
| Public reporting burden for this collection of information is estimated to average 1 hour per response, including the time for reviewing instructions, searching existing data sources, gathering and maintaining the data needed, and completing and reviewing the collection of information. Send comments regarding this burden estimate or any other aspect of this collection of information, including suggestions for reducing this burden, to Washington Headquarters Services, Directorate for Information Operations and Reports, 1215 Jefferson Davis Highway, Suite 1204, Arlington, VA 22202-4302, and to the Office of Management and Budget, Paperwork Reduction Project (0704-0188), Washington, DC 20503. |
| 1. AGENCY USE ONLY (Leave blank) |
2. REPORT DATE
July 2015 |
3. REPORT TYPE AND DATES COVERED
Final |
4. TITLE AND SUBTITLE
Making a Business Case for Geographic Information Systems (GIS) Technologies |
5a. FUNDING NUMBERS |
6. AUTHOR(S)
Kate Macfarlane, Ben Cotton, Alisa Fine |
5b. CONTRACT NUMBER |
7. PERFORMING ORGANIZATION NAME(S) AND ADDRESS(ES)
U.S. Department of Transportation
John A Volpe National Transportation Systems Center
55 Broadway
Cambridge, MA 02142-1093
|
8. PERFORMING ORGANIZATION REPORT NUMBER
DOT-VNTSC-FHWA-15-17 |
9. SPONSORING/MONITORING AGENCY NAME(S) AND ADDRESS(ES)
U.S. Department of Transportation
Federal Highway Administration
1200 New Jersey Avenue, SE
Washington, DC 20590
|
10. SPONSORING/MONITORING AGENCY REPORT NUMBER
|
| 11. SUPPLEMENTARY NOTES |
12a. DISTRIBUTION/AVAILABILITY STATEMENT
This document is available to the public through the National Technical Information Service, Springfield, VA 22161. |
12b. DISTRIBUTION CODE |
13. ABSTRACT (Maximum 200 words)
To explore how transportation agencies are making a business case for GIS investments, the Federal Highway Administration and Volpe National Transportation Systems Center interviewed five State DOTs that have made business cases for GIS investments:
- North Carolina Department of Transportation
- Vermont Agency of Transportation
- Utah Department of Transportation
- Florida Department of Transportation
- Oklahoma Department of Transportation
Volpe developed case studies for each agency. As a follow-up to the case studies, FHWA sponsored a peer exchange in Oklahoma City, Oklahoma on March 24-25, 2015. This allowed case study participants to discuss their experiences in greater detail.
This report supports GIS practitioners and decision-makers in identifying examples of noteworthy practices, considers the advantages and disadvantages of different approaches in making a business case for GIS, and determines how both quantitative and qualitative analyses of the costs and benefits of GIS investments can best support agency business practices.
|
14. SUBJECT TERMS
Geographic information systems (GIS), GIS investments, return on investment (ROI), business case, cost-benefit analysis, GIS projects. |
15. NUMBER OF PAGES
47 |
| 16. PRICE CODE |
17. SECURITY CLASSIFICATION OF REPORT
Unclassified |
18. SECURITY CLASSIFICATION OF THIS PAGE
Unclassified |
19. SECURITY CLASSIFICATION OF ABSTRACT
Unclassified |
20. LIMITATION OF ABSTRACT
Unlimited |
Standard Form 298 (Rev. 2-89)
Prescribed by ANSI Std. 239-18
298-102
Acknowledgments
The U.S. Department of Transportation John A. Volpe National Transportation Systems Center (Volpe) in Cambridge, Massachusetts prepared this report for the Federal Highway Administration's (FHWA) Office of Planning. The project team included Kate Macfarlane and Alisa Fine of Volpe's Organizational Performance Division and Ben Cotton of Volpe's Transportation Planning Division. The Volpe project team wishes to thank staff members from several organizations nationwide, listed in Appendix A, for providing their experiences, insights, and editorial review. The time they kindly provided was vital to preparing the case studies and reviewing this final report.
Table of Contents
List of Tables
Executive Summary
In an era of fiscal constraint and declining transportation revenues,1 geographic information systems (GIS) business units at State departments of transportation (DOTs) and other transportation agencies are increasingly asked to make a business case for GIS investments by demonstrating how benefits outweigh costs. While GIS practitioners at transportation agencies generally recognize the merits of preparing a business case for GIS investments, it can be difficult to develop an appropriate methodology that comprehensively captures the benefits and costs.
To explore how transportation agencies are making a business case for GIS investments, the Federal Highway Administration (FHWA) and United States Department of Transportation Volpe National Transportation Systems Center (Volpe) interviewed five State DOTs that have made business cases for GIS investments:
- North Carolina DOT (NCDOT)
- Vermont Agency of Transportation (VTrans)
- Utah DOT (UDOT)
- Florida DOT (FDOT)
- Oklahoma DOT (ODOT)
Volpe developed case studies for each agency. As a follow-up to the case studies, FHWA sponsored a peer exchange in Oklahoma City, Oklahoma on March 24-25, 2015. This allowed case study participants to discuss their experiences in greater detail.
This supports GIS practitioners and decision-makers in identifying examples of noteworthy practices, considers the advantages and disadvantages of different approaches in making a business case for GIS, and determines how both quantitative and qualitative analyses of the costs and benefits of GIS investments can best support agency business practices. Highlights of the findings presented here include:
- Agencies analyzing the benefits and costs of GIS projects are motivated by a variety of reasons.
- Peer agencies use diverse methodologies to make a business case for GIS.
- Peer agencies suggest including quantitative and qualitative descriptions of benefits; targeting the content of the business case to the intended audience, and working with GIS application end users to better understand the impacts of GIS investments.
- Increasingly, agency leadership and elected officials want to see evidence that a proposed project will generate a positive return on investment before committing funds.
Return to Top
1. Introduction
1.1 Purpose and Methodology
The Federal Highway Administration (FHWA) promotes geographic information systems (GIS) as a technology that can help transportation agencies save time, improve transportation decision-making, and improve outcomes related to safety, congestion, and sustainability. GIS investments can also lead to cost savings by reducing transportation project delivery timelines which result in dollar savings for transportation agencies. GIS applications help agencies monitor and address congestion, resulting in increased economic productivity for the general public.
This effort was part of FHWA's GIS in Transportation program.2 Through technical support, resources, and capacity-building opportunities, the program aims to assist transportation agencies by effectively using GIS and geospatial applications.
Previous peer exchanges sponsored by FHWA's GIS in Transportation program focused on various applications of GIS to transportation. For example, participants examined geospatial data-sharing or uses of cloud-based GIS applications. Throughout these peer exchanges, many participants noted challenges in quantifying, cataloging, and monetizing the benefits of GIS projects, even when an agency can easily recognize these benefits on an anecdotal basis.
Additionally, declining transportation revenues pressures GIS practitioners at transportation agencies to make a business case for GIS investments by demonstrating how benefits outweigh costs.3 While GIS practitioners at State departments of transportation (DOTs) and other transportation agencies generally recognize the merits of preparing a business case for GIS investments, it can be difficult to develop an appropriate methodology that comprehensively captures the benefits and costs.
To explore how State DOTs are assessing the costs and benefits of GIS projects, particularly from a quantitative perspective, the FHWA and United States DOT (U.S. DOT) Volpe National Transportation Systems Center (Volpe) interviewed specific State DOTs and developed a series of case studies focusing on their experiences. As a follow-up to the case studies, FHWA sponsored a peer exchange in Oklahoma City, Oklahoma, on March 24-25, 2015, which convened case study participants to discuss their experiences in greater detail. The case studies were then refined based on discussions held during the peer exchange and feedback received from participants. The case studies and peer exchange gave transportation agencies the opportunity to:
- Identify the state of the practice in how transportation agencies are making a business case for GIS investments;
- Share related experiences, including technical approaches and innovative examples;
- Discuss benefits, challenges, success factors, and lessons learned; and
- Identify potential opportunities to improve the efficiency or quality of efforts to make a business case for GIS investments.
FHWA and Volpe selected transportation agencies for participation based on a review of online materials and responses to an email solicitation on the American Association of State Highway and Transportation Officials' (AASHTO) GIS in Transportation Yahoo! Forum. Participating agencies included North Carolina Department of Transportation (NCDOT), Vermont Agency of Transportation (VTrans), Utah Department of Transportation (UDOT), Florida Department of Transportation (FDOT), and Oklahoma Department of Transportation (ODOT). Appendix A includes a complete list of participants. An interview guide, included as Appendix B, provides a framework for the telephone discussions, which lasted 60 to 90 minutes. Case studies were drafted based on participant responses during these discussions.
ODOT hosted the peer exchange at its offices in Oklahoma City. During the peer exchange, participating agencies demonstrated how they have made business cases for GIS projects using return on investment (ROI) analyses or other quantitative methods. Three roundtable discussions provided opportunities for dialogue. Appendix C provides a peer exchange agenda and the questions discussed during the roundtables. Findings from the roundtable discussions and the case studies are included in the Observations section of this report.
1.2 Components of a Business Case
A business case justifies a proposed project based on an evaluation of its benefits and costs. It typically includes a quantitative analysis of how a project will impact the bottom line and a quantitative description that summarizes why a project should move forward. For the purposes of this report, the term business case is used to refer broadly to an evaluation of a project's benefits and costs, regardless of whether the evaluation is forward-looking or backward-looking.
Quantitative Analysis
A business case evaluates a project's costs and benefits by using one or more types of quantitative economic analysis.4 Two analyses that can be used to justify the economic benefits of a project include:
- Return on Investment (ROI)
- Benefit-Cost Analysis (BCA)
ROI is a specific financial and quantitative metric used to compare the costs of an investment with its anticipated gains. ROI is calculated using the equation:
| ROI = |
Gains from investment — Cost of investment
Cost of investment
|
A positive ROI indicates that a project will generate more benefits than costs (i.e., profit), while a negative ROI shows that a project will lose money. For example, a ROI of 1.0 indicates that a project's benefits are estimated to be twice as high as its costs over the specified time period. Although ROI is most frequently used by investors to compare their expected financial gain from potential investments, public transportation agencies use the ROI equation to estimate anticipated savings from a project.
BCA (also sometimes called cost-benefit analysis) is similar to ROI in that it also compares a project's costs to its expected benefits. However, BCA includes a wider scope of benefits than ROI because BCA summarizes net cost or benefit to society, while ROI typically only includes financial costs and benefits within an organization.
To illustrate the distinctions between BCA and ROI, consider the theoretical case of a transportation agency thinking of developing a mobile application with geospatial information about road closures and weather alerts.
- A ROI for the project would consider the internal costs and benefits to the transportation agency. The ROI answers two questions: 1) How much will the application cost to develop and maintain? and 2) How much will it decrease costs (or increase revenue) within the agency? One example of internal cost savings could be reduced staff time spent responding to public requests. If the agency plans to charge a subscription fee to access the application, any revenues deriving from this fee would be included in the ROI.
- A BCA would consider project's broader costs and benefits to society. This includes all the information in the ROI about agency costs and benefits, but it goes further to estimate a broader set of costs and benefits to the general public. For example, the BCA might include projected cost savings from reduced accidents and time savings to members of the public from reduced congestion.
It is entirely possible for the ROI to show a negative return, while BCA indicates a net positive benefit to society. This means the application's benefit to the general public exceeds its costs, but the transportation agency would lose money by developing the application. In the business world, a company would not likely pursue a project with a negative ROI even if the project had a high net benefit to society. Most transportation projects, however, fall into this category. Transportation agencies improve roads and build bridges because of the net benefit to society, not because of any financial gains for the agency.
The case studies in this report feature agencies that used business cases to evaluate the benefits of GIS tools or projects and communicate those benefits to decision-makers. In most instances, agencies used ROI analysis as part of their business cases. Although several agencies incorporated quantitative or qualitative information about benefits external to the agency, no agencies included in this report conducted a formal BCA to make a business case for a GIS application (however; information about BCA is included below to help illustrate the distinction between ROI and BCA).
Qualitative Analysis
In addition to a quantitative analysis of the benefits of different types of investments, a business case typically includes qualitative information that describes a particular project's potential or observed impacts. This qualitative information can include a narrative overview of the project's context or outcomes, descriptions of specific process changes, anecdotes, quotes from the project's end users, or other descriptions of benefits.
All of the peer agencies in this report included qualitative information in their business cases.
1.3 Motivations for Making a Business Case for GIS Investments
Like any organization, transportation agencies can use a business case to understand if a particular project will be (or has been) a good investment. Several recent trends have driven interest at transportation agencies in making business cases for GIS:
- Declining budgets. In an era of fiscal constraint at all levels of government, transportation agencies must stretch their budgets to make the most out of limited dollars. For State DOTs, GIS investments must compete for limited funding with many other types of investments (e.g., infrastructure). Some GIS investments, such as an application that helps a State DOT and others identify potential environmental impacts of a proposed transportation project, may not provide immediate and tangible results to the public in the same way as other types of projects like building a bridge. Thus, State DOTs and other transportation agencies need to justify how GIS investments serve the agency mission and articulate why investing in GIS is a good decision.
- Increasingly sophisticated—and expensive—GIS investments. Not all GIS investments are expensive, but some require large up-front costs. For example, the Moving Ahead for Progress in the 21st Century Act (MAP-21) issued new requirements related to asset and performance management. In response, many State DOTs are implementing very robust GIS solutions to facilitate coordinating across business units within the agency, collecting and sharing data, and improving decision-making. Some of these GIS projects are expensive and require millions of dollars in up-front development costs. At the same time, some GIS applications have increased in complexity and sophistication. These two factors—increasing complexity and increasing cost—have raised the likelihood that agency leadership might request additional information about a project's costs and benefits. Even when decision-makers do not specifically request a business case, GIS practitioners are finding it can help justify their budgets and proposed expenditures to upper management.
As GIS capabilities at transportation agencies mature and GIS continues to play an important, core role in supporting agencies' day-to-day business, the questions that agency leadership pose to GIS practitioners have changed. For example, in the 1990s and early 2000s, when GIS was a relatively new industry and technology, some transportation agencies wrote businesses cases justifying why widespread adoption of GIS would benefit the agency.5 Today, few State transportation agencies appear to question the general benefits of GIS, but are still likely to question the merits of specific GIS investments. As a result, most recent business cases focus on the merits of specific projects, rather than the merits of a GIS program as a whole.
Return to Top
2. Observations
The methods used by the case study agencies to develop their business cases varied based on audience, data availability, and context (see Table 1). Some agencies used a business case to evaluate a potential GIS project before investing (i.e., forward-looking), while others prepared a business case to evaluate the results of a GIS project (i.e., backward-looking). While most peer agencies included a ROI estimate as part of their business case, ODOT used non-monetary quantitative measures to evaluate the success of a GIS project.
Table 1. Summary of Case Study Agencies' Business Cases
| Agency |
Topic of featured
business case(s) |
Forward-looking or backward-looking? |
Type of Quantitative Analysis |
Type of Qualitative Assessment |
Motivation for conducting business case |
| NCDOT |
Road Operations and Management Effort (ROME) |
Forward-looking |
ROI |
Description of contributing factors for ROI analysis |
To gain support for a proposed project; to prioritize future investments |
| VTrans |
Statewide right-of-way (ROW) data modernization |
Forward-looking |
ROI |
Overall description of business case; detailed descriptions of benefits to specific user groups |
To gain support for a proposed project |
| UDOT |
Outdoor Advertising Control Map and ROW GIS layer |
Both |
ROI |
Descriptions of benefits to user group, other groups within UDOT, and the general public |
To prioritize product development; to gain support for a proposed project; to assess outcomes from an investment |
| FDOT |
Efficient Transportation Decision-Making (ETDM) Process and Environmental Screening Tool (EST) |
Backward-looking |
ROI |
Description of benefits to specific user groups; quotes from users about outcomes |
To assess outcomes from an investment |
| ODOT |
OkiePROS Oversize/Overweight Permitting Application |
Backward-looking |
List of quantitative outcomes (Many metrics were not converted into financial value) |
Overall description of benefits; anecdotes to illustrate non-quantified benefits |
To assess outcomes from an investment |
2.1 Motivations for Conducting a Business Case
Peer exchange State DOTs shared a common goal—to justify an investment in GIS by demonstrating that benefits exceeded costs. Within that overarching theme, the case study agencies were motived to conduct a business case by one or more of several reasons:
- To gain support for a proposed project. Several agencies, including VTrans, NCDOT, and UDOT used business cases to articulate the expected benefits of a proposed project to decision-makers and agency leadership in order to obtain funding and support. In some cases, a business case may be explicitly required as a condition for project approval. In the case of NCDOT, State regulations require a ROI analysis showing a positive return for all technological investments made by State agencies.
- To assess outcomes of an investment. ODOT and FDOT sought to evaluate the outcomes or results of a GIS investment after it had already been implemented. In these cases, the business case focused on the product's performance and value to the agency. In ODOT's cases, a funder requested a business case as a follow-up activity to project implementation.
- To prioritize future investments. Business cases can be useful decision-making tools for stakeholders to compare proposed projects and prioritize where limited resources should be spent. For example, both UDOT and NCDOT developed GIS business cases to identify priority GIS projects.
In some cases, GIS practitioners at the case study agencies conducted business cases that fell into several of the areas listed above. For example, NCDOT used business cases to gain support for proposed projects and to prioritize future investments.
2.2 Benefits
Transportation agencies reported a number of benefits related to conducting business cases for GIS projects, particularly in terms of justifying potential projects, building the profile of a GIS program across the agency, understanding project outcomes, and more effective project prioritization.
- Business cases are powerful tools for succinctly communicating the benefits of an investment. Business cases, particularly those that include ROIs or other quantitative assessments, are effective at justifying GIS investments to senior decision-makers who may lack a technical background or be less aware of day-to-day operations. For example, FDOT found that its ROI analysis was an effective tool for demonstrating to agency leadership that a $31 million project cost had been a worthwhile investment. NCDOT used a ROI analysis to convince decision-makers of the need for an improved linear referencing system. VTrans used its detailed ROI assessment to win approval from the State legislature to proceed with a statewide right-of-way (ROW) data modernization project.
- Business cases can help build broad support for a GIS program. Agencies found that business cases could help showcase their GIS capabilities and build broader support for GIS investments across the agency as a whole. For example, UDOT's GIS unit found that ROI analyses allowed staff to effectively articulate the value GIS generates for UDOT, resulting in increased recognition and resources for the GIS program. At ODOT, conducting a business case built the ODOT GIS program's credibility and highlighted the benefits of GIS investments for the entire agency. Where ROI analyses are legally required, as at NCDOT, business cases can help build confidence in a GIS program because State leaders know that all major GIS investments have been justified.
- Business cases can help agencies identify and prioritize projects with the greatest potential return. As requests for GIS services increase at State DOTs, GIS staff may have difficulty managing demand for new products. Business cases provide GIS managers with a tool for prioritizing GIS projects that best serve the agency mission and make wise use of taxpayer dollars. For example, NCDOT's GIS unit uses ROI analyses to prioritize projects with the greatest potential return. UDOT's ROI template will be used by GIS staff, senior leadership, and the Information Technology (IT) Department to inform project prioritization and ensure the GIS unit is serving UDOT's needs.
2.3 Challenges
Agencies noted several challenges associated with developing business cases:
- Developing an appropriate methodology is important but can be difficult. An agency needs to consider an appropriate methodology for making a business case. For ROI analyses, lack of a sound methodology can create results that are not defensible or comparable across projects. The case study agencies also noted the lack of available models and guidance for developing ROI analyses for GIS projects. These agencies also suggested that documentation of industry-standard assumptions and rules-of-thumb for conducting ROIs for GIS transportation projects would be extremely helpful.
- Lack of easily available data can limit feasible analyses. A major challenge for case study agencies is finding or collecting data to support business case analyses, particularly in terms of historic data. Agencies do not typically have programs in place that regularly monitor costs and savings, which might be good sources of historic data. To overcome this challenge, ODOT modified its business case to incorporate the data that were available.
Although some benefits are easily quantifiable, others can be challenging to interpret in quantitative or financial terms. Some benefits, like time savings, are relatively straightforward to quantify. Others—like legal compliance, better quality control, or improved customer satisfaction—are more difficult to convert into a dollar value. Some agencies addressed this challenge by including intangible benefits in their business cases without attempting to quantify the associated dollar value. For example, ODOT used anecdotes to illustrate benefits like improved employee satisfaction and improved decision-making. On its ROI template, UDOT provided space for project managers to describe anticipated qualitative benefits that are not included in the quantitative analysis. To illustrate a broad range of qualitative benefits, FDOT's business case included an appendix with quotes from stakeholders about the project's effects.
For some GIS projects, quantifying benefits that are more intangible may be among the primary motivations for developing a business case. In those cases, transportation agencies must be creative in converting “intangible” benefits into dollar values. For example, NCDOT's Road Operations and Management Effort (ROME) project ensures the State will be able to comply with a new FHWA requirement for its annual Highway Performance Monitory System (HPMS) report. Technically, if NCDOT does not comply, Federal-aid funds totaling approximately one billion dollars could be delayed or withheld, although this scenario is unlikely to occur. When preparing an ROI analysis for the ROME project, NCDOT struggled with how to quantify the financial benefit of legal compliance. Ultimately, NCDOT estimated the cost of complying with HPMS reporting requirements without the ROME project and used that value as a cost avoided in the ROI analysis.
- The full scope of a project's benefits can be difficult to anticipate and capture. GIS projects often generate unexpected benefits that users accrue beyond the initial customer, which can make it difficult to anticipate the true benefits of a project. Some impacts only become apparent over time.
Developing a business case requires time and money. It takes time to document the costs and benefits of a GIS project (however, none of the peer agencies formally estimated the amount of time required to develop a business case). Transportation agency staff face heavy workloads and may not want to take on additional work perceived to be an administrative burden.
Lack of time can also influence the quality of business cases. At agencies where ROI analyses are required for project approval, time pressures may encourage staff to target the business case to meet (but not exceed) administrative requirements. For example, NCDOT is required by State policy to show a positive return on major GIS investments (i.e., the estimated benefit is greater than the cost). Once NCDOT's ROI analysis indicates that benefits exceed costs, the GIS unit typically has no incentive to conduct further formal analysis.
- It is difficult to verify if a project actually resulted in the benefits estimated in the business case. Transportation agencies recognize the importance of comparing actual results to business case estimates. Some agencies—NCDOT, for example—are facing pressure from State elected officials to verify estimated benefits are actually realized. In practice, verifying estimated time and cost savings has been difficult to implement. Accounting systems may not be conducive to tracking results, and lack of staff time or funding can make it difficult to undertake follow-up assessments. For example, although VTrans believes its ROI accurately projected time savings associated with its statewide ROW data modernization effort, the agency has not been able to officially track time and cost savings since the project was implemented. Of the five transportation agencies included in this report, none has a system in place for verifying GIS project benefits over time.
2.4 Lessons Learned
The case study agencies offered the following lessons learned based on their experiences:
Target the methodology and product to fit specific needs. It is important to adjust a business case according to audience, purpose, data availability, and available resources. There is no single “correct” way to conduct a business case. The business cases in this report include a range of methodologies with advantages and disadvantages for each. Some business cases involve extensive use-case interviews that produce lengthy documentation. For example, VTrans needed a polished, authoritative business case that could convince the State legislature to fund a proposed project, so VTrans hired a consultant to prepare a formal ROI report. Although effective, this approach is not feasible for every project; these types of analyses are more expensive and time consuming to produce. Other case study agencies, including NCDOT, UDOT, and FDOT, reported using less formal ROI analyses. In some cases, ROI analysis—in which all benefits are converted to dollar value—may not be necessary to make a compelling quantitative business case. ODOT used “before and after” metrics to paint a clear picture of a GIS project's impact.
Case study agencies also emphasized the importance of targeting the intended audience. This includes focusing on outcomes that are important to the audience. In many cases, the most important outcome may be financial return or cost savings, but other benefits may be important as well. For example, ODOT focused on documenting benefits (e.g., permit processing speed, customer satisfaction, safety, and permit revenue) that were most important to the State legislature, the audience of their business case.
- When developing a business case, look for templates and build on others' efforts where possible. A template provides a starting place for making a business case for a GIS project and reduces the time spent developing analyses. Additionally, templates can facilitate making comparisons between GIS projects. When developing a template, agencies can build on those developed by others. For example, UDOT based its ROI template on a similar one developed by the Utah Department of Natural Resources for GIS projects. Regional or statewide GIS user groups may provide a good source for ROI templates used in a particular region or State.
- Include both quantitative and qualitative information in a business case. In many instances, a business case might need to target multiple audiences; for example, budget office staff and elected officials, or IT professionals and agency leadership. To make a compelling business case to a range of audiences, case study agencies recommended including both quantitative and qualitative information about a project's benefits. ROI calculations can be very effective at succinctly making a business case for a GIS investment, while qualitative descriptions of process improvements or positive externalities can help tell an overall story and provide context for a project. Narrative approaches are particularly effective at illustrating benefits that are harder to quantify, such as legal compliance or improved customer satisfaction.
- Ask stakeholders that benefit from the project to help develop a business case. GIS staff at case study agencies noted they frequently develop tools, maps, and applications for other business units within the agency. In many cases, it is these other business units that have specifically requested development of a GIS application or project. The case study agencies recommended involving these stakeholders in the preparation of a GIS business case. This has several advantages. First, the requesting client is in the best position to understand how the project will generate efficiencies. Additionally, the process of completing a business case ensures the client is fully invested in developing the application or project.
- Business cases are becoming increasingly common. Several case study agencies noted that decision-makers have begun to request business cases for major GIS projects on a more frequent basis. As decision-makers and stakeholders seek increased transparency and accountability in agency investments, GIS practitioners at transportation agencies should prepare for business case analyses to become more common.
2.5 Potential Areas of FHWA Support
Agencies noted several potential areas where FHWA activities could support a transportation agency's efforts to make a business case for GIS:
Develop or share guidance to help streamline and standardize the process for conducting ROI analyses for transportation GIS projects. All the peer agencies noted it would be helpful to document industry-standard assumptions and rules-of-thumb for conducting ROIs for GIS transportation projects. Ideally, FHWA could develop or share this guidance in coordination with an organization or partnership of organizations, including both the GIS and transportation industries. Case study agencies also noted it would be particularly helpful to receive guidance and training about methodologies for calculating the value of time savings and allocating shared IT costs across projects.
FHWA could also assist transportation agencies by serving as a clearinghouse for existing business cases and BCAs for transportation GIS projects. According to the peer agencies, existing examples of how other transportation agencies have quantified the benefits of GIS projects are extremely helpful when developing new business cases. Existing business cases can also provide a tool for brainstorming a project's benefits and costs, and a reference for items to consider.
- Develop or share guidance for validating estimated results over time. The case study agencies noted the difficulty validating results of their business cases over time to assess whether estimated benefits became actual benefits. FHWA could support agencies by identifying and sharing best practices for tracking ROI performance measures, as well as measures to assess estimated benefits.
Return to Top
3. Case Studies
This section presents in-depth case studies on the transportation agencies that participated in the report interviews. Each case study includes information on how the agency made its GIS business case, the benefits and challenges encountered, and lessons learned during the process.
3.1 NCDOT – Estimating ROI for Major GIS Projects
Background
NCDOT's GIS unit conducted several ROI analyses. This is primarily due to the fact that the North Carolina Office of State Budget Management (OSBM) requires State agencies to show a positive ROI for all IT investments. In place since 2004, the policy applies to the NCDOT GIS unit.
There are two general ways in which NCDOT initiates geospatial projects. In some cases, a group outside the GIS unit proposes the development of a GIS-based tool that will improve the delivery of a specific NCDOT program. In other cases, the GIS unit proposes enhancements to existing systems (such as software, hardware, and operating procedures) that will result in improved delivery of GIS services to potential customers. Per the OSBM policy, for all GIS projects, a business case must be justified through the submittal of an ROI analysis that shows a positive ROI. For geospatial tools, the NCDOT business unit that proposes the work is responsible for estimating a project's anticipated benefits, but the GIS unit estimates that project's cost.
NCDOT's ROI Policy in Practice
A recent project example originating within the NCDOT GIS unit is the Road Operations and Management Effort (ROME). Launched in April 2013 and currently in the second phase of implementation, the ROME project seeks to integrate a customized version of ESRI's Roads and Highways6 with NCDOT's existing linear referencing system (LRS) and asset management program. The purpose of ROME is to improve the delineation of 80,000 miles of road the State maintains. It will also allow business units across NCDOT to utilize a common enterprise LRS, simplify workflows, and improve efficiency by providing timely and accurate information to consumers of the agency's spatial data (Figure 1).
Figure 1. Diagram Illustrating ROME's Ability to Streamline the Workflow between NCDOT's Many GIS Programs
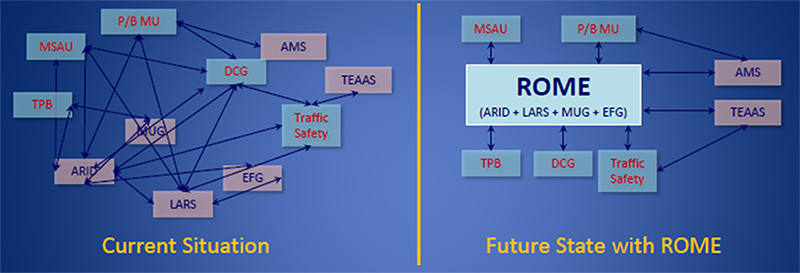
An important aspect of ROME is its ability to help NCDOT meet a new FHWA requirement that every State DOT include non-system, non-Federal aid roads in its annual Highway Performance Monitoring System (HPMS) report. NCDOT received a waiver in 2014 but was informed that Federal aid funds may be delayed or withheld in 2015 if it does not report approximately 20,000 miles of non-system, non-Federal aid roads it maintains. The legacy platforms would have required significant staffing increases and upgrades to the software and hardware environments to support the addition of the non-system non-Federal-aid roads.
North Carolina OSBM does not provide a standardized ROI guide or template, leaving it up to each State agency to decide the best way to quantify IT project costs and benefits over time. However, OSBM does require benefits and costs be converted into dollar values—there is no weight given to qualitative benefits. In the case of ROME, NCDOT GIS Manager, John Farley estimated total project costs of approximately $5.68 million, which included project planning, development, deployment, and maintenance over a seven year period. To quantify ROME's benefits, Farley estimated the cost avoidances associated with upgrading and maintaining the agency's legacy LRS platforms in order to comply with the new HPMS requirements. Using this methodology, Farley identified close to $10.5 million in cost avoidances, demonstrating the implementation of ROME would save NCDOT nearly $5 million over seven years (Table 2). Most of the savings accrue from avoiding the required labor to upgrade and maintain an out-of-date LRS.
Table 2. Anticipated Cost Avoidance with Implementation/Operations/Maintenance of ROME
| Cost Avoidance |
# of Resources |
Hours per Year |
Avg. Hourly Rate |
Annual Estimated Cost |
Time frame |
Total Estimated Cost |
| Staff labor required to upgrade legacy platforms to support non-system roads |
15 |
29,700 |
$80 |
$2,376,000 |
2 years |
$4,752,000 |
| Additional hardware to support legacy platform upgrade |
N/A |
N/A |
N/A |
$200,000 |
One-time cost |
$200,000 |
| Staff labor to maintain non-system roads in legacy platforms |
5 |
9,900 |
$80 |
$792,000 |
7 years (2 during upgrade process plus 5 for operations and maintenance) |
$5,544,000 |
| TOTAL COST AVOIDANCE |
$10,496,000 |
| TOTAL ESTIMATED COST |
$5,683,543 |
| TOTAL ROI |
$4,812,457 |
Benefits of Making a Business Case
- ROI is integrated into the IT business process. Because an ROI analysis is required for every major IT investment, most IT professionals at NCDOT are comfortable with the process of developing this type of analysis. Those who propose new major initiatives understand that a business case will need to be made before it can move forward, and State leaders know that all significant IT investments have been justified.
- ROIs allow NCDOT's GIS unit to clearly show the benefit of technical projects that may be more difficult for decision-makers to understand. Farley cited ROME as an example of a project that is difficult for decision-makers to grasp. Why spend $5 million when the agency already has an LRS? ROME is extremely important for NCDOT's core processes. According to Farley, the ROI was useful in convincing decision-makers of ROME's necessity.
- ROIs help prioritize delivery of new products. As the desire for GIS services continues to grow within NCDOT, Farley and his staff have difficulty managing demand for new products. The ROI helps customers articulate their desired outcomes with quantifiable impacts. With this information, Farley noted it is easier for the GIS team to prioritize project work and focus on those projects with the greatest potential return.
Challenges of Making a Business Case
- OSBM-required ROI analyses serve only as a means to funding. Though it is integrated into NCDOT's business process, the OSBM ROI requirements are only in place to justify a proposed project budget. The ROI does not necessarily require documentation of the full scope of a project's benefits. Therefore, once an ROI analysis indicates a positive return (i.e., the estimated benefit is greater than the cost), the business unit typically has no incentive to conduct further analysis. In the case of ROME, Farley noted he could likely have quantified numerous additional benefits, but with three line-items, he estimated close to $10.5 million in cost avoidance over seven years. With a proposed budget of $5.6 million, it was apparent early in the process of making a business case that the desired investments would pay off. The ROIs conducted for OSBM approval may not indicate the true magnitude of a project's benefits.
- There are few industry standards for conducting an ROI for GIS. Although NCDOT's GIS unit and its customers have made business cases for many GIS projects over the years, GIS staff would like additional guidance to help streamline and standardize the process for conducting an ROI analysis. Because ROIs conducted for OSBM must convert all benefits in dollar values, NCDOT's GIS unit must routinely make assumptions about the value of benefits. Farley noted it would be very helpful to have documentation of industry-standard assumptions and rules-of-thumb for conducting ROIs for GIS transportation projects. Ideally, this guidance could be developed and supported by an organization or partnership that includes both the GIS and transportation industries.
- Quantification of benefits is required. NCDOT's ROI requirements originate from OSBM, and this means dollar amounts are essential in order to justify a project's expense. Though some benefits are easily quantifiable, other more qualitative benefits can be challenging to interpret in financial terms.
Lessons Learned
- ROI analyses should be revisited to track accuracy of projections. Once an ROI analysis has been completed and a budget approved, OSBM does not require project managers revisit the ROI analysis to track performance. Furthermore, the State does not provide incentives to validate ROI analyses or monitor performance over time. As a result, Farley believes it is difficult to understand whether the actual return on investment matched, exceeded, or fell short of the projected ROI. These issues were also discussed in a North Carolina Office of the State Auditor report published in February 2015.7
- Calculated reductions in labor do not necessarily equal direct savings for the agency. One of the most common ROI calculations focuses on reduced labor hours or a fewer number of full-time employees (FTEs) required to perform tasks. At the State level; however, rarely does an employee lose a job due to improved efficiency. Instead, he or she may be reassigned, and while this may improve efficiency and allow the State to redirect labor, it does not necessarily mean an agency can reduce the size of its payroll. Labor considerations will always play an important role in making a business case for a significant investment, but a better understanding of how labor cuts translate to savings is important to accurately estimate ROI at the State level.
- Incorporate State and Federal reporting requirements when necessary. Because GIS has become such an important aspect of day-to-day work at NCDOT, it is easy to lose sight of its value in carrying out fundamental regulatory processes such those the HPMS requires. The financial implications of failing to comply with State and Federal reporting requirements could be significant, so acknowledging the role GIS plays in allowing NCDOT to meet these requirements should be an important ROI consideration. For example, the ROI for ROME relied upon the cost-savings estimate to implement HPMS compliance.
3.2 VTrans – Using a Formal ROI Study to Make a Business Case for ROW Modernization
Background
Like many States, the Vermont Agency of Transportation (VTrans) lacked a modernized GIS for all State-owned ROW. Information about ROW was located in multiple places and scattered across a variety of data sources, including historic property deeds, hand-drawn paper maps, and computer-aided design (CAD) files. In 2009, the Vermont Center for Geographic Information completed a two-year project to georeference ROW along the U.S. Highway 2 corridor between the cities of St. Johnsbury and Burlington.
The successful project helped motivate VTrans' Ryan Cloutier to find a way to develop a strategy for the agency to modernize its ROW data across the State. Due to the large size and scope of this effort, VTrans' ROW Section needed buy-in from its leadership and members of the Vermont legislature to move the project forward. Based on additional research on a statewide ROW modernization effort the Minnesota DOT undertook, Cloutier knew the project would be costly and time consuming, but he also anticipated the benefits would outweigh the costs. Because identifying and understanding ROW boundaries is an important aspect of every VTrans transportation project, Cloutier believed an effort to modernize ROW data in Vermont would significantly reduce the amount of time and money spent on ROW data collection. He also believed having a comprehensive, georeferenced ROW database could generate additional benefits for other State agencies and the general public. Predicting the full impact of this modernization effort, however, was challenging.
Making a Business Case for ROW Modernization
As a first step toward building the comprehensive ROW database, VTrans contracted with consulting firm Applied Geographics, Inc. (AppGeo) to conduct a one-year pilot project on statewide ROW modernization. AppGeo assessed the state of VTrans' ROW data, developed a GIS-based solution for consolidating that data, and developed a timeline and cost estimate for full statewide implementation. As part of this pilot project, AppGeo conducted a ROI analysis to estimate the costs and benefits of extending the pilot project to include all ROW in the State.
For approximately four months in late 2013, AppGeo conducted interviews with key personnel within VTrans to define use cases in the following areas: Property Management, Environmental Management, Pavement Management, Roadway Design, Structures, Districts, Mapping, Utilities (internal to VTrans), and Utilities (external perspective, i.e., utility companies). These use cases described common workflows and tasks performed by users of existing VTrans' ROW data. Based on information gathered in the interviews and laid out in the use cases, AppGeo determined the quantitative benefits of ROW data modernization, including cost avoidance, increased productivity, higher quality data, and time savings. Combined with the overall costs of ROW data modernization, the team calculated Net Present Value (NPV) and ROI of the statewide ROW data modernization project.8 To reflect the uncertainty in the estimates of the project's benefits, AppGeo prepared “high” and “low” ROI estimates. Table 3 shows estimated NPV and ROI for the statewide ROW data modernization project. According to AppGeo's analysis, statewide ROW data modernization would save VTrans between $9.8 million and $14.3 million over a five-year period, for a total of five to nearly eight times the investment.
Table 3. Estimates of ROI and NPV for VTrans Statewide ROW Modernization Project
| Cost-Benefit Analysis – HIGH |
Year 1 |
Year 2 |
Year 3 |
Year 4 |
Year 5 |
TOTAL |
| Benefits Summary |
$0 |
$4,181,446 |
$4,181,446 |
$4,181,446 |
$4,299,065 |
$16,843,404 |
| Cost Summary |
$128,236 |
$436,100 |
$159,500 |
$601,700 |
$601,700 |
$1,927,236 |
| Discounted Benefits |
$0 |
$4,119,651 |
$4,058,770 |
$3,998,788 |
$4,050,511 |
$16,227,721 |
| Discounted Costs |
$128,236 |
$429,655 |
$154,821 |
$575,416 |
$566,912 |
$1,855,040 |
| NET PRESENT VALUE – HIGH |
($128,236) |
$3,689,996 |
$3,903,949 |
$3,423,372 |
$3,483,599 |
$14,372,681 |
| Cumulative Savings – HIGH |
($128,236) |
$3,561,760 |
$7,465,710 |
$10,889,082 |
$14,372,681 |
|
High ROI = [Discounted Benefits – Discounted Costs]/Discounted Costs = 7.75
| Cost-Benefit Analysis – LOW |
Year 1 |
Year 2 |
Year 3 |
Year 4 |
Year 5 |
TOTAL |
| Benefits Summary |
$0 |
$3,024,054 |
$3,024,054 |
$3,024,054 |
$3,071,102 |
$12,143,264 |
| Cost Summary |
$128,236 |
$436,100 |
$159,500 |
$601,700 |
$601,700 |
$1,927,236 |
| Discounted Benefits |
$0 |
$2,979,364 |
$2,935,334 |
$2,891,954 |
$2,893,544 |
$11,700,195 |
| Discounted Costs |
$128,236 |
$429,655 |
$154,821 |
$575,416 |
$566,912 |
$1,855,040 |
| NET PRESENT VALUE – LOW |
($128,236) |
$2,549,709 |
$2,780,513 |
$2,316,538 |
$2,326,631 |
$9,845,155 |
| Cumulative Savings – LOW |
($128,236) |
$2,421,473 |
$5,201,986 |
$7,518,524 |
$9,845,155 |
|
Low ROI = [Discounted Benefits – Discounted Costs]/Discounted Costs = 5.31
AppGeo presented its findings in a report to VTrans. In addition to the quantitative results of the ROI analysis, the report describes the anticipated qualitative benefits of statewide ROW data modernization in terms of tangible benefits (e.g., income from sale of surplus property) and intangible benefits (e.g., improved customer satisfaction). With this document in hand, Cloutier presented findings to the Vermont legislature and secured funding to expand the ROW data modernization project to include ROW data from across the entire State. To date, VTrans has digitized more than 7,000 ROW plans, accounting for nearly 2,000 miles of newly georeferenced ROW.
Based on the success of using a ROI analysis to make a business case for ROW modernization, Cloutier and his successor Nina Safavi are working with a consultant to conduct a new ROI study for statewide parcel mapping. They are hopeful the results of the ROI analysis will demonstrate the project's benefits across multiple State agencies, which would open new opportunities for funding full implementation of the project.
Benefits of Making a Business Case
- A formal report makes a great communication tool. By teaming with an experienced contractor and investing in a detailed ROI study, Cloutier ensured the process would lead to a polished document that could support decision-making by VTrans' leadership and State legislators.
- Developing a robust, detailed analysis of a project's benefits can improve confidence in the project. A major reason for conducting the ROI analysis was to win approval from the State legislature to proceed with the statewide ROW data modernization project. While Cloutier knew he could make a strong argument for the project using descriptions of its qualitative impacts, having the support of a research-based analysis that demonstrated a high ROI increased his confidence in the value of the effort and allowed him to make a stronger presentation to agency leaders and State lawmakers.
Conducting the ROI helped identify stakeholders and improved collaboration. While developing the ROW data use cases, VTrans and the consultant team identified potential impacts resulting from ROW data modernization that might extend beyond VTrans. For example, VTrans engaged ROW stakeholders external to the agency by attending an International ROW Association meeting and sharing information about the ROW data modernization pilot project. As a result of this outreach, the AppGeo team interviewed staff at the Vermont Electric Power Company, which maintains all of the State's major transmission lines, to understand how the utility company might benefit if VTrans modernized its ROW data. Identifying these impacts helped AppGeo and VTrans better understand the full costs and benefits of the project.
As VTrans embarks on a comprehensive statewide parcel mapping initiative, the agency plans to use the ROI process as a way to engage stakeholders in State government and the general public. For example, as part of the ROI study, the AppGeo team will interview State agencies and consultants to better understand how they would use statewide GIS parcel data, if it existed. The resulting analysis will be used to help estimate potential benefits for each State agency participating in the initiative. VTrans also plans to use the parcel ROI study to support VTrans' efforts to secure a portion of project funds from other State agencies.
Challenges of Making a Business Case
- Time and cost savings are difficult to document after the fact. Cloutier and his team are confident that ROW data modernization has resulted in significant time reductions associated with ROW data research, and they believe the ROI accurately projected the associated time savings. They have not, however, been able to formally track time and cost savings since the project was implemented.
- Few resources are available for ROI studies with a GIS focus. In preparing to conduct the ROI analysis for statewide ROW data modernization, Cloutier did not find many resources to help develop the ROI study. Aside from work completed by Minnesota DOT, Cloutier and AppGeo created much of the methodology for the VTrans ROI from the ground up using general NPV and ROI practices.
Lessons Learned
- Guidelines can help, but creativity and flexibility are also important. The use case methodology allowed VTrans to customize the ROI analysis to reflect the ROW data modernization project's full benefits. By getting different perspectives from a range of potential GIS users, the final outcome reflected an estimation of the full range of impacts and associated benefits. According to Cloutier and Safavi, guidelines for conducting the use case interviews would have been helpful. But given that each State and project is unique, the process of choosing use cases should remain flexible to incorporate a variety of viewpoints.
- ROI studies are becoming an expectation. From VTrans' perspective, the ROI study for ROW data modernization was successful. Agency executives and the Vermont legislature funded the effort after seeing the ROI analysis results. When VTrans proposed a project to build a statewide GIS database of parcel data, the State legislature requested a similar ROI analysis to help them better understand the merits of the project. According to Cloutier and Safavi, understanding costs and benefits is a good business practice that has enabled VTrans' ROW Section to proceed with more ambitious GIS development projects than agency leadership likely would have permitted. Both believe that conducting ROI analyses will become increasingly important at VTrans, and perhaps at other State agencies, as decision-makers and stakeholders seek increased transparency and accountability of agency investments.
3.3 UDOT – Institutionalizing ROI into Requests for New GIS Tools
UDOT's GIS unit supports using GIS tools and applications throughout the agency. The GIS unit does not receive a designated budget for developing GIS tools and applications, and groups within UDOT come to them with funded and unfunded requests to develop GIS tools, data layers, or maps. Past experiences with conducting ROI analyses have prompted UDOT to institutionalize its approach. UDOT now includes these analyses as part of its business process for building new GIS tools and applications.
Background
Two business cases conducted for UDOT GIS projects of different scales helped the agency identify a need for more consistent evaluation methods.
In 2013, two UDOT regional offices began an effort to create an accurate ROW GIS layer from existing CAD files as well as a viewer tool that would allow users to easily access and view the data. Previously, requests for information about ROW required extensive staff time to research the relevant data. In UDOT Region 2, Randy Smith, a champion of the effort to develop a consolidated, accurate ROW GIS layer, quantified the benefits of this project by measuring time to respond to requests with and without the GIS layer and viewer tool. The resulting ROI, completed in 2014, was instrumental in convincing UDOT to expand the use of GIS for ROW parcel tracking and management. UDOT is currently developing a GIS layer to show parcels earmarked for corridor preservation.
Also in 2013, UDOT's GIS unit created an online map for UDOT's Outdoor Advertising Control (OAC) group. The map required relatively little effort on the part of the GIS team but was instrumental in streamlining the work of the OAC group. Becky Hjelm, GIS Manager at UDOT, and others in the GIS unit received feedback that this new map was helping reduce staff time spent responding to requests for permitting records, increasing efficiency in the permit application process, improving quality control, and ensuring UDOT complied with relevant regulations. There had been no formal ROI analysis completed, however, to formally assess these benefits. To address the issue, Hjelm asked the OAC project manager to estimate the ROI from the OAC map. Hjelm worked with the OAC group to develop a business case for the map that included an estimated ROI and qualitative descriptions of the project's benefits.
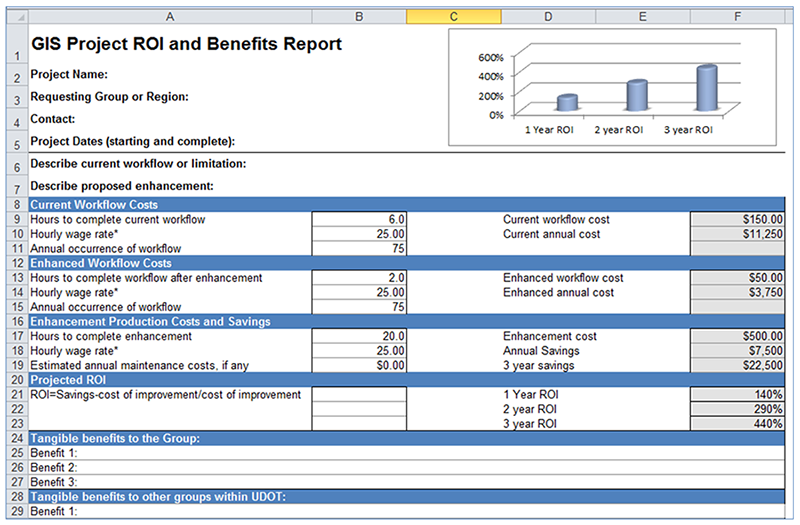
Based on these separate examples of ROI, UDOT's GIS unit decided to use a ROI template to institutionalize ROI analyses into the unit's business processes. Using the ROW ROI, the OAC ROI, and an ROI template developed at the Utah Department of Natural Resources (DNR), UDOT developed a Microsoft Excel-based template for calculating ROI of GIS projects (see Figure 2). The template includes a quantitative ROI calculation based on time savings from streamlined workflows and provides space to list qualitative benefits for the customer, other groups within UDOT, external stakeholders, and the general public.
UDOT's GIS unit plans to use the Excel template to integrate routine ROI calculations as part of the initiation and conclusion of GIS projects. Beginning in 2015, the GIS unit will ask all proponents of GIS projects that lack dedicated funding and require more than 50 staff hours to demonstrate a positive ROI. The resulting new process for tracking ROI of GIS projects includes both estimation of ROI at the outset of the project and tracking results after the project is completed. When a group within UDOT requests a GIS project, the requesting project manager will be asked to complete the ROI template. UDOT also plans to follow up with project managers after projects are complete to document time savings and other benefits.
UDOT's Excel-based ROI template for GIS projects calculates an ROI based on information about workflow costs with and without the project. The template also includes spaces to list other benefits to the client group, other groups within UDOT, and other external groups or the general public.
Figure 2. UDOT's ROI Template
Benefits of Making a Business Case
- Use of a template increases efficiency and comparability. The UDOT ROI template provides a standardized starting place for making a business case for a GIS project and reduces the time spent developing each ROI. Additionally, the template facilitates making comparisons between GIS projects. According to Hjelm, business cases developed for previous major GIS projects used a variety of documentation approaches and metrics, which made it difficult for decision-makers to compare them. The template addresses that issue and increases the ability of decision-makers to make “apples to apples” comparisons.
- Estimating ROI at the outset of all major projects provides a tool for decision-making. UDOT wants to ensure its limited GIS budget is used in the most effective way. Consistent use of the ROI template provides a tool for GIS staff, senior leadership, and the IT Department to compare and prioritize projects. According to Hjelm, ROIs that use the template will better inform project prioritization and ensure the GIS unit is serving UDOT's needs.
Documentation of benefits has helped grow the GIS program. ROI analyses allow the UDOT's GIS unit to better articulate the value it generates for UDOT. Previous annual reports for the GIS program struggled to communicate its benefits because many were accrued to clients elsewhere in UDOT, and there was no systematic process for following up with clients. According to Hjelm, her team's efforts to document ROI and promote the results led to increased recognition and resources for the GIS program. Since the GIS team began emphasizing ROIs, the program has received additional staff (from two FTEs to five) as well as additional funding.
As the GIS unit continues to grow, Hjelm anticipates the ROI analyses will also facilitate the development and tracking of performance measures for the GIS unit as a whole.
- The combination of quantitative and qualitative benefits appeals to a range of audiences. UDOT's ROI template includes a quantitative analysis that projects ROI after one, two, and three years. The template also includes space to describe qualitative benefits that may not be captured in the ROI calculation. According to Hjelm, this combination has proved effective in communicating to both IT managers and senior decision-makers.
Challenges of Making a Business Case
- Some benefits can be difficult to quantify. Time savings are relatively straightforward to quantify. Other benefits—like legal compliance, better quality control, or improved customer satisfaction—are more difficult to convert into a dollar value. UDOT addressed this challenge by providing space for project managers to describe anticipated qualitative benefits.
- The scope of a project's benefits can be difficult to anticipate. GIS projects often generate unexpected benefits that users accrue beyond the initial customer, which can make it difficult to anticipate the true benefits of a project. For example, the ROI for the ROW project quantified time savings to the ROW group associated with faster request response times. The ROW project also benefitted other groups within UDOT in unanticipated ways. UDOT planners benefit from the tool because the ROW layer reduces the effort required to determine where UDOT owns ROW. These secondary benefits can be difficult to anticipate and quantify. Some impacts only become apparent after time has passed. At UDOT, the GIS unit decided to focus on benefits to the primary client group but to acknowledge other benefits when known.
- ROI analyses take time. Even with the simplified ROI template, documenting a project's anticipated ROI still takes time. At UDOT, both GIS staff and internal clients face heavy workloads and may not want to take on additional work that is perceived to be an added administrative burden. Although Hjelm would like to conduct an ROI for every new GIS project, it is not currently feasible.
Lessons Learned
- Shift the burden of making a business case onto the client. UDOT's new ROI system makes the requesting project manager responsible for quantifying benefits. This has several advantages. First, the requesting client group is in the best position to understand how the project will generate efficiencies. Additionally, the process of completing a ROI ensures the requesting client group is confident the project will generate benefits and is fully invested in developing the project.
- Include both quantitative and qualitative benefits. In Hjelm's experience, some project managers find it easier to list qualitative benefits first before attempting to calculate a monetary value. ROI calculations can be very effective at succinctly making a business case for a GIS investment, while qualitative descriptions of process improvements or positive externalities may help provide context for a project and build support for a GIS program more broadly.
- Build on others' efforts to calculate ROI for GIS projects. Other stakeholders may already be working on efforts to quantify ROI. When Hjelm began quantifying ROI for UDOT GIS projects, she did not realize the Utah DNR had already developed a template for estimating the ROI from GIS efforts. DNR shared its template with UDOT, and UDOT's current template is based on DNR's version.
Additional Documentation
- ROI for ROW project (pdf): Available on request
- ROI for Billboard Project (pdf): Available on request
- ROI template spreadsheet (xlsx): Available on request
3.4 FDOT – Estimating the Return from the ETDM Process
Background
In 2000, FDOT launched a major overhaul of its planning and programming processes with the goals of expediting project delivery and improving environmental outcomes. The resulting methodology, called the Efficient Transportation Decision Making (ETDM) Process, implemented significant changes in how FDOT screened transportation projects in order to identify potential environmental impacts. “Screening events” are fundamental to the ETDM Process. During these screening events, which occur early in the transportation planning process, all relevant stakeholder agencies review the potential transportation project and provide input about possible environmental impacts. The Environmental Screening Tool (EST), a web-based GIS mapping application that FDOT built, is another integral component of the ETDM Process. EST allows FDOT, partner agencies, and other stakeholders to view, analyze, and provide input regarding potential impacts of proposed transportation projects on natural, cultural, and community resources.
EST provides a number of important functions for FDOT and its partners:
- Data Repository. EST includes more than 550 geospatial data layers that ETDM Process stakeholders use when evaluating the impacts of a transportation project.
- Spatial analysis and customized reporting. EST includes geospatial analysis tools and reports that ETDM Process stakeholders can use to analyze a project's potential environmental impacts. As a result of these tools, EST has helped DOT develop scopes of analysis, identify relevant issues, and add value to early agency coordination.
- Simultaneous access and review. Using the EST, all transportation project reviewers have simultaneous access to project information through the EST screening events. The EST facilitates a consolidated review cycle in which all reviewers can evaluate the proposed project and submit comments during standardized review periods. This supports planning and environmental linkages.
- Streamlined documentation. Transportation project reviewers provide input directly through EST, which aids in refining analysis and developing schedules. EST's use of electronic submissions reduces paperwork and improves transparency. The EST automatically archives an official record of reviewers' comments at specific project milestones and stores them in FDOT's electronic document management system.
Making a Business Case for the ETDM Process and EST
During the first 10 years of implementation, FDOT spent approximately $31 million on ETDM, including $18 million to develop and manage the ETDM Process (including development of EST) and $13 million to compensate partner agencies for their expedited reviews. 100 percent of the funds used to support the ETDM Process were Federal reimbursable dollars allocated to FDOT through FHWA's environmental streamlining initiatives established in the Intermodal Surface Transportation Efficiency Act, the Safe, Accountable, Flexible, Efficient Transportation Equity Act: A Legacy for Users, and MAP-21.
Biannual progress reports were prepared between 2001-2012 to document implementation of the ETDM Process and its projected benefits. FDOT decided to use the fifth ETDM Process progress report as an opportunity to project the ROI for the process. ETDM Progress Report No. 5 was published in 2012 and included an ROI analysis and qualitative descriptions of benefits realized from implementation of the ETDM Process and EST. The primary audience for the ROI conducted as part of this progress report was ETDM stakeholders across Florida, State DOT decision-makers, and FHWA.
To create the business case included in ETDM Progress Report No. 5, FDOT used two sources of data:
- 2011 ETDM Cost-Benefit Assessment. In November 2011, FDOT provided every FDOT district office and the Florida Turnpike Enterprise (FTE) with a list of all transportation projects screened using the ETDM Process between October 2004 and October 2011 (a total of 496 projects) and a list of generic potential benefits and costs. FDOT asked each district to estimate, for each project, how the cost and staff-time hours would have been different if FDOT's previous sequential, paper-based coordination process had been used instead of the ETDM. In many cases, in its response to this request, the district offices included descriptions of how the ETDM Process had generated those projected costs or benefits. The results of this survey provided the quantitative basis of the ROI.
- The 2010 ETDM Biennial Survey. FDOT conducts a survey of FDOT district offices and ETDM Process partner agencies every two years to solicit information on how the ETDM Process is working. The 2010 survey asked agencies about observed benefits of the ETDM Process. FDOT received survey responses from all FDOT districts and 17 partner agencies. These responses provided FDOT with qualitative and anecdotal information about the ETDM Process that was used to supplement the quantitative ROI analysis.
Figure 3 shows the ROI summary table included in ETDM Progress Report No. 5. It provides that over the seven-year period, the ETDM Process and EST saved FDOT a projected $26,087,344 net in project costs and 805 staff-time-months.
Figure 3. ROI for ETDM Process, conducted by FDOT in 2012
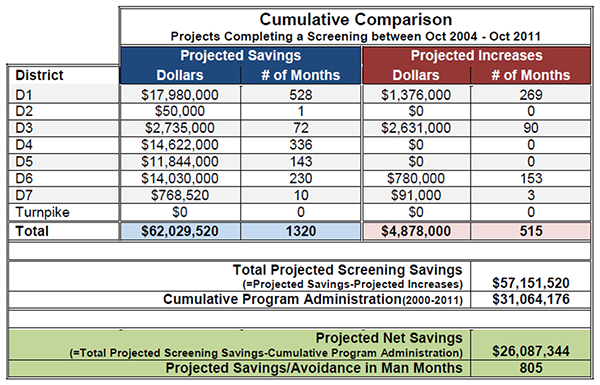
In addition to the quantitative summary of the ETDM Process' benefits and costs shown in Figure 3, the Progress Report included qualitative information about benefits in an appendix. In the appendix, FDOT organized qualitative descriptions by benefit category (e.g., “Promoted Better Decision Making for Transportation Projects”) and by respondent. For example, FDOT District 4 and District 6 noted that “the ETDM Process expedited the review and production of the I-95 Managed Lanes Pilot Project: 95 Express by narrowing the range of required technical studies, reducing their scope, and achieving an early and clear Class of Action Determination.”
Benefits of Making a Business Case
- The ROI analysis justified the ETDM Process's significant financial costs. With a cost of $31 million over seven years, the ETDM Process was resource intensive to implement. According to FDOT, the ROI analysis helped demonstrate to stakeholders and decision-makers that early coordination with stakeholders to link planning and environmental processes through the ETDM Process was working.
- Conducting the ROI helped FDOT better understand the outcomes of the ETDM Process. To estimate the ROI from the ETDM Process, FDOT collected quantitative and qualitative information about how the process was working from FDOT District offices and agency partners. These responses helped FDOT identify best practices and areas of improvement. For example, early and continuous communication improves relationships and increases the early identification of environmental considerations and issue specific coordination opportunities. It also enhances scope development with realistic schedules.
Challenges of Making a Business Case
- Lack of a consistent methodology made ROI results hard to compare. To conduct the ROI analysis, FDOT asked each FDOT district to estimate the costs and savings that resulted from using the ETDM Process. Because FDOT is a decentralized agency; however, FDOT Central Office did not specify a methodology. Instead, the methodologies that each district used varied depending on how they were structured and or how they accounted for various activities. Many districts relied on practitioners' estimates of typical project costs in the pre-ETDM Process and with the new ETDM Process. As a result of these differences, costs and benefits were not directly comparable across districts. For example, District 1 reported nearly $18 million projected cost savings, while District 2 reported $50,000 in projected cost savings. Because the two districts used different methodologies to estimate savings from the ETDM Process, it is impossible to know if the difference in savings is due to the methodology used, how the ETDM Process was implemented, the number of projects evaluated, or some other factor.
- The scope of the ROI did not include all of the benefits of the ETDM Process. Although the purpose of the ETDM Process is to reduce the time and cost of major transportation project delivery, it also generates benefits for smaller transportation projects and for the State as a whole. The ETDM Process is intended to be continuously improved based on communication and feedback from partners. The initial biannual reports were intended to provide a status regarding implementation, identify benefits, as well as opportunities for improvement. The ROI did not include any benefits the ETDM Process and EST generated outside of FDOT project delivery activities. For example, Pete McGilvray, Project Screening and Technologies Administrator for FDOT, noted the EST is a valuable tool for local jurisdictions to explore environmental, cultural, and socioeconomic data. The ETDM Process also has a goal of improving interagency coordination. Improved coordination may not lower costs for a specific project, but it may improve outcomes over time. To acknowledge benefits that may not be captured in the ROI analysis, Progress Report No. 5 supplemented the quantitative ROI with qualitative descriptions of benefits.
- FDOT was unable to verify if the “dollars saved” reported in the ROI actually resulted in cost savings to FDOT. FDOT calculated total cost savings by summing the cost savings that each FDOT District Office reported. Many of the projects screened through the ETDM Process, however, were budgeted and programmed prior to the launch of the ETDM Process. Because project programming is based on long-range estimates, contingencies, and risk, it would be difficult, if not impossible, to document actual realized benefits due to the fact the projects are unique and issues that work against initial assumptions may arise at any time. FDOT instituted many improvements to the process to seek greater value. For instance, the agency integrated the Advance Notification (AN) process into EST, which allows FDOT to efficiently inform stakeholders about a proposed transportation action.
Lessons Learned
- It can be difficult to distinguish between the benefits of a process change (e.g., ETDM) and the benefits of the technology that enabled the process change (e.g., EST). FDOT's business case does not distinguish between the EST and the ETDM Process. This was not an oversight, but was by necessity—the current costs and benefits of the EST only exist in the context of the overall ETDM Process. For example, one of the major benefits of EST is that it enables simultaneous review by all partner agencies. Without the larger workflow changes the ETDM Process enabled, simultaneous review would not be realistic. Because GIS tools are integrated into FDOT's usual business practices, McGilvray observed it is difficult to untangle the geospatial benefits of the ETDM Process from its non-geospatial components.
- Adapt the ROI to ensure benefits are assessed at an appropriate scale. FDOT's Environmental Management Office oversees the ETDM Process and EST and writes the biannual progress reports. However, most of the benefits—for example, streamlined environmental review, better decision-making, faster project delivery—are seen most clearly at the district level. Rather than trying to estimate ETDM Process's benefits across the entire State, the Environmental Management Office asked district offices to estimate the costs and benefits for the projects they manage.
- As new processes and tools become integrated into everyday practice, it becomes difficult to find “before” comparison points for a ROI analysis. According to McGilvray, the ETDM Process is now thoroughly integrated into FDOT's regular business practices. FDOT has no future plans to estimate the ROI from the ETDM Process, because the process is the only one in existence within the agency.
Additional Documentation
3.5 ODOT – Documenting the Benefits of a GIS-Based Oversize/Overweight Permitting Application
Background
In 2008, the Oklahoma legislature directed the Department of Public Safety (DPS) and ODOT to improve the permitting system for oversize/overweight vehicles.
In a previous system, DPS staff manually developed routing for oversize/overweight vehicles using static maps of bridge clearances, weight limits, and construction zone width clearances. This approach was time consuming and staff-intensive. It also introduced high potential for human error. Long wait times to receive permits resulted in high numbers of customer complaints and increased the frequency of carriers operating without permits.
With assistance from consultants, DPS and ODOT developed and launched the Oklahoma Permitting and Routing Optimization System (OkiePROS) in November 2011, which is a new GIS-based permitting system to respond to the State legislature's directive. OkiePROS contains several major components:
- Online permit application. Trucking companies and drivers can apply, pay for, and print permits online, 24 hours a day.
- Restriction Manager. The Restriction Manager is a web-based GIS interface for DPS and ODOT personnel to manage height, weight, and width restrictions on all bridges and roads in the State. DPS and ODOT staff responsible for managing the restrictions can view, add, and edit temporary restrictions, including those caused by construction projects, road closures, crashes, and weather conditions. Permanent restrictions, including height limitations on bridges, are uploaded to the Restriction Manager nightly through database links with Pontis, ODOT's bridge management software.
- Intelligent Route Planner. The Intelligent Route Planner is a geospatial tool that uses ODOT's GIS road network, the permit application submitted by the trucking company, and restrictions from the Restriction Manager to generate a suitable safe driving route with printable driving directions and a map.
Making a Business Case for OkiePROS
The Oklahoma legislature did not specifically request a ROI study for OkiePROS, but wanted to better understand how the new system was improving DPS and ODOT's business processes. Senior staff at ODOT and DPS charged Jay Adams, ODOT project manager for OkiePROS, and Branford Dodd, Director of Size and Weight Permitting at DPS, with making the case that the legislature's investment in OkiePROS had paid off.
To develop a business case, Adams and Dodd started with the list of project goals established when the OkiePROS project kicked off. With these initial goals in mind, Adams and Dodd selected metrics to compare the performance of the old manual permitting system with that of OkiePROS. They determined metrics based on the initial goals of the project, data availability, and their first-hand knowledge of the project's impacts. Adams and Dodd did not attempt to calculate the monetary value of safety benefits or time savings associated with the use of OkiePROS because they considered those benefits more difficult to quantify.
Table 4 summarizes the metrics that Adams and Dodd included in their analysis.
Table 4. Metrics Used to Assess Business Case for OkiePROS
| Category |
Measure |
Before OkiePROS |
After OkiePROS |
| Safety |
Number of bridge hits annually |
5-10 per year |
3 in the last 3 years (all due to driver error, not OkiePROS) |
| Number of permits issued annually |
Average: 149,530
Highest ever: 201,000 |
2011: 251,161
2013: 253,841 |
| Permitting compliance |
Trucking companies reported they drove without permits when permit office was closed |
15% of permits issued outside of permit office business hours |
| Number of construction zones reroutes that require Highway Patrol coordination |
15-20 per year |
Less than 5 per year |
| Customer Service |
Length of time required to get permit |
Typical: 1-3 days
Max: 7 days |
70% of permits are issued within 15 minutes
Max: 1 day – Review by Engineering (not including load excess 500K pounds)
|
| Call center average hold time |
3.7 hours |
7 minutes between 9:00 A.M. and 11:00 A.M. At other times of the day there is typically no wait. |
| Number of calls that disconnected while on hold |
32,100 per month |
24 per month |
| Public satisfaction |
Frequent complaints about time and effort required to obtain a permit |
Reduced time and effort to obtain a permit. A customer satisfaction survey in Year 3 found 91% of customers were satisfied |
| Government Efficiency |
Annual revenue generated by permits |
Average: $30,000,000
Highest ever: $38,152,241 |
2011: $46,607,938
2013: $53,953,730 |
| Call center hours |
7:00 A.M. – 7:00 P.M. M-F |
7:30 A.M. – 5:00 P.M. M-F |
| Call center FTEs |
2 shifts |
1 shift |
| Permits auto-approved online |
0% |
~70% |
| Call center employee turnover |
40% |
5% |
| Employee morale |
Extremely low due to long hours, complicated workflow, and frustrated and angry customers |
Improved morale due to simplified workflow with less potential for human error, fewer frustrated customers because of shorter hold times |
In lieu of a formal report, Adams presented the business case for OkiePROS to the Oklahoma legislature and ODOT and DPS Executive Staffs as a PowerPoint presentation. The results of the business case analysis were used in news releases about the benefits of OkiePROS.
Benefits of Making a Business Case
- The impressive results of the study opened doors. Stakeholders, including DPS and ODOT senior staff, the State legislature, and trucking companies, considered the benefits of OkiePROS—to be impressive and easy to understand. The first year OkiePROS was operational, permit revenues exceeded the previous record by $8 million (21 percent). The business case analysis played an important role in documenting and publicizing the results of OkiePROS. According to Adams, communicating the benefits of OkiePROS to ODOT leadership and the State legislature also helped showcase the entire ODOT GIS program.
- Showing anecdotal evidence of ‘intangible’ benefits highlighted ODOT's GIS program for decision-makers. The OkiePROS business case analysis included anecdotal details about impacts that are traditionally harder for GIS staff to quantify, like permit compliance, customer service, and employee morale. According to Adams, quantifying and documenting these benefits after implementing OkiePROS helped build the ODOT GIS program's credibility and highlight its capabilities to decision-makers.
Challenges of Making a Business Case
- Historic data, or lack thereof, can limit the types of analysis possible. Adams and Dodd used a “before and after” approach to demonstrate the benefits of OkiePROS. In some cases, lack of “before” data limited the comparisons they could make. For example, the “before” statistics on call center average hold times were limited to a three-year period because of when the new phone system was installed. To address this challenge, Adams and Dodd designed their business case analysis around the available data. In most instances, metrics lacking comparison “before” data points were not included in the presentation of results. (The results of a Customer Satisfaction Survey conducted in 2013 were included even though there were no “before” data with which to compare.)
- Intangible benefits can be difficult to communicate. Adams and Dodd faced a challenge in communicating benefits that are more difficult to quantify. For example, OkiePROS resulted in intangible benefits like providing more timely information, more informed decision-making, and improved employee morale. To address this challenge, Adams and Dodd used anecdotes to illustrate intangible benefits. They did not attempt to quantify those benefits.
Lessons Learned
- The methodology used for the business case analysis allowed for easier calculations and was more transparent than a traditional ROI analysis. Adams and Dodd presented both quantitative and qualitative data to the State legislature showing a clear “before and after” picture of the benefits of implementing OkiePROS. According to Adams, a key selling point of the methodology is that it did not require making assumptions about value of time or economic benefits of accident avoidance. As a result, the results were more transparent than a single dollar value or ROI ratio.
- Use a narrative approach to illustrate benefits that may be hard to quantify. Anecdotes or narratives—about how someone's workflow changed as a result of deploying a new tool or application, for example—can sometimes illustrate impacts more easily than a spreadsheet containing numbers. Adams found that anecdotes were especially useful to convey the benefits of OkiePROS that were especially complicated to translate into a dollar value. For example, improvements to employee morale and customer satisfaction are benefits that ODOT and DPS experienced in using OkiePROS, which might have been missed in a traditional ROI analysis. Such benefits were more easily communicated through narratives and anecdotes.
- Have a champion willing to sell the results. According to Adams, his willingness to be vocal and passionate about the benefits of OkiePROS resulted in more recognition for the system and ODOT's GIS program in general.
- Think about how results are communicated. Previous ODOT ROIs have used written reports, but Adams found face-to-face presentations to be more effective. From his perspective, presentations allow more flexibility than reports for emphasizing intangible benefits. Reports and spreadsheets may be less likely to capture a decision-maker's attention.
Target your business case to your audience. Adams emphasized the importance of focusing a business case on benefits that are important to decision-makers. Making a business case for GIS may not require estimating the monetary value of all benefits. In the case of OkiePROS, Adams and Dodd focused on documenting the benefits they believed were most important to the legislature: permit processing speed, customer satisfaction, safety, and permit revenue.
Furthermore, the format of the OkiePROS business case analysis allowed decision-makers to easily focus on the metrics they cared about most. For example, stakeholders who are partial to safety benefits could clearly see the raw change in the number of bridge collisions after OkiePROS' implementation. A traditional ROI analysis—in which all benefits are converted to dollar values, added together, and compared with total project costs to generate a single “ROI” ratio—might not have clearly highlighted this outcome change.
Additional Documentation
“Technology Expedites Permit Process at DPS.” DPS News Release, April 2012. Content no longer available.
Return to Top
Appendix A: List of Interview and Peer Exchange Participants9
Return to Top
Appendix B: Interview Guide
Overview of FHWA Study
Background
- Please describe the purpose of this effort (X) and why it was initiated.
- What is the current status?
- Who was involved in developing X? Did your agency collaborate or coordinate with outside partners to develop X, such as other agencies or consultants?
- Did you look to other State DOT/agency models when developing X?
Business Case Analysis
- Do you have an estimate of the total hours / cost it took to develop X? How did your State DOT/agency get funding for X?
- Methodology:
- What categories of benefits did you evaluate? Why did you choose those benefits?
- What time period did you evaluate? Why did you choose that period?
- Did you face any challenges with developing X or applying the results?
Outcomes
- What results have you seen from X (particularly those related to streamlining, communication, efficiency, and decision-making)?
- Can you provide some examples of how X has led to these results?
- If X involves projections of future benefits, do you collect data or have you developed performance measures to assess the accuracy of those projections? What about anecdotal evidence of accuracy?
- Do you have future plans to make the business case for GIS for other projects?
- What suggestions do you have for other agencies that want to make the business case for GIS?
- What kind of additional resources from FHWA would help you make the business case for GIS?
Return to Top
Appendix C: Peer Exchange Agenda
Federal Highway Administration GIS-ROI Peer Exchange
200 NE 21st St., Oklahoma City, OK 73105
Design Conference Room, 2nd Floor
March 24-25, 2015
| Tuesday, March 24 |
| 8:30 A.M. |
Van departs from Residence Inn/Bricktown |
| 9:00 – 9:45 |
Welcome, Introductions, and Background – FHWA and Oklahoma DOT |
| 9:45 – 10:30 |
Demonstrations/Presentations 1 – Oklahoma DOT |
| Break |
| 10:45 – 12:00 |
Roundtable 1: GIS ROI Definitions, Purposes, Approaches – All participants
- What does ROI mean to you?
- Why did you decide to conduct an ROI?
- Who initiated the effort? Who carried out the study?
- Is your ROI for internal purposes, external purposes, or both?
- How was your ROI funded? Does it take away from department overhead, or is it project-based?
- Does agency policy require ROI studies? Is your agency's ROI policy firmly established, or is it new? Is it seen by leadership as an effective policy?
- Did you involve other areas of State government beyond transportation in your ROI study?
- What did you get out of completing an ROI? Were there unexpected outcomes?
|
| Lunch |
Transport by van to group lunch |
| 1:30 – 2:15 |
Demonstrations/Presentations 2 – Vermont Agency of Transportation (remote) |
| 2:15 – 3:00 |
Demonstrations/Presentations 3 – North Carolina DOT |
| Break |
| 3:15 – 3:30 |
Demonstrations/Presentations 4 – PennDOT |
| 3:30 – 4:45 |
Roundtable 2: Conducting an ROI, Tracking Success, Intangibles – All Participants
- Was your ROI proactive or retroactive?
- Did/do you conduct business differently in order to meet ROI projections and/or expectations?
- How important is it to track the success of geospatial investments over time?
- How did you decide on a methodology? Were there any tools (tutorials, software, trainings, etc.) that were essential to the success of your analysis?
- What are some of the typical intangible benefits that should be considered with a GIS ROI? How do you quantify intangibles? Is it a requirement?
- How are GIS professionals most effectively communicating intangibles to those less familiar with the geospatial world?
- Are intangibles able to be tracked over time? Can this be approached systematically?
- What are some of the key lessons learned?
|
| 4:45 – 5:00 |
Day 1 Key Points/Wrap-Up – FHWA |
Transport by van from ODOT HQ to Residence Inn/Bricktown
| Wednesday, March 25 |
| 7:45 A.M. |
Van Departs Residence Inn/Bricktown |
| 8:00 – 8:15 |
Day 1 Re-Cap – FHWA |
| 8:15 – 9:00 |
Demonstrations/Presentations 5 – Florida DOT |
| 9:00 – 9:45 |
Demonstrations/Presentations 6 – Utah DOT |
| Break |
| 10:00 – 11:45 |
Roundtable 3: Making the Business Case for GIS – All Participants
- In your agency, how important is it to make a business case (either internally or externally) for any significant investment?
- Who is responsible for making the business case for GIS?
- To what extent should business cases for GIS projects use a standard methodology?
- Why does an ROI for GIS need to be different than an ROI for any other IT investment?
- How does agency leadership typically feel about geospatial investments? Are program enhancements difficult to sell, or does leadership already understand opportunities associated with GIS in transportation?
- Should all GIS projects require an ROI or other quantitative/qualitative business case?
- Beyond ROI, what other ways do you make a business case for investment in your geospatial program?
- What resources do agencies need to successfully conduct an ROI and how can FHWA help?
|
| 11:45 – 12:00 |
Day 2 Key Points/Wrap-Up – FHWA |
| 12:00 |
Adjourn |
Return to Top
Endnotes
Return to Top

