Regional Models of Geospatial Cooperation
Case Studies of Select Transportation Agencies
July 2015
DOT-VNTSC-FHWA-15-16
Prepared for:
Office of Planning
Federal Highway Administration
U.S. Department of Transportation
Notice
This document is disseminated under the sponsorship of the Department of Transportation in the interest of information exchange. The United States Government assumes no liability for the contents or use thereof.
The United States Government does not endorse products or manufacturers. Trade or manufacturers’ names appear herein solely because they are considered essential to the objective of this report.
| REPORT DOCUMENTATION PAGE |
Form Approved
OMB No. 0704-0188 |
| Public reporting burden for this collection of information is estimated to average 1 hour per response, including the time for reviewing instructions, searching existing data sources, gathering and maintaining the data needed, and completing and reviewing the collection of information. Send comments regarding this burden estimate or any other aspect of this collection of information, including suggestions for reducing this burden, to Washington Headquarters Services, Directorate for Information Operations and Reports, 1215 Jefferson Davis Highway, Suite 1204, Arlington, VA 22202-4302, and to the Office of Management and Budget, Paperwork Reduction Project (0704-0188), Washington, DC 20503. |
| 1. AGENCY USE ONLY (Leave blank) |
2. REPORT DATE
July 2015 |
3. REPORT TYPE AND DATES COVERED
Final report |
4. TITLE AND SUBTITLE
GIS in Transportation: Regional Models of Geospatial Cooperation
Case Studies of Select Transportation Agencies |
5a. FUNDING NUMBERS |
6. AUTHOR(S)
Paige Colton, Kate Macfarlane, Alisa Fine |
5b. CONTRACT NUMBER |
7. PERFORMING ORGANIZATION NAME(S) AND ADDRESS(ES)
U.S. Department of Transportation, Office of Research and Technology
John A Volpe National Transportation Systems Center
55 Broadway, Cambridge, MA 02142
|
8. PERFORMING ORGANIZATION REPORT NUMBER
DOT-VNTSC-FHWA-15-16
|
9. SPONSORING/MONITORING AGENCY NAME(S) AND ADDRESS(ES)
Federal Highway Administration, Office of Planning
U.S. Department of Transportation
1200 New Jersey Avenue, SE
Washington, DC 20590
|
10. SPONSORING/MONITORING AGENCY REPORT NUMBER
FHWA-HEP-15-057
|
| 11. SUPPLEMENTARY NOTES |
12a. DISTRIBUTION/AVAILABILITY STATEMENT
This document is available to the public through the National Technical Information Service, Springfield, VA 22161. |
12b. DISTRIBUTION CODE |
13. ABSTRACT (Maximum 200 words)
This report, developed by Federal Highway Administration (FHWA) and the U.S. Department of Transportation Volpe National Transportation Systems Center (Volpe), explores how select transportation agencies are sharing geospatial information and developing and using Geographic Information Systems (GIS) applications to support the objectives of the FHWA Regional Models of Cooperation innovation effort. The report highlights the cooperative, geospatial activities that select agencies and their regional partners are pursuing to increase efficiency, improve transportation decision-making, and strengthen relationships among agencies in the same region. To explore these topics in greater depth, FHWA and Volpe selected transportation agencies to highlight in a series of case studies. The case studies and report were conducted as part of FHWA's GIS in Transportation program. Through technical support, resources, and capacity-building opportunities, the program aims to assist transportation agencies to more effectively use GIS and geospatial applications.
|
14. SUBJECT TERMS
Capacity building, Geographic Information Systems (GIS), geospatial applications, transportation planning |
15. NUMBER OF PAGES
47 |
| 16. PRICE CODE |
| 17. SECURITY CLASSIFICATION OF REPORT |
18. SECURITY CLASSIFICATION OF THIS PAGE |
19. SECURITY CLASSIFICATION OF ABSTRACT |
20. LIMITATION OF ABSTRACT |
NSN 7540-01-280-5500
Standard Form 298 (Rev. 2-89)
Prescribed by ANSI Std. 239-18=239-18
298-102
Acknowledgements
The U.S. Department of Transportation John A. Volpe National Transportation Systems Center (Volpe) in Cambridge, Massachusetts prepared this report for the Federal Highway Administration’s (FHWA) Office of Planning. The project team included Paige Colton, Kate Macfarlane, and Alisa Fine, all of the Volpe’s Organizational Performance Division. The Volpe project team wishes to thank the staff members from several organizations nationwide, listed in Appendix A, for providing their experiences, insights, and editorial review. The time they kindly provided was vital to preparing the case studies and reviewing this final report.
Table of Contents
- 1. Introduction
- 1.1 Background
- 2. Observations
- 2.1 Benefits
- 2.2 Challenges
- 3. Case Studies
- 3.1 Developing Tools to Support Regional and Local Planning in the Southwest Idaho Region
- 3.2 Sharing Regional Geospatial Information to Support Economic and Other Analysis in the South-Central Arizona and Intermountain
West Regions
- 3.3 Developing Tools for Regional Emergency Management and Transportation Planning for Counties in Three States
- 3.4 Developing a Regional Data Warehouse for the City and County of San Diego, California
- 3.5 Developing a Regional GIS Inventory in the West Central Florida Region
- Appendix A—List of Interview Participants
- Appendix B—Interview Guide
List of Figures
Figure 1. Canyon and Ada Counties highlighted in green (from left to right)
Figure 2. Screenshot of the COMPASS Performance Dashboard
Figure 3. Screenshot of “Sidewalks per Roadway Mile” performance dashboard
Figure 4. Intermountain West region, with Maricopa County mapped in red
Figure 5. Screenshot from MAG’s Employment Viewer
Figure 6. RAVEN911 displays the isolation and protective zones for a hypothetical anhydrous ammonia spill in downtown Cincinnati
Figure 7. Parcel Lookup Tool is an example of how SanGIS and SANDAG use their MOU to collaborate to provide regional geospatial services
Figure 8. Portion of multi-use trail map, a component of the CCC’s LRTP, developed with analysis of regional GIS datasets
List of Tables
Table 1. Characteristics of case studies included in this report
Return to Top
1. Introduction
The Federal Highway Administration's (FHWA) Every Day Counts (EDC) initiative aims to produce innovations, resources, and partnerships to shorten transportation project delivery, enhance safety, and protect the environment. FHWA is currently promoting an EDC innovation called Regional Models of Cooperation. This effort encourages State departments of transportation (DOTs) and metropolitan planning organizations (MPOs) to develop transportation plans and processes that look beyond jurisdictional boundaries to improve communication, cooperation, policy implementation, technology use, and performance management within and among agencies.
This report, developed by FHWA and the U.S. Department of Transportation (U.S. DOT) Volpe National Transportation Systems Center (Volpe), explores how select transportation agencies are sharing geospatial information and developing and using Geographic Information Systems (GIS) applications to support the objectives of the FHWA Regional Models of Cooperation innovation effort. The report highlights the cooperative, geospatial activities that select agencies and their regional partners are pursuing to increase efficiency, improve transportation decisionmaking, and strengthen relationships among agencies in the same region. To explore these topics in greater depth, FHWA and Volpe selected transportation agencies to highlight in a series of case studies, on the basis of a review of online materials. When possible, the team also conducted follow-up interviews with agencies’ regional partners to better understand their perspectives on regional geospatial cooperation. The Volpe team interviewed the following agencies:
- Community Planning Association of Southwest Idaho (COMPASS).
- Maricopa Association of Governments (MAG).
- Ohio-Kentucky-Indiana Regional Council of Governments (OKI) and the City of Cincinnati.
- San Diego Geographic Information Source (SanGIS) and the San Diego Association of Governments (SANDAG).
- West Central Florida MPO Chairs Coordinating Committee (CCC) and the Tampa Bay Area Regional Transportation Authority (TBARTA).
Appendix A contains a full list of those interviewed, and Appendix B provides the interview guide used as a basis for these discussions.
The case studies and report were conducted as part of FHWA's GIS in Transportation program.1 Through technical support, resources, and capacity-building opportunities, the program aims to assist transportation agencies to more effectively use GIS and geospatial applications.
1.1 Background
Many critical transportation problems, issues, opportunities extend beyond formally defined transportation planning and decision-making boundaries. For example, agencies need to consider how to mitigate transportation projects’ impacts on sensitive natural resources that cross politically defined State, county, or city lines, or they might need to consider how to effectively mitigate traffic congestion that recurs at a border crossing. However, transportation planning and decision-making has traditionally and primarily occurred within the boundaries of a State or a region as defined by Federal legislation. In recent years, Federal, State, and local transportation agencies have increasingly emphasized the importance of collaboration across jurisdictional boundaries. There is growing awareness that economic, energy, environmental, and other concerns that impact transportation planning can be more effectively and strategically addressed at new scales, including at a regional scale.2
Transportation researchers have examined specific cases where agencies have collaborated regionally, and have identified a number of benefits resulting from these efforts. For example, agencies have been able to identify transportation needs more comprehensively, leverage funding and other resources, improve project outcomes by aligning policies and needs, and coordinate transportation services to improve efficiencies.3
FHWA has supported agencies in collaborating more effectively at a regional level. Beyond FHWA’s Regional Models of Cooperation effort, FHWA’s Office of Operations has developed resource materials on regional cooperation to support operations planning.4 FHWA’s Office of Planning is exploring how agencies can conduct transportation planning on a megaregion scale and across a spectrum of politically defined boundaries (e.g., through cross-MPO collaboration).5
Transportation agencies are using GIS and other types of geospatial tools to support all stages of transportation planning, project development, and decisionmaking. As such, geospatial tools can play an important role facilitating regional cooperative efforts. These efforts may range widely, from sharing geospatial data among an MPO’s members, to an MPO and State collaborating to contribute data to a GIS application, or several MPOs identifying common objectives for improved regional geospatial analysis. Many State DOTs, MPOs, and other transportation agencies have long sought to coordinate their geospatial activities with others, including the public.6 However, limited research is available on agencies’ experiences engaging in regional geospatial coordination. This report seeks to fill this gap and document some examples of challenges, benefits, and lessons learned in this area. The case studies presented here are also expected to help agencies consider different ways in which cooperative geospatial activities can be structured.
Return to Top
2. Observations
This section describes observations relating to benefits, challenges, and lessons learned from agencies' experiences in using geospatial technologies to support regional cooperation. The observations detailed below do not represent all models of regional geospatial cooperation. Rather, they are intended to provide examples of agencies that are experiencing successes in this area.
The case studies examined in this report illustrate how regional geospatial cooperative efforts can be structured. Table 1 provides a summary of the case studies, highlighting the following characteristics for each:
- Names of organizations that led the efforts
- Types of organizations that participated in the efforts, such as MPOs, transportation planning organizations (TPOs), councils of governments (COGs), or State DOTs
- Lead organizations’ purposes for undertaking the efforts
- Whether the lead organizations developed formal structures to outline roles/responsibilities for participation in the effort (e.g., memoranda of understanding [MOUs]) or whether the lead organizations relied primarily on more informal mechanisms (e.g., cultivation of working relationships) to encourage participation
Table 1. Characteristics of case studies included in this report
| Case Study Title/Link |
Organizations Involved in Effort |
Name of Cooperative Efforts |
Purpose of Efforts |
Formal or Informal Structure for Participation? |
| |
Lead Organization |
Participating Organizations |
|
|
|
| Developing Tools to Support Regional and Local Planning in the Southwest Idaho Region |
Community Planning Association of Southwest Idaho (COMPASS) |
Southwest Idaho cities and counties |
CommunityViz; COMPASS Performance Dashboard; regional data center |
Inform local and regional planning |
Informal |
| Sharing Regional Geospatial Information to Support Economic and Other Analysis in the South-Central Arizona and Intermountain West Regions |
Maricopa Association of Governments (MAG) |
Maricopa County agencies and organizations; Intermountain West Transportation Management Associations (TMAs); MPOs, COGs, and State DOTs in the Intermountain West region; Mexican and Canadian agencies |
Interactive mapping and analysis applications; Intermountain West Region common GIS operating vision/ platform |
Support regional transportation, demographic and economic analysis; streamline implementation of key Intermountain West region transportation projects |
Informal |
| Developing Tools for Regional Emergency Management and Transportation Planning for Counties in Three States |
Ohio-Kentucky-Indiana Regional COGs |
Emergency responders; OKI member MPOs |
Regional Asset Verification and Emergency Network (RAVEN911); Project Application Assistant (PAA) |
Improve emergency response; Streamline Transportation Improvement Program (TIP) project application process |
Informal; also developed an MOU |
| Developing a Regional Data Warehouse for the City and County of San Diego, California |
SanGIS |
City and County of San Diego, SANDAG, local governments, general public |
Regional GIS data warehouse; mapping applications |
Collect, maintain, and share geospatial data across the San Diego region |
MOA between SANDAG and SanGIS |
| Developing a Regional GIS Inventory in the West Central Florida Region |
West Central Florida MPO Chairs Coordinating Committee (CCC) and the Hillsborough MPO |
CCC member MPOs/TPOs; the Tampa Bay Area Regional Transportation Authority (TBARTA); local governments, and Florida DOT |
Regional data inventory |
Collect, maintain, and share geospatial data in the region |
Informal |
Overall observations that emerged from a review of the case studies are summarized below:
-
Agencies are developing two broad categories of tools that support regional geospatial cooperation: (1) data repositories7 and (2) data analysis tools. COMPASS, CCC, OKI, and SanGIS developed data repositories to make it easier for stakeholders to access regional geospatial information (in most of these examples, the lead organization is responsible for adding information to the repository. The lead organizations’ partners are considered data owners who are responsible for maintaining their information and providing it to the lead organization to add to the repository). These repositories function as clearinghouses for information, and may have limited analysis or visualization capabilities.
MAG, COMPASS, and OKI are developing tools that the agencies believe are supporting, or will support, more robust visualization/analysis and more informed decisionmaking at a regional level. For example, OKI’s Regional Asset Verification and Emergency Network (RAVEN911) contains data on critical regional infrastructure. It also includes geoprocessing widgets8 that allow a user to extract information to conduct highly specific analyses, such as identifying evacuation routes that should be implemented in the event of a hazardous waste spill. MAG is developing a data platform for the Intermountain West region (see map of the region in figure 4) that is expected to support the agency and regional stakeholders in identifying potential environmental, demographic, and other impacts of transportation projects across jurisdictional boundaries in the region.
-
Agencies are initiating regional geospatial cooperative efforts for different reasons. Regardless of whether they were developing repositories or analysis tools, most of the case study agencies initiated their efforts to make it easier to access or analyze regional information. Others reported that they explicitly wanted to develop tools to help expedite planning and reporting processes (e.g., development of long-range transportation plans (LRTPs)). MAG also noted an explicit goal to improve regional economic analysis through the development of several interactive, GIS-based mapping and analysis applications.
Several of the case study agencies reported that once they saw the value of geospatial cooperation in one area, they sought to extend their efforts to realize benefits in other areas. For example, COMPASS needed to compile regional transportation and population data to develop its 2040 LRTP. During the scenario planning efforts using CommunityViz, various performance indicators and targets were used to select the preferred growth scenario. To generate stakeholder buy-in and participation in meeting these targets, the agency developed a regional data center and included a web-based performance dashboard to highlight these indicators. The dashboard displays maps and graphs that allow COMPASS’ members and the public to better understand how the Southwest Idaho region is performing in relation to the LRTP's goals.
- Building interpersonal relationships is a key success factor in structuring cooperative efforts regardless of the framework used. Some of the case study agencies developed formal agreements outlining roles and responsibilities for how data will be shared; others relied on informal mechanisms, such as frequent communication, to ensure that partners adhered to a specific data format when contributing information. For example, CCC, COMPASS, and their respective member agencies did not develop any formal agreements that described how geospatial data would be collected or shared across the region. These agencies instead depended on cultivating and fostering strong partnerships to encourage contributions to their regional data inventories. Even agencies that signed formal agreements, such as OKI, reported that a key success factor was maintaining strong relationships with existing partners and forging relationships with new partners.
-
Agencies see value in expanding cooperative efforts beyond their jurisdictional boundaries. Some case study agencies were focusing on developing partnerships with organizations in their jurisdictions. For example, CCC primarily coordinates with MPOs/TPOs that are part of its jurisdiction. Other agencies reported working with entities outside their jurisdiction. SanGIS, for example, signed geospatial data-sharing agreements with both the San Diego Association of Governments and the United States Geological Survey (USGS). MAG is developing shared geospatial tools that it expects the entire Intermountain West region will use.
Many of the case study agencies that reported working with others outside their jurisdictions had initially focused on building partnerships within their regions before later expanding outside them. These agencies noted that partnering with others outside jurisdictional boundaries can be difficult. At the same time, these collaborations can provide important benefits: stakeholders who share information may be able to more easily identify interrelationships between projects, and share goals and opportunities to leverage resources. For example, SanGIS worked with the City of Carlsbad, which is not a member of the SanGIS Joint Powers Authority (JPA), to enhance the SanGIS streets data layer; the City of Carlsbad no longer has to maintain its own, separate streets layer and instead can use the SanGIS information.
2.1 Benefits
The case study agencies reported a number of benefits related to engaging in regional geospatial cooperative efforts:
- Time and cost savings. None of the case study agencies reported using formal performance measures or conducting return on investment analyses to assess time- and cost-savings realized through their regional cooperative tools. However, most reported anecdotal evidence that these projects provided time and cost savings. COMPASS noted that it will be able to find all the data necessary for its next LRTP update in its regional data center; previously, COMPASS needed to spend large amounts of time asking each of its members for information. As another example, since building its publicly accessible regional data warehouse, SanGIS has received almost no public record requests for GIS data; the public can now access the information it needs online at its convenience. This has freed up time for SanGIS staff to work on other tasks.
-
Increased efficiencies and leveraged resources. The case study agencies reported that sharing data can reduce duplicative work and leverage resources such as technical expertise. Both the City and County of San Diego recognized that they were collecting duplicative datasets and there was an opportunity to combine efforts; SanGIS was created to resolve this issue. The CCC’s regional data inventory made it easier for the CCC and member organizations to identify data gaps and how they should be addressed. OKI and regional emergency responders found that they needed to collect the same data on school locations. RAVEN911 was developed in part to eliminate the need to collect the same data twice and compile regional datasets that previously existed in disparate locations. OKI received Federal funding to develop RAVEN911; pinpointing where shared data could be collected once instead of twice helped leverage funding to meet multiple agencies’ needs.
Regional geospatial coordination also appears to be especially useful for smaller agencies that don’t otherwise have GIS data, staff, or other software. For example, COMPASS noted that its Performance Dashboard allows member communities that do not have sophisticated GIS tools the ability to more easily visualize and understand the effects of regional forecasted trends (e.g., demographic changes) on community infrastructure.
- Strengthened partnerships or new partnerships. Many case study agencies noted that engaging in regional cooperative efforts has allowed them to strengthen working relationships with existing partners and forge relationships with new partners. For example, MAG’s perceived success in developing a variety of interactive mapping and analysis applications provided a foundation for the agency to expand collaborations with partners across the Intermountain West region. The CCC noted that its past work with the Hillsborough MPO developing a regional GIS inventory will provide a basis to identify new collaboration opportunities in the future, such as building a regional-level geospatial visualization tool.
- Improved decisionmaking. Several case study agencies, including the CCC, COMPASS, MAG, and OKI, noted that regional cooperative efforts can help improve and enhance existing data. Sharing information with more partners can help “share the burden” in terms of identifying data gaps or data quality issues, leading to better and more robust data over time. With better data in hand, agencies can make more informed decisions about transportation investments; further, they can make more strategic decisions at a regional level. OKI and COMPASS each developed geospatial applications that display performance metrics for the regional transportation system. These tools can help partners better understand how their own decisions will fit in the context of broader regional performance goals. MAG believes that when all decisionmakers in a region have access to the same data, they will be able to more comprehensively understand the implications of their decisions.
2.2 Challenges
The case study agencies shared challenges they faced in initiating or managing their regional cooperative geospatial efforts:
- Resource constraints can discourage regional collaboration. Agencies may be reluctant to participate in or contribute to regional initiatives because of limited funds or staff capacity. For example, COMPASS noted that because its staff is focused on addressing agency-specific possibilities, they were unable to launch the regional data center as quickly as they would have liked. MAG reported that many agencies in the Intermountain West region have expressed interest in participating in MAG’s effort to develop a common regional GIS platform, but have concerns about being overburdened by additional work. To address these concerns, MAG has worked to emphasize the ultimate goal of the platform: to increase efficiencies.
-
Standardizing and maintaining data collected from multiple partners can be difficult. Many of the case study agencies found that compiling data that various stakeholders own can present difficulties, since each stakeholder may use a different data format; standardizing this information can take time. For example, the CCC worked with one of its member organizations, the Hillsborough MPO, to create a regional data inventory. The Hillsborough MPO took the lead in compiling information included in the inventory, but found it challenging to identify a standard format for the datasets. OKI found standardizing safety data collected across three different States particularly challenging.
Additionally, it can be difficult to establish data-sharing procedures and ensure information is kept up-to-date. SanGIS, for example, does not currently have a mechanism in place that requires partners to regularly update or share data with SanGIS. OKI has some reservations about expanding its RAVEN911 application statewide because more agencies would have the ability to contribute data to the application; while this would expand RAVEN911’s content, it might be harder to communicate with more data owners about the importance of keeping their information current.
- Partners may have different perspectives on the vision for a regional tool; these perspectives may need to be reconciled. Establishing a common purpose, vision, and goals for regional cooperative efforts are important but can prove difficult. Each stakeholder organization may have its own objectives, priorities, and resources to bring to bear. For example, COMPASS’ member agencies disagreed on which performance measures to include in the 2012 LRTP. COMPASS found it important to work closely with its members to prioritize and achieve consensus on the 50 most important measures. In part, these measures determined which datasets COMPASS and its members are planning to include in their regional data center.
- Organizational structures can affect the pace and extent of regional coordination. Some of the case study agencies noted that certain types of organizational structures have limited the extent to which the region can quickly adapt to new opportunities. For example, SanGIS noted while San Diego County includes 17 other cities in addition to the City of San Diego, none of these cities are part of the SanGIS JPA. While SanGIS would like to pursue partnerships with these and potentially other cities, the JPA agreement does not currently allow for the inclusion of additional partner organizations. SanGIS has been able to work around this constraint by signing an MOU with SANDAG that allows the two agencies to share data, web infrastructure, and support services. On the other hand, the CCC noted that changes in organizational structures may open up new opportunities. The CCC is currently being reorganized and consolidated under TBARTA, which currently provides staff support and other resources to the CCC. The CCC and TBARTA expect that this consolidation will increase efficiencies and may help spur reassessment of how the region can better coordinate geospatial activities.
- Beginning new collaborative initiatives presents unique challenges. Some of the case study agencies reported that obtaining buy-in from stakeholders to participate in regional efforts was more difficult than anticipated. For example, OKI noted that some of the agency’s emergency response partners did not initially understand how an application such as RAVEN911 could be useful. These partners expressed concern that RAVEN911 would not be a success since there were no similar successful initiatives elsewhere in the country to draw upon. As part of its work to develop a shared GIS platform, MAG anticipates the need to work closely with partners to identify shared goals, common data topic areas, and necessary infrastructure to support linking multiple tools already in existence.
Return to Top
3. Case Studies
This section presents in-depth case studies on the transportation agencies that participated in the report interviews. Each case study includes information on how the agency uses geospatial technologies to enhance regional cooperation and the challenges, lessons learned, and benefits encountered during the process to develop and implement the practices described.
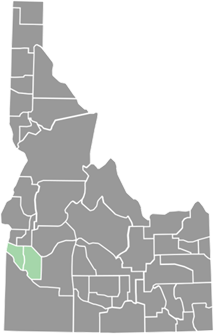
Figure 1. Canyon and Ada Counties highlighted in green (from left to right)
3.1 Developing Tools to Support Regional and Local Planning in the Southwest Idaho Region
Introduction
COMPASS is the MPO that serves a population of approximately 600,000 people in Ada and Canyon Counties in Idaho (see figure 1). Over the past several years, COMPASS and its member agencies have been cooperating to share data using a number of geospatial data tools that are intended to inform both regional and local planning. For example, in 2012, COMPASS and its member agencies used CommunityViz, a GIS-based mapping and visualization software, as part of a visioning process for the agency’s LRTP.9 Using the performance indicators developed as part of this process, COMPASS created the COMPASS Performance Dashboard. This online dashboard contains maps and graphs that allow regional members and the public to see how the area is performing in relation to goals set in the 2040 LRTP. To streamline data collection for this dashboard, COMPASS and its member agencies have started to develop a regional data center, which will function as a central repository for data of regional importance.
COMPASS’ Regionally Focused Geospatial Initiatives
CommunityViz
In 2004, COMPASS led a visioning exercise with its member agencies and the public for Ada and Canyon Counties to determine how to effectively maintain transportation infrastructure and make transportation decisions to serve a rapidly growing region. COMPASS used the feedback from this exercise to inform its 2030 LRTP.
After the 2008 economic downturn and later recovery and growth of the region, decisionmakers engaged in a second visioning process for the region. This second process was conducted as part of COMPASS’ LRTP development in 2012. In order to make the visioning process more interactive, COMPASS used CommunityViz,10 a land-use alternative and impact analysis software, to assist the community in examining regional transportation and land-use scenarios. CommunityViz allowed COMPASS’ member agencies and other visioning meeting participants the ability to visualize and better understand regional impacts that might result from making different levels of transportation investments. The software also allowed the region to prioritize performance indicators that interface with the transportation system (e.g., housing, health, farmland) and set targets for these indicators. These performance indicators were used in COMPASS’ development of a performance dashboard.
COMPASS Performance Dashboard
In fall 2014, COMPASS made the COMPASS Performance Dashboard available to other agencies within its jurisdiction and to the public. The dashboard allows users to see how both the region as a whole and specific geographic areas within the region are progressing compared to performance measures established as part of COMPASS’ 2040 LRTP. COMPASS noted that because of a rapidly growing regional population, its member agencies are experiencing challenges in maintaining their jurisdictions’ infrastructure. The dashboard is primarily intended to help these agencies make decisions that are aligned with community goals without having to request specific data reports from COMPASS. See figure 2.
Figure 2 . Screenshot of the COMPASS Performance Dashboard.
Dashboard users can view a variety of maps organized into eight categories, which reflect the eight goals of the LRTP: transportation, farmland preservation, community infrastructure, economic development, health, housing, land use, and open space. Each map shows data relating to a particular performance measure. Many of the maps also contain a graph that shows baseline data as compared to 2040 targets and a gauge that displays 2013 baseline data as compared to 2040 targets. For example, the sidewalk per roadway mile dashboard (see figure 3) shows that by 2040, the region would like to have sidewalks on 50 percent of its roads, and that by 2013, the region had sidewalks on 44 percent of its roads. Overall, users can choose from 100 data layers, which can be arranged in different ways depending on user need.
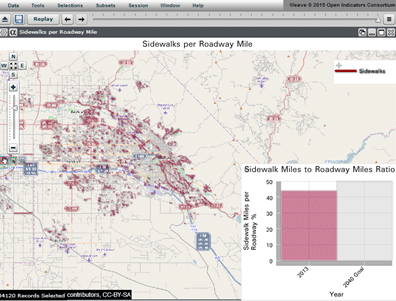
Figure 3 . Screenshot of “Sidewalks per Roadway Mile” performance dashboard
Local agencies can also use the dashboard in conjunction with a checklist when considering whether new real estate developments are consistent with the region’s goals in the 2040 LRTP. The checklist is intended to match local decisions with the regional plan and is especially helpful for small agencies with limited planning or geospatial capabilities make better decisions. The checklist includes 30 “yes” or “no” questions to evaluate whether proposals support the eight goals of the LRTP. For example, the checklist asks whether a project is within a walkshed of schools, parks, grocery stores, or transit stops, goals previously established in the scenario-planning process.
Regional Data Center
COMPASS has always taken the lead in collecting and compiling data necessary for its own and its partners’ planning processes. In order to make these processes more efficient and effective, COMPASS’ committee of regional GIS practitioners, the Regional Geographic Information System Advisory Committee (RGAC),11 decided to develop a web-based regional data center.12 The center helps COMPASS more easily maintain the data presented in the Performance Dashboard and facilitate data-sharing among COMPASS member agencies. Each of COMPASS’ regional partners is responsible for uploading and maintaining its own data on the site, which can be accomplished in a variety of ways (e.g., connection to the server, web, or via Esri software).
COMPASS and its member agencies recently began populating the new regional data center. In general, the center is intended to contain data essential for regional coordination; RGAC is working to prioritize which data to include in the center. For example, to develop its LRTP, COMPASS must have preliminary plat data on which to base population estimates for making forecasts. The data center will include preliminary plat data as well as regional centerline data, which is necessary for emergency services in the region. Thus far, data sharing through the data center has been informal, and no agreements have been signed.
Lessons Learned
COMPASS shared several lessons learned from its efforts, including the following:
- Developing trust is essential to successful coordination. COMPASS has been able to build trust with its member agencies by being responsive to member agency needs. For example, if a member agency finds an issue with its own data, COMPASS will quickly work with the agency to address the gap or problem. This is especially valuable for agencies with smaller staff, which have come to depend on COMPASS as an extension of their staff. By involving regional agencies in the data-sharing process, the agencies also now better understand the reasons behind COMPASS’ requests for data.
- Demonstrating value of data can help encourage agencies to share data informally. The Performance Dashboard has helped member agencies and elected officials understand the value of having quick access to local and regional data. This has reduced the need for formal data-sharing agreements between COMPASS and its member agencies, streamlining the data-sharing process through this tool.
Challenges
- A diverse range of stakeholders made achieving consensus difficult. Member agencies in COMPASS’ region have varying data demands: on one hand, some cities want to conduct sophisticated geospatial analyses. On the other, some have limited or no staff capability to engage in these kinds of analyses. It was challenging for the region to decide on which performance measures to choose for the region during the 2012 LRTP visioning process. Some communities wanted as many measures as possible, while others only had the capacity/staff to consider a few basic measures. COMPASS was able to address the conflict by encouraging member agencies to prioritize the most important data elements, and the region eventually settled on 56 measures.
- Resource constraints can limit how fast regional geospatial initiatives or projects are implemented. COMPASS’ biggest constraint in developing its regional partnerships and initiatives is the amount of time staff are able to dedicate. All regional initiatives are moving forward, but more slowly than originally anticipated. COMPASS was able to hire a consultant to develop the regional data center, but used open-source software for the COMPASS Performance Dashboard,13 which the agency installed and customized itself.
Benefits
COMPASS identified a number of benefits from its efforts, including:
-
Time and cost savings. Previously when developing its LRTPs, COMPASS had to reach out to each member agency to obtain up-to-date data. The regional data center will allow COMPASS to access current data from each agency on demand. This also helps COMPASS when it considers proposed real estate developments in the region. In the past, COMPASS could only help its members assess impacts of the largest developments as it took significant time to find the necessary data and provide feedback. Now COMPASS can provide feedback on many development proposals using the development checklist and Performance Dashboard.
Additionally, by collaborating with and mapping the fiber-optic communications infrastructure owned, operated, and/or leased by a number of organizations in the region, COMPASS and these organizations discovered that taking a collaborative approach to one regional fiber-optic project could save over $600,000 on a $750,000 project.
- Support for agencies with limited resources. The COMPASS Performance Dashboard and checklist allow smaller communities that have few or no planning or GIS staff to understand the local and regional context of their decisions. For example, when considering a large proposed real estate development, communities can use the dashboard and checklist to view the growth of infrastructure that is forecast for an area and consider whether there is sufficient infrastructure to support the proposed development. If not, communities can consider necessary conditions of approval or additional infrastructure needs in the area.
- Tangible tools for bridging local and regional planning. Prior to the regional geodatacenter, performance dashboard, and checklist there was not a systematic way to consider regional applications and information in local decisionmaking. Now, with regional data and tools, local governments can support the goals and performance targets previously identified in the scenario planning process and know if their community and region are moving towards those targets.
3.2 Sharing Regional Geospatial Information to Support Economic and Other Analysis in the South-Central Arizona and Intermountain West Regions
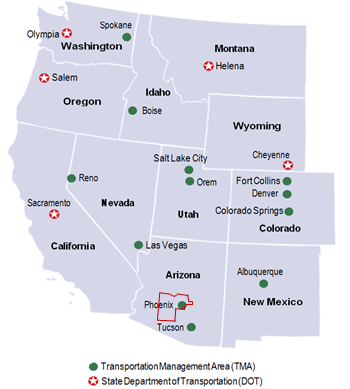
Figure 4. Intermountain West region, with Maricopa County mapped in red
Background
MAG is an MPO and a Council of Governments (COGs) that serves a population of 4.26 million in the Phoenix metropolitan area. In order to improve the economy and address the need for funding for the regional transportation system, MAG formed an Economic Development Committee with the goal of increasing exports and trade through the improvement of transportation infrastructure. The Economic Development Committee works with the Arizona Commerce Authority, the Arizona Mexico Commission, and the Arizona DOT on a variety of issues, including improving relationships with Mexico and Canada, developing increased coordination in the Intermountain West region (see figure 4), and improving the freight network to make Arizona competitive globally. In order to facilitate these goals and support regional transportation and economic analysis, MAG began developing a variety of interactive mapping and analysis applications (detailed below) beginning in 2010.
Based on the success of these applications, as evidenced by their use by various stakeholders in the region, MAG applied for and received Strategic Highway Research Program 2 (SHRP2)14 funding to expand its collaboration with other agencies in the Intermountain West region. The Intermountain West region is home to 7.2 percent of the U.S. population, and is a beneficiary of migration patterns that have made the western and southern U.S. the largest growing regions in the last three decades. The purpose of MAG’s SHRP2 effort is to develop strategies for regional geospatial data-sharing, with the ultimate goal of streamlining implementation of key regional transportation projects in the Intermountain West region. By improving transportation project delivery in the region, which provides important linkages to different regions in the U.S. as well as to Canada and Mexico, MAG and its SHRP2 partners also aim to support the economic health of not only the region but the Nation as well.
MAG’s Mapping and Analysis Applications
After being approached by member agencies with requests to develop tools that more easily share regional demographic data, MAG began developing a variety of mapping and analysis viewers/applications. Each viewer/application addresses a particular theme such as demographics, employment, land use, socioeconomic projections, bikeways, buildings and landmarks, and victim services. The viewers/applications were designed to be user friendly and interactive. Users can select the specific data layers they would like to map (e.g., employment by industry type in the Employment Viewer); customize data views (e.g., changing the base map); and develop reports and analytics by specified geography. MAG developed all of these viewers/applications in-house using Esri products.
The Demographic Viewer and Employment Viewer are two examples of these applications. After receiving continual requests from member agencies regarding population data, MAG developed the Demographic Viewer, which allows users to easily map regional census data. Maricopa County is an air pollution nonattainment area, and employees at large organizations are required to take a trip-reduction survey each year. Approximately 500,000 employees in the region provide data on their home and work locations and commute mode and time. MAG worked with Maricopa County to add questions that would provide data needed to support economic development. For example, the survey now asks about occupational categories. By combining this survey data with the work that MAG and economic development and planning staff from the county’s 25 municipalities use to identify regional employment centers, the Employment Viewer displays the commute sheds for residents and workers in a given community, and can help communities identify opportunities for economic development and business attraction/expansion. See figure 5.
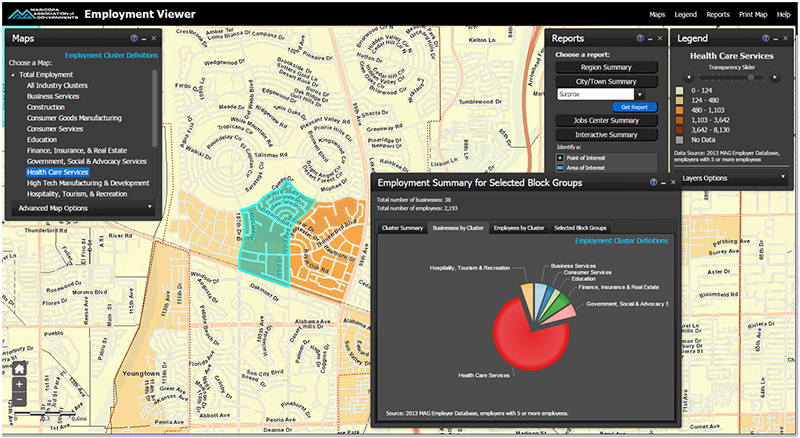
Figure 5. Screenshot from MAG's Employment Viewer
MAG developed the Demographic/Employment Viewer and similar types of viewers/applications primarily to provide member agencies’ planning staff with easily accessible data and analytic capabilities. However, a broader population, including MAG staff and the general public, now use the applications. Additionally, MAG is part of a Joint Planning Advisory Council (JPAC),15 which includes three counties in Arizona: Maricopa, Pima, and Pinal, and their respective MPOs/COGs. The JPAC promotes these and other MAG viewers/applications as tools that support more coordinated planning and economic analysis activities among its members. MAG also uses the viewers/applications to summarize regional data for policymakers. MAG started a training program aimed at helping JPAC members use the applications and has conducted eight training sessions to date.
MAG also routinely works with its member agencies, other Arizona COGs and MPOs, to access and share geospatial data. For instance, MAG has collaborated with a number of MPOs in the Intermountain West region on socioeconomic modeling and travel demand modeling activities. MAG is also working with SANDAG to build a joint regional econometric model. The two agencies are pooling funds and have signed a memorandum of understanding (MOU).
SHRP2 Project
Due to its perceived success in developing various mapping and analysis applications and collaborating with other regional agencies to share geospatial data, MAG applied for and received $240,000 in SHRP2 implementation assistance funding to carry out strategies developed under the SHRP2 research product C19: Expediting Project Delivery.16 The funding supports MAG in expanding cooperative efforts with other agencies in the Intermountain West region to advance deployment of solutions that expedite transportation project delivery in the region. The specific goals of the SHRP2 C19 MAG effort are to:
- Conduct outreach to key stakeholders to identify needs and potential gaps related to transportation and data resources.
- Develop a common GIS operating vision/platform to improve data and information sharing, reduce data redundancies, and inform transportation decisionmaking across the Intermountain West region.
- Align expectations for a long-range vision to move people and goods in the Intermountain West region.
- Develop a report containing a risk register, which will be an analysis of risk levels associated with delivering a transportation project driven by spatial data and metrics identified during the collaboration process.
The core of MAG’s SHRP2 C19 effort is developing the common GIS operating vision/platform. To kick off this piece of the effort, the MAG SHRP2 team17 is assessing available GIS data resources throughout the region; identifying potential data conflicts, standards and gaps; and developing methods for sharing data. MAG has held webinars and conducted a survey of regional agencies to assess their available GIS data resources. During the webinars, participants can showcase their existing tools to help the SHRP2 C19 project team consider various options for developing a common GIS platform.
MAG anticipates that the common platform, which will most likely be provided for public use, will have a similar “look and feel” to MAG’s existing viewers, and contain both mapping and reporting features. It will provide the ability to visualize data at a high level across the region, and will include datasets such as transportation, crucial habitats, demographics, and employment information.
A report containing a risk register will be the final piece of the MAG SHRP2 C19 effort, which will be complete in spring 2016. The risk register will identify potential risks and their impacts that can present challenges to successful implementation of a transportation project in the region. Risks could include unplanned events such as cost increases, unexpected archeological findings, and insufficient funding.
MAG is reaching out to the directors and technical staff at each of the 12 Intermountain West Transportation Management Associations (TMAs) and to the MPOs that serve as TMAs within the region through the Intermountain West MPO Director meetings to gauge interest in participating in all aspects of the C19 effort. Furthermore, MAG is contacting all of the State DOTs within the Intermountain West region to inform them of MAG’s SHRP2 C19 efforts. MAG is also working with the Western Regional Partnership (WRP) to provide a broader reach to other Federal agencies, possibly increasing the SHRP2 team’s access to additional regional datasets.
Benefits
Although MAG’s geospatial coordination efforts are ongoing, the agency believes its activities have already led to important benefits, including:
- More informed analysis and decisionmaking for multiple stakeholders. For example, MAG’s Employment Map Viewer helps transportation planners better understand commuting patterns in the region. Businesses can also access the tool to identify where to locate or retain employees. MAG noted that a local nonprofit organization realized that a modified version of MAG’s Demographic Viewer could help it to compare literacy, school performance, and demographics to support decisionmakers in prioritizing school investments.
- Improved ability to geospatially visualize projects and identify their broader impacts. MAG notes that while the agency does not often need to work on transportation projects that cross State lines, it often requires data from other States to understand how the project will fit into the “big picture.” Overall, MAG believes that it is important that all decisionmakers have access to the same data in order to fully understand the implications of their decisions and investments.
- Better assessment of data gaps. By participating in the MAG SHRP2 C19 effort, MAG expects that partner agencies will be able to more easily identify missing datasets and take steps to address these gaps. For example, MAG has found that many of the agencies participating in MAG’s SHRP2 C19 effort do not have comprehensive geospatial data on topics such as current and future land use or employer/job locations in rural areas. By encouraging agencies to inventory existing data, the effort may provide an incentive for agencies to generate or share data to fill these and other gaps.
Challenges
- Staff and other resources are limited. While a number of agencies in the Intermountain West region have expressed interest in participating in MAG’s SHRP2 C19 efforts, staffing is a major concern. Many agencies have limited staff capacities and are focused on meeting current responsibilities; they have concerns about being overburdened by additional coordination. To address these concerns, MAG works to ensure partners understand the goals of the MAG SHRP2 C19 initiative, which are to help agencies do business without creating excess work.
- It can be difficult to identify coordination opportunities. A number of stakeholders and groups across the Intermountain West region are already collaborating to create and share regional datasets. For example, the Western Governors’ Association recently launched the Crucial Habitat Assessment Tool (CHAT), which contains maps that display wildlife habitat and corridors across the region. MAG believes that there may be opportunities to link its planned common GIS platform with CHAT or other types of regional geospatial tools. However, this can be difficult: it can take time to identify shared goals, common data topic areas, and the necessary data infrastructure (including metadata formats and data governance guidelines) to support linking multiple tools.
Next Steps
MAG has not yet developed formal performance measures or metrics to assess its geospatial tools, but has received very positive feedback on its individual mapping and analysis applications. Other agencies and users have expressed interest in seeing MAG develop similar tools for the region to more easily share and visualize regional datasets. MAG intends to complete its work under SHRP2 C19 by early 2016.
Back to Top
3.3 Developing Tools for Regional Emergency Management and Transportation Planning for Counties in Three States
Background
OKI is the MPO for eight counties in the greater Cincinnati region, including counties in Ohio, Indiana, and Kentucky. In recent years, OKI has developed several GIS web-based tools to meet the needs of its member agencies. In addition to providing new functionality and efficiencies to local partners, these tools benefit OKI and the region as a whole by streamlining internal processes and building regional relationships. This case study focuses on two of the tools that OKI has recently developed:
- Regional Asset Verification and Emergency Network (RAVEN911), a web-based mapping system with geospatial components primarily designed for use by emergency responders.
- Project Application Assistant, a tool that streamlines the application process for OKI’s members to obtain transportation funding by giving local jurisdictions access to OKI’s transportation data.
RAVEN911
In 2008, Hurricane Ike hit the Cincinnati region with 80 mile-per-hour winds and left 90 percent of the region without power. The hurricane highlighted gaps in the region’s emergency response abilities. In particular, regional datasets on critical infrastructure and assets did not exist or lacked crucial information. In the storm’s aftermath, the Cincinnati Fire Department, Homeland Security Unit, and Hamilton County Emergency Management Agency (EMA) sought the technological expertise of OKI to expand GIS data coverage for the region to help fill in many of these data gaps. The partners developed an MOU that guided the development of new datasets and a web-based application for accessing the data. The partners secured Homeland Security funding for the effort.
The resulting application, RAVEN911, is a web-based mapping system with geospatial components that is primarily designed for use by emergency operators in the OKI region. RAVEN911 includes accurate, up-to-date geospatial data on critical infrastructure for Greater Cincinnati’s 12-county Urban Area Security Initiative (UASI) region. Using RAVEN911, emergency responders can easily view locations and key information for schools, hotels, power plants, hospitals, police and fire stations, and many other types of features.
In addition to providing access to regional geospatial data on critical infrastructure, RAVEN911 includes a number of geoprocessing widgets designed to help emergency operators conduct GIS analyses on the fly. RAVEN911 has widgets for hazardous waste spills, propane tank explosions, missing person searches, and bank robberies, among others. These widgets streamline emergency response workflows and reduce potential for human error. For example, prior to RAVEN911, if a bomb threat were to occur, many EMAs would have determined the appropriate containment zones by measuring a radius by hand on a paper map. RAVEN911 now provides responders with a streamlined workflow for identifying and implementing necessary protective zones. Using RAVEN911, EMAs can access various widgets to more quickly identify the geographic impact of an explosion and identify any necessary containment zones, street closures, or evacuation routes. RAVEN911 can also assist EMAs with assessing the extent of chemical spills as well as transportation and other impacts (see figure 6).
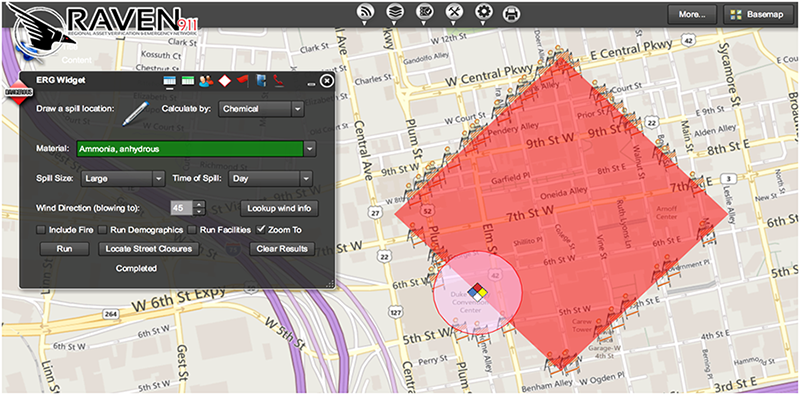
Figure 6. RAVEN911 displays the isolation and protective zones for a hypothetical anhydrous ammonia spill in downtown Cincinnati. The ERG widget, shown here, looks up the appropriate buffer distances based on information the user enters about material type, spill size, time of day, and wind direction. (If necessary, RAVEN911 can pull wind data from nearby weather stations). RAVEN911 calculates necessary street closures and generates a list that can be exported to Excel. Before RAVEN911, emergency responders would consult the 392-page Emergency Response Guidebook for isolation and protective zone sizes, and then draw buffers and identify street closures by hand. RAVEN911 now provides responders with a streamlined workflow for identifying and implementing necessary protective zones. In the example shown above, 44 street closures would be needed.
RAVEN911 was designed to reduce emergency responders’ need to switch between multiple websites to streamline fact-finding and decisionmaking in emergency response situations. RAVEN911 integrates Google Street View, Bing Bird’s Eye imagery, stream gauge data, weather radar, and social media sites including Twitter, Instagram, and Flickr. For example, Ohio State Police use RAVEN911’s social media feeds to monitor crowd behavior during certain football games and identify potential security impacts.
OKI has primary responsibility for maintaining RAVEN911 in partnership with local EMAs. RAVEN911 relies on local agencies to collect base data like streets and critical infrastructure. OKI then standardizes different data formats, appends additional attribute data, and publishes a regional dataset. For example, local agencies send OKI updated street centerlines, and OKI adds speed limits and functional classifications. All data included in RAVEN911 have been validated by partner agencies or through field collection by light-duty City of Cincinnati firefighters. Most data are updated annually.
RAVEN911 is available free of charge to emergency providers in the following disciplines: fire and emergency medical services, law enforcement, hazardous materials, communications, public health, hospitals, public works, and emergency management. To access RAVEN911 data, users must first submit a registration request, which OKI must approve.
Representatives from the City of Cincinnati Fire Department, the City of Cincinnati Police Department, and OKI comprise the core team for maintaining and updating RAVEN911. In the immediate future, the RAVEN911 team does not have any major expansions planned for the tool. However, the team plans to continue to maintain datasets and respond to user feedback and requests.
RAVEN911: Benefits
OKI believes that RAVEN911 has led to significant benefits in promoting better regional coordination. OKI has leveraged RAVEN911 to gather regional data more efficiently, strengthen relationships with local jurisdictions, and build OKI’s regional reputation:
- More efficient regional data collection. OKI’s development of RAVEN911 allowed the agency to more efficiently collect regional data needed by emergency operators and transportation professionals. For example, both OKI and EMAs need to know where schools are located—OKI because schools generate traffic and EMAs because schools are critical infrastructure. Some data that is less important to OKI, like school contact information, is critical to EMAs. In developing the datasets included in RAVEN911, OKI was able to leverage Homeland Security funding to collect all needed data at once.
- Strengthened relationships with emergency management partners. Prior to RAVEN911, OKI had GIS data-sharing relationships with county governments but not with EMAs. As a result of RAVEN911, OKI now has contacts with EMAs across the region. According to OKI, RAVEN911 has strengthened its working relationships with partners and improved all agencies’ abilities to access and share geospatial information.
- Regional reputation. OKI believes that RAVEN911 has led to important successes particularly in helping to build OKI’s regional reputation, helping the agency demonstrate its ability to collaborate with partners, and more effectively meet the needs of its members.
RAVEN911: Challenges
- Initial concerns from regional partners. Early on in the development of RAVEN911, some partners expressed concern about the usefulness of the tool. In particular, some emergency response providers were not sure that OKI would be able to keep all of RAVEN911’s data on key infrastructure up to date. Previous efforts by other agencies to compile regional data for emergency responders had not gained traction. Consequently, OKI and its partners faced difficulty in convincing agencies to share data. However, RAVEN911’s capabilities and the commitment of the RAVEN911 team helped demonstrate the tool’s power to potential users.
- Lack of examples nationwide. OKI believes that RAVEN911 is one of the first tools of its kind in the country. When OKI began to design RAVEN911, the project team found few models elsewhere that developers could use as a starting place; the team designed the tool around EMAs’ core needs and expanded it as necessary over time.
- Requests to expand. Several States and regions have approached OKI to learn from OKI’s experiences. For example, the Ohio Homeland Security and Ohio State Patrol have expressed interest in expanding RAVEN911 for statewide emergency management. However, the RAVEN911 team has concerns that expanding the tool might make it more difficult to keep some data up-to-date.
Project Application Assistant (PAA)
Every two years, OKI asks local jurisdictions to submit applications to obtain surface transportation project funding as part of developing the region’s Transportation Improvement Program (TIP). These applications ask applicants to provide technical data about traffic counts, level of service, environmental justice populations, and accident rates for the project location, among other data. OKI uses the submitted data to score projects according to a set of criteria and prioritize projects for funding.
OKI developed the Project Application Assistant (PAA) in 2009 to streamline the TIP project application process for local jurisdictions. The PAA is an online mapping application that is pre-populated with regional data on level of service, annual average daily traffic, truck average daily traffic, roadway classification, accident rates, and environmental justice populations. Users identify project locations by clicking on appropriate roadway segments and entering required information such as project name and sponsor jurisdiction. Using the digitized project location, the PAA displays a variety of transportation data that makes it easier for local jurisdictions to complete their funding applications and understand how applications will be scored.
The PAA was developed in-house by OKI and uses ArcGIS Viewer for Flex.18 Local jurisdictions are required to use the tool when submitting applications for TIP funding. OKI updates data in the PAA before each call for applications but does not have major upgrades or expansions planned for the immediate future.
PAA: Benefits
-
Streamlined process for preparing application. Local jurisdictions can benefit from a streamlined process for gathering the data needed to complete a funding application. With a few clicks, users can access OKI’s data and spend less time preparing their applications. Prior to having this tool, jurisdictions were required to search multiple places to find relevant transportation data and manually enter all project data into a hard-copy application.
Smaller jurisdictions with fewer GIS staff may benefit the most from the PAA’s streamlined application process. For example, the City of Cincinnati, which has a full-service engineering and design team in-house, noted that the PAA has not resulted in significant time savings for the City. The City of Cincinnati believes that this is because its staff still need to validate the PAA’s data against the City’s database and supplement the PAA’s data with additional information where available.
- Increased scoring transparency. In addition to displaying relevant transportation metrics, the PAA shows scores for each criterion used to prioritize projects for inclusion in the TIP. This provides local jurisdictions with more transparency into OKI’s decisionmaking processes, leading to better and more efficient regional communication. For example, the City of Cincinnati uses the PAA to screen potential projects before submitting to OKI; according to the City, the tool has helped the City to better and more easily identify and prioritize those projects that are most competitive for TIP funding.
Streamlined application review process. The PAA streamlines OKI’s application review process by reducing the amount of time that OKI spends verifying project application data. Before development of the PAA, applications often contained out-of-date or incomplete data. OKI GIS technicians would need to verify the information and resolve any discrepancies.
Additionally, before the PAA was used, local jurisdictions were not required to submit geospatial data showing their project location. To map the locations of potential projects, GIS technicians at OKI had to digitize each project from the descriptions in applications. This often required OKI staff to verify details about the project extent with the submitting jurisdiction. With the PAA, submitting jurisdictions save their project locations directly to OKI’s geodatabase. Now, OKI can map all project application locations in minutes, a task that previously took days.
- Better relationships with local jurisdictions. According to OKI, local jurisdictions appreciate how the PAA has streamlined the funding application process. In OKI’s view, the PAA contributes to building relationships with member jurisdictions. The City of Cincinnati noted that it appreciates OKI’s leadership in promoting technologies that support regional collaboration through tools like the PAA.
PAA: Challenges
- Data formatting and consistency. In building the PAA, OKI found it difficult to link various types of transportation data to specific street segments. For example, OKI needed to develop a methodology for assigning traffic count data (unevenly distributed point data) to street segments. Another challenge was ensuring that data compiled from three States was consistent; Indiana, Ohio, and Kentucky each use different processes for collecting safety data.
Range of user needs and capabilities. Although the PAA fits the needs of most jurisdictions, it does not include all data that jurisdictions may wish to use for their TIP applications. For example, the PAA includes data summarized by street segment. If a jurisdiction wants to emphasize level of service at a particular intersection, that information is not available in the PAA. According to the City of Cincinnati, its TIP applications sometimes include data from the City’s GIS database because the City’s data are at a finer resolution than the data included in the PAA. OKI recognizes that the PAA does not include all relevant data and allows jurisdictions to submit supplemental data with their TIP applications.
Furthermore, OKI designed the PAA specifically for the TIP application process, and as such some users find the PAA challenging to use for data exploration.
Overall Lessons Learned
- Success depends on the commitment of partners. OKI believes that a key success factor for RAVEN911 was ensuring effective collaboration with partners. Throughout the development of RAVEN911, OKI’s strong working relationships with EMAs were crucial to help establish the tool’s credibility. OKI also found that it was important to hold trainings to help demonstrate use of RAVEN911 and promote the tool’s capabilities.
- Earn stakeholders’ trust. According to OKI, a major factor in the success of the PAA has been OKI’s regional reputation as an “honest broker.” Additionally, for the RAVEN911 tool, it was important to demonstrate a long-term commitment to data maintenance and customer responsiveness to show potential users that the tool was sustainable. Now that the RAVEN911 team has established a multi-year track record of updating data, responding to requests, and conducting trainings, EMA users are more responsive to OKI’s data requests.
- Design the tool to fit partners’ needs. Initially, OKI conceived of RAVEN911 as a more fully featured—and more complex—mapping tool. About six months into the development of RAVEN911, OKI decided to instead focus on usability and simplicity in order to better serve the tool’s primary user base—emergency responders with limited experience with GIS. The design team selected ArcGIS Viewer for Flex as the platform for RAVEN911 because of the team’s view that it offered a user-friendly interface. While developing the tool, designers met with a variety of emergency responders to understand their needs. As a result of OKI’s efforts to make RAVEN911 as intuitive as possible, RAVEN911 requires minimal initial or refresher training.
Regional leadership can provide momentum for further coordination. According to OKI and the City of Cincinnati, local governments in the region appreciate OKI’s leadership in advancing geospatial technologies and partnerships that support regional cooperation. For example, the City of Cincinnati noted that OKI’s leadership allows the City to leverage OKI’s investment rather than starting from the beginning. In addition, OKI’s successful track record of providing regional geospatial tools like RAVEN911 and PAA gives OKI a springboard for developing future tools and collaborative efforts. OKI is currently developing a performance measure scorecard that will track transportation and sustainability metrics across the region.
Back to Top
3.4 Developing a Regional Data Warehouse for the City and County of San Diego, California
Background
SanGIS is a JPA of the City of San Diego and the County of San Diego that seeks to collect, maintain, and share accurate and accessible geospatial data about the San Diego region. SanGIS has three primary functions:
- Maintain core land-based GIS data for the extent of San Diego County. SanGIS maintains 18 layers in house, including data on parcels and roads.
- Manage a GIS data warehouse for JPA partners and local jurisdictions. SanGIS manages a clearinghouse of more than 510 GIS layers. These layers are owned and maintained by a variety of stakeholders across the region, including SanGIS itself, the City of San Diego, County of San Diego, SANDAG, and other jurisdictions.
- Provide public access to GIS data for the San Diego region. A subset of the layers in the GIS data warehouse is freely available to the public through SanGIS’s website through a Regional Data Warehouse.19 As of April 2015, approximately 300 layers are publicly available.
In 1984, the City and County of San Diego initiated a multi-agency project to more efficiently deliver geospatial data to the San Diego region. The resulting program, the Regional Urban Information System (RUIS), provided more than 200 GIS layers to local governments and the general public. RUIS was managed by the City of San Diego in collaboration with the County. In 1997, the City and County formalized RUIS as a JPA and changed the name to SanGIS.20
Although the City and County of San Diego are the two owners of SanGIS, SanGIS has formal and informal agreements with several other government agencies. In 2010, SanGIS signed a memorandum of agreement (MOA) with SANDAG to facilitate GIS data sharing and in-kind services.21 SanGIS also has a number of joint funding agreements with United States Geological Survey (USGS) for specific projects and serves as the regional data steward for the USGS National Hydrography Dataset (NHD).22 Local governments work with SanGIS to provide local data, adapt SanGIS’s regional data to meet local needs, and ensure consistency between datasets.
Moving forward, SanGIS staff plan to make regular improvements to the data warehouse and data layers in response to user needs and technological changes. SanGIS currently does not track any formal performance measures, but staff plan to incorporate performance tracking into regular business practices. For example, an upcoming change to the public-facing Regional Data Warehouse will require users to register to download data. This will allow SanGIS to gather information about who is accessing information from the warehouse.
Benefits
- SanGIS facilitates coordination between agencies and results in less duplication of GIS work. One of the primary motivations for the formation of SanGIS was to reduce duplicative GIS work by City and County staff. Prior to the formation of SanGIS, both the City and County maintained layers for streets. The creation of the JPA allowed the two jurisdictions to pool and leverage their GIS resources while creating a single system that could be used by both agencies.
- Similarly, SanGIS’s MOU with SANDAG allows SanGIS and SANDAG to more efficiently provide public-facing regional GIS services. For example, SanGIS and SANDAG collaborate to provide a parcel lookup web mapping application (see figure 7).
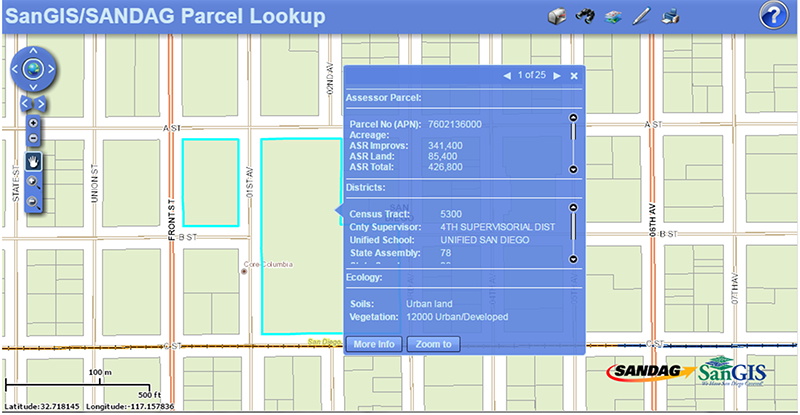
Figure 7. Parcel Lookup Tool is an example of how SanGIS and SANDAG use their MOU to collaborate to provide regional geospatial services. SanGIS provides the parcel data, and SANDAG maintains the web infrastructure for the application. The Parcel Lookup Tool is available at https://sdgis.sandag.org/.
- SanGIS’s data warehouse reduces the barriers to data-sharing between agencies and departments. SanGIS provides a single, centralized repository for geospatial data that pertain to San Diego County. Many of the data layers available in the SanGIS data warehouse are created and owned by different departments or offices in the County or City of San Diego. The SanGIS warehouse allows users to share data with one another without having to establish multiple data-sharing protocols. For example, the City of San Diego Planning Department uses GIS data on parcels and parks (among many other data layers). Without the SanGIS data warehouse, the Planning Department would have to coordinate with the County Assessor’s Office for parcel data and the County Department of Parks and Recreation for park data. Additionally, using the SanGIS data warehouse, departments only need to share data with one agency and it is available to all others. Through the use of automated transfer scripts, departments send data to SanGIS on a weekly or monthly basis, and SanGIS automatically uploads the new data to the data warehouse, where it is available to other departments and agencies.
- SanGIS provides the public with more streamlined access to data. More than 60 percent of SanGIS’s layers are freely available to the public through the Regional Data Warehouse. According to SanGIS staff, the online Regional Data Warehouse has almost eliminated public records requests for GIS data received by the City of San Diego and the County of San Diego.
- SanGIS provides a forum and a framework for regional data quality improvement projects. Local jurisdictions, many of which have more limited GIS budgets, have approached SanGIS to share ideas for data quality improvement projects. For example, the City of Carlsbad approached SanGIS to request an update of SanGIS streets data. SanGIS worked with the City of Carlsbad to update the SanGIS streets layer to meet Carlsbad’s needs. As a result of the effort, the City of Carlsbad now uses the SanGIS streets layer for official purposes and no longer maintains a separate streets layer for the City of Carlsbad. According to SanGIS staff, these types of data enhancements are particularly helpful for jurisdictions with more limited geospatial data resources, as they permit multiple stakeholders to access and share information at low or no cost. GIS practitioners at jurisdictions across the region also benefit from improvements to the accuracy and completeness of regional GIS layers.
- SanGIS provides the region’s GIS practitioners with a clear point of contact for questions about regional GIS data. SanGIS users, including local jurisdictions, educational institutions, and private companies, have expressed to SanGIS that they appreciate having a “one-stop shop” to find and ask questions about regional GIS information.
Challenges
- It can be difficult to find a sustainable funding source. When SanGIS was formed, the JPA generated about one-third of its operating revenue through data subscriptions. In 2005, the California State Attorney General issued an opinion that GIS data were part of the public record. As a result, SanGIS shifted from charging subscription fees for data to the current system, in which data are made available for free. Currently, SanGIS has an annual budget of approximately $1.5 million and is funded entirely by the City of San Diego and the County of San Diego. SanGIS staff noted that having limited funding has made it more difficult to pursue all of its GIS project priorities.
- It can be difficult to keep data up to date. Most GIS layers in the SanGIS data warehouse are maintained by local partners rather than by SanGIS itself. Currently, SanGIS does not have a mechanism in place that requires partners to regularly update or share data with SanGIS, these activities are voluntary. To address challenges with data maintenance, SanGIS issues regular reminders to encourage data owners to provide updated layers. SanGIS staff noted that strong working relationships with GIS managers at JPA and non-JPA jurisdictions have helped encourage data owners to maintain their layers.
- The organizational structure of SanGIS makes it difficult to grow the organization. San Diego County includes 17 other cities in addition to the City of San Diego; none of these cities are part of the JPA. Although SanGIS is interested in formalizing new partnerships with jurisdictions not currently part of the JPA, the JPA agreement does not currently allow for the inclusion of any additional partner organizations. Adding more partners to the JPA would require rewriting the agreement, which SanGIS staff believe may not be politically viable at this point in time.
- High workloads and diverging missions at partner agencies make it difficult to build a regional vision. SanGIS projects and priorities—such as increasing regional data collaboration—may sometimes become lower priorities for busy GIS staff at partner agencies, which are focused on their own agency priorities and business needs. SanGIS staff noted that GIS mangers at local jurisdictions have their own missions, program objectives, budget limitations, and priority projects that may differ from those of SanGIS.
Lessons Learned
- Build strong working relationships. SanGIS relies upon having strong working relationships between SanGIS staff and GIS managers at local jurisdictions to keep data updated and identify opportunities for data improvements. SanGIS staff noted that these relationships are particularly important given that data owners share information with SanGIS solely on a voluntary basis.
- Shifts in external legal or policy frameworks can have major implications for funding and operating a JPA. The 2005 California legal decision required that SanGIS drastically reduce subscription fees, which had accounted for a large portion of the agency’s budget. According to SanGIS staff, this decision reduced SanGIS’s revenue recovery but increased regional collaboration by making more data publicly available. The shift away from relying on subscription fees helped foster a regional culture of cooperation and open data.
When setting up legal frameworks for a regional data-sharing entity, consider how the partnership might grow in the future. According to SanGIS staff, the JPA for SanGIS may hinder the agency’s ability to serve as a regional agency, because legally only the City and County of San Diego are considered full partners in SanGIS. SanGIS staff recommends that other agencies considering developing JPA agreements include provisions for adding new jurisdictions.
SanGIS staff noted that MOAs can provide a way to partner with agencies that are not part of a JPA. For example, SanGIS has an MOA with SANDAG that allows the two agencies to share data, web infrastructure, and data support services. The MOA allows the two agencies to exchange in-kind services on collaborative projects. However, SanGIS staff recommended that other regions considering an MOA set realistic goals and allow plenty of time, as developing these agreements can take time.
Additional Documentation
3.5 Developing a Regional GIS Inventory in the West Central Florida Region
Background
The West Central Florida MPO Chairs Coordinating Committee (CCC) was created in 1993 as the regional coordinating body for the MPOs and TPO in the West Central Florida area.23 It serves a total population of 4,321,000 across an eight-county area.
The CCC is currently staffed through an agreement with the Tampa Bay Area Regional Transportation Authority (TBARTA).24 While TBARTA and the CCC are distinct entities, TBARTA provides staff support organizational infrastructure, and other resources to support the CCC. The CCC is currently being reorganized and consolidated under TBARTA.25
The CCC has undertaken several regional GIS coordination efforts over many years that have involved close collaboration among CCC members, TBARTA, local governments, and the Florida Department of Transportation (FDOT).
Regional Geospatial Cooperation Efforts
Each of the CCC’s members had its own GIS datasets that covered a variety of topic areas such as characteristics of highway and mass transit networks. However, these varied in degree of detail and coverage, and there was no specific application that could support a regional-level analysis (e.g., an assessment of regional highway congestion levels). To help address these needs, the CCC formed a Regional GIS Committee (Committee) in the late 1990s. This Committee provided a forum to discuss what existing data resources could be leveraged for regional analysis; identify where there were data gaps; and coordinate on appropriate next steps, including how to increase the region’s GIS data coverage. More generally, the Committee sought to foster stronger working relationships than had previously existed among the CCC’s members.
The Committee’s first effort was to develop a baseline of existing geospatial data and tools. The Hillsborough MPO subsequently volunteered to use its resources and capabilities to compile existing GIS layers from the CCC’s members into a regional data inventory, standardize the layers according to a common format, and make them accessible to members via distribution to the CCC’s committees. The Hillsborough MPO has continued to internally host the regional GIS inventory and produce geospatial mapping products on an as-needed basis. However, data owners are responsible for maintaining their own layers and informing the Hillsborough MPO when there are updates. The Hillsborough MPO also maintains its own GIS maps and data website for geospatial information focused on Hillsborough County. The website makes a variety of mapping tools and layers publicly accessible. An example tool is the Planning Information Map App (PIMA), an interactive, web-based mapping application for viewing land use, transportation, environmental, and other planning-related map layers and data.
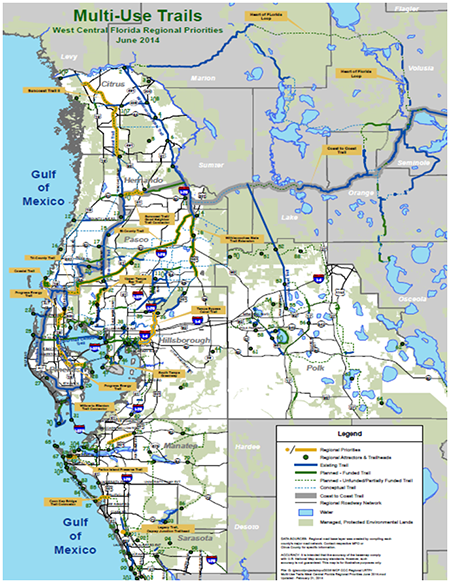
Figure 8 . Portion of multi-use trail map, a component of the CCC’s LRTP, developed with analysis of regional GIS datasets.
In 2005, FDOT established the Transportation Regional Incentive Program (TRIP), which provides matching State funds for transportation facilities identified as regionally significant. TRIP had several implications for the CCC. Most significantly, it encouraged the region’s MPOs/TPO to place additional emphasis on the CCC’s role as a regional coordinating body. This helped the CCC strengthen its collaboration among its members to expand and enhance the geospatial data inventory. Currently, the layers are available primarily to the CCC’s members through the inventory but others may request access. See figure 8.
Other initiatives provided further momentum for developing West Central Florida’s regional GIS resources. For example, in 2009, the CCC’s members conducted an extensive and comprehensive update of West Central Florida’s LRTP, which included detailed maps of regional transportation networks and facilities, including the highway and transit systems as well as multi-use trails. With support from a consultant, the CCC was able to collect a variety of new geospatial data and update existing datasets to develop this regional LRTP. These efforts substantially enhanced and expanded the regional data inventory. The CCC has also consolidated its website with TBARTA to provide links to key datasets from various CCC members.
The CCC’s members have not developed formal documentation to outline policies for how data are collected or shared across the region. Instead it has relied primarily on strong working relationships with members to encourage contributions to the regional data inventory. Overall, the CCC believes it is the confluence of Federal and State emphasis areas that strongly encourage regional data collection, visualization, and geospatial information exchange in West Central Florida.
Ongoing Efforts and Next Steps
In cooperation with TBARTA, the CCC works to support regional analysis of data to develop various planning documents and studies (and also works with private consultants for these efforts). For example, TBARTA assisted the CCC in developing the 2012 Regional Congestion Management Process. As another example, TBARTA is now updating the 2015 Regional Transportation Master Plan as required by Florida statute every two years using data developed by the CCC. By using the layers from the regional data inventory for both the Master Plan and regional LRTP, the CCC has significantly enhanced the region’s ability to produce planning documents that are compatible in style and format.
The CCC’s members rely on the regional GIS inventory hosted by the Hillsborough MPO as the primary, centralized source for regionally focused geospatial information. The CCC has not yet developed any public-facing tools that would permit users outside the CCC or the public to easily access the information. Additionally, while some of the CCC’s members have their own mapping tools, there are no regional-level resources for data visualization. The CCC expects that the pending consolidation with TBARTA will likely spur a stronger focus on developing such public-facing or visualization tools. The CCC also anticipates that the consolidation would present new opportunities to assess how the region could better coordinate geospatial activities.
Challenges
- Data standardization. Initially, each of the CCC’s members used individualized data formats to support its own planning programs. Furthermore, the Regional GIS Committee had found that the CCC’s members used different arrangements for data collection and compilation. Some members relied on local jurisdictions to lead GIS data collection efforts while others collected their own data. Determining who at each MPO/TPO was responsible for data collection, what information was available, and whether data could be shared with others was labor intensive. The Committee spent significant amounts of time and effort to support the Hillsborough MPO in standardizing the layers in the regional inventory to ensure a high level of quality for mapping produced using the inventory, an effort that is ongoing.
- Data alignment. The CCC has found that existing data resources may focus on geographies that do not correspond to the West Central Florida area, and as a result there is some amount of “clean up” or realignment that must occur before a data user can feel confident in the outcomes of an analysis. For example, the CCC obtains some data from FDOT Districts 1 and 7 for various planning documents or studies, a geographic area larger than just West Central Florida. Before the CCC can confidently use FDOT’s data it must ensure the information is correctly parsed for the study area. As a result of multiple data realignments over time, the CCC has now produced regional analyses that yield a high degree of geographic continuity.
- Reliance on one “data keeper.” At different times the CCC has considered housing the regional data inventory or developing other CCC-branded tools, but has decided that these would be difficult to maintain. While the Hillsborough MPO has played an important role as the host of the regional inventory, reliance on one organization can come with challenges, such as placing increased demands on one organization’s time and resources, as well as increasing the potential for conflicts with other production priorities. The Hillsborough MPO noted that the pending consolidation with TBARTA might present opportunities for reassessing whether TBARTA could house the data inventory on its website. Overall, both the CCC and Hillsborough MPO expect the pending consolidation with TBARTA will lead to increased efficiencies with data sharing and accessibility across the West Central Florida region.
Benefits
- Improved communications and information accessibility. Prior to creating the CCC Regional GIS Committee, there was no standing regional venue for geospatial coordination; members would exchange information on an ad hoc basis. While the Committee currently meets informally when needed, its establishment initially helped improve communications and working relationships among all of the CCC’s members. Furthermore, as the CCC’s members began to more regularly share and update their data layers using the inventory, trust and confidence in the data has grown and has provided further momentum for improved communications.
- Increased efficiencies. The regional data inventory has made it easier for the CCC’s members to find information that previously existed in disparate locations or did not exist at all. As a result of this inventory, as well as the CCC’s regional data-sharing through planning documents, the CCC has been able to more quickly and easily identify existing data resources and data gaps. This has streamlined the process for identifying regional data needs and how they can best be addressed.
Lessons Learned/Success Factors
- Identify a coordinator to carry out an initiative. Initially, it was difficult for members to take on the task of collecting GIS information and producing regional mapping in addition to their other ongoing work. The CCC believes that the Hillsborough MPO’s willingness to compile and host the region’s geospatial data was key to developing the regional data inventory, and subsequently helped spur other cooperative activities among the CCC’s members.
- Development of robust geospatial data and analyses can increase an organization’s credibility. The CCC believes that its efforts to enhance regional-level data and develop robust regional geospatial analyses have helped the region better identify transportation priorities, more effectively leverage Federal and State transportation dollars, and make more informed decisions overall. With access to sound GIS data, the CCC was able to develop a comprehensive analysis of priority inter-county multimodal corridors that has also resulted in an improved picture of the state of the regional transportation system. These analyses are reflected in the Master Plan and regional LRTP being developed by TBARTA in cooperation with the CCC.
Additional Documentation
- 2014 interlocal agreement between the CCC’s members is available at www.tbarta.com/en/administrative-documents/about/administrative-documents (content no longer available).
Return to Top
Appendix A. List of Interview Participants
| Agency |
Name |
Title |
Work Phone |
Email |
| City of Cincinnati |
John Brazina |
Principal Engineer |
(513) 352-6249 |
John.Brazina@cincinnati-oh.gov |
| Bryan Williams |
Engineer |
(513) 352-4506 |
Bryan.Williams@cincinnati-oh.gov |
| COMPASS |
Eric Adolfson |
Principal Planner, GIS |
(208) 475-2245 |
EAdolfson@compassidaho.org |
| Hillsborough MPO |
Roger Mathie |
Senior GIS Analyst |
(813) 273-3774 x352 |
MathieR@plancom.org |
| MAG |
Denise McClafferty |
Regional Program Manager |
(602) 452-5033 |
DMcClafferty@azmag.gov |
| Anubhav Bagley |
Information Services Manager |
(602) 254-6300 |
ABagley@azmag.gov |
| Dennis Smith |
Executive Director |
(602) 254-6300 |
DSmith@azmag.gov |
| OKI |
Dave Shuey |
GIS Manager |
(513) 619-7689 |
DShuey@oki.org |
Pascoe Planning Services LLC
(on behalf of the West Central Florida CCC) |
Hugh Pascoe |
Planning Consultant |
(352) 613-3313 |
PascoePlan@tampabay.rr.com |
| SanGIS |
Brad Lind |
SanGIS Program Manager |
(858) 874-7020 |
BLind@sangis.org |
| SANDAG |
Pat Landrum |
Senior GIS Analyst |
(619) 595-5602 |
Pat.Landrum@sandag.org |
| TBARTA |
Christina Caputo |
Transportation Planner |
(813) 282-8200 |
Christina.Caputo@tbarta.com |
Return to Top
Appendix B. Interview Guide
Background
- Please describe the purpose of this application/effort (X) and why it was developed or initiated.
- What is the current status?
- Who are the intended users of X? Who is involved in X?
- Who did State DOT/your agency coordinate or collaborate with to develop X, such as other agencies or the public?
- How did State DOT/your agency work with leadership on X?
- How did your State DOT/agency get funding for X?
- Did you look to other State DOT/agency models when developing X?
Access/Data
- Who can access/use X? Do you anticipate this changing in the future?
- What types of data are included in X?
- Who manages/updates these data?
- Who can contribute data?
Outcomes/Challenges
- What results have you seen from X (particularly those related to streamlining, communication, efficiency, and decisionmaking)?
- Can you provide some examples of how X has led to these results?
- What are/were the preferred outcomes? What has been most beneficial about X?
- Do you collect statistics or have developed performance measures to assess use of X? What about anecdotal evidence of X’s outcomes?
- What are some challenges associated with developing or using X?
Return to Top
Footnotes
Return to Top

