Webinar 30
Developing a Cross-Jurisdictional Edge-Matching Application and Meeting ARNOLD
(All Road Network of Linear Referenced Data) Requirements
December 15, 20168
Summary of the Federal Highway Administration’s Quarterly Webinar: Applications of Geospatial Technologies in Transportation
These notes provide a summary of the presentation discussed during the webinar and detail the question and answer session that followed the presentation.
The presentation is available upon request from the webinar speaker, Marshall Stevenson (MStevenson@sha.state.md.us). The email address for the One Maryland One Centerline team is 1MD1CLINE@sha.state.md.us.
Presenters
- Marshall Stevenson, GIS Program Support
State Highway Administration (SHA)
Maryland Department of Transportation (MDOT)
- James Graham, GISP, GIS and Applications Manager
Office of Information Technology and Innovation
Washington D.C. Department of Transportation (DDOT)
- Faisal Khan, GIS Analyst
Office of Information Technology and Innovation
Washington D.C. Department of Transportation (DDOT)
Participants
Approximately 29 participants attended the webinar.
Introduction
Mark Sarmiento of the Federal Highway Administration (FHWA) thanked participants for joining the webinar. This webinar was the thirtieth in a quarterly series of FHWA-sponsored webinars. The series deals with the application of geospatial information systems (GIS) and other geospatial technologies to transportation.
The attendees of the webinar were asked to answer questions regarding their agencies and interest in GIS. The results of the poll can be seen in the table located in the Appendix at the end of this report:
Presentation:
Developing a Cross-Jurisdictional Edge-Matching Application and Meeting ARNOLD Requirements
Overview
Marshall Stevenson from MDOT/SHA and James Graham and Faisal Khan from DDOT presented a brief slideshow reviewing their work on cross-border snap-to points (also known as “touch points”). After the slideshow, MDOT/SHA presented a live demonstration of Maryland’s “Snap-To-Point Reviewer” web-based GIS application. Using a dual screen share, Mr. Stevenson illustrated from the perspective of Prince George’s County how he reviews and approves a snap-to point for the County. Afterwards, Mr. Graham illustrated, from the perspective of DDOT, how a neighboring jurisdiction can coordinate its review and approval of that same point approved by the County. A one-page document on the process referenced in the presentation is available on the State of Maryland’s website: https://imap.maryland.gov/.
Snap-to Points
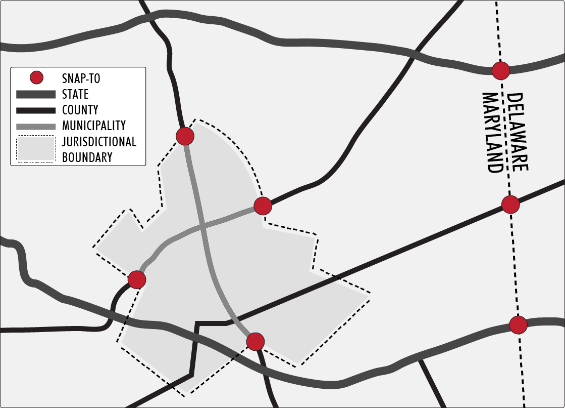
“Snap-to points,” also known as “touch points,” are points for edge-matching roadway centerline geometry between jurisdictions. When using snap-to points, roadway geometry is being edge-matched between jurisdictions. Mr. Stevenson stressed the important point that this process is not meant to establish jurisdictional boundaries or where jurisdictional maintenance begins and/or ends. The primary purpose of this process is to establish a seamless roadway centerline that connects jurisdictions to establish a conflated dataset for all participating jurisdictions.
There are many benefits of an edge-matched regional road centerline dataset. Such a dataset creates streamlined data conflation, integration, and maintenance processes. It also creates one seamless cartographic product for visual representation and mapping. Finally, it helps with the accuracy of addressing and routing data in support of NG-911 to establish a continuous flow of roadway centerlines between jurisdictions.
Figure 1: Illustration of the concept of snap-to points
Snap-to Points in the Application
The Snap-to Point creation process begins with the automated establishment of points where road centerline geometry intersects a change in jurisdiction. A manual effort of individually assessing each point and adjusting them so that they are in the most likely/best possible location, taking into consideration the State’s current road centerline geometry and local jurisdiction’s existing road centerline geometry, while remaining aware of political boundaries and current orthophotography.1 Jurisdictional representative then begin the process of collaboratively reviewing and approving the snap-to points to locations they feel to be in the best location relative to their jurisdictional needs.
Through the collaborative effort, neighboring jurisdictions review the locations to where the snap-to points are adjusted and can re-adjust the precise location of a point. Once completed, there is a statewide snap-to point database agreed on by all participating jurisdictions. This database is then archived and updated as needed, for example, when new roads are created or old ones modified or retired.
Agreeing on a snap-to point’s final location usually takes only a few iterations back and forth between jurisdictions. Most jurisdictions immediately accept the location of the snap-to point where the initial jurisdiction put it. Urban areas tend to need more discussion, but that review process is achieved in the application. Because one snap-to point can fall on multiple borders, there can be multiple jurisdictions that need to agree on the final location of a snap-to point.
Examples of Application Usage
Before the live presentation, MDOT/SHA provided some context in which the mapping application can be useful. The agency illustrated a few examples in which the application is commonly used.
Figure 2 is an example of what a user of the application sees when manipulating a snap-to point to identify the centerline of a road at the border of a jurisdiction. In this instance, the snap-to points are not exactly on the jurisdictional boundary, rather they are situated with respect to the center of the intersection.
Figure 2: The view of an intersection using the application
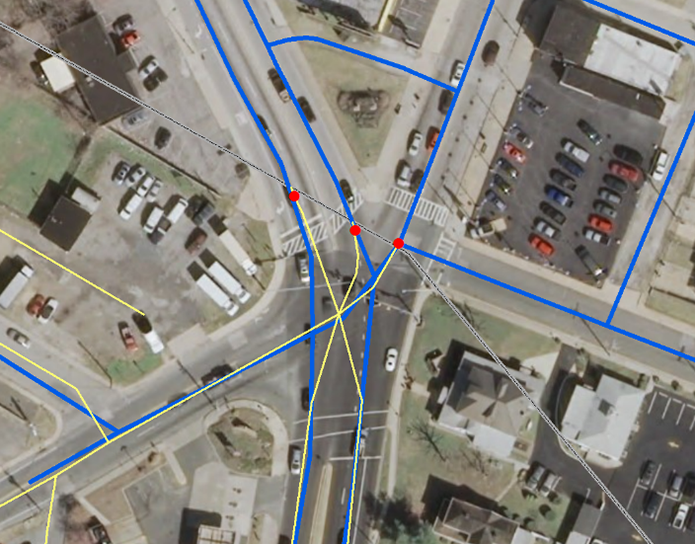
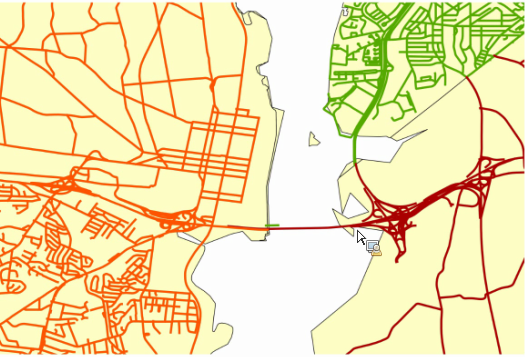
Figure 3 is an example of a county border. Within the image, Frederick County is the top county with roads highlighted in blue and Montgomery County is the bottom county with roads highlighted in yellow. In the top-right corner of this image, Frederick County has a road whose marking ends just short of the border. Montgomery county has their version of the same road in yellow running all the way to the border with a snap-to point established. In order to reconcile this difference, Frederick county needs to go into the system to confirm that the established snap-to point is agreeable and to have its roadway end at that point, connecting the one road across the county line.
Figure 3: Border between Frederick and Montgomery Counties
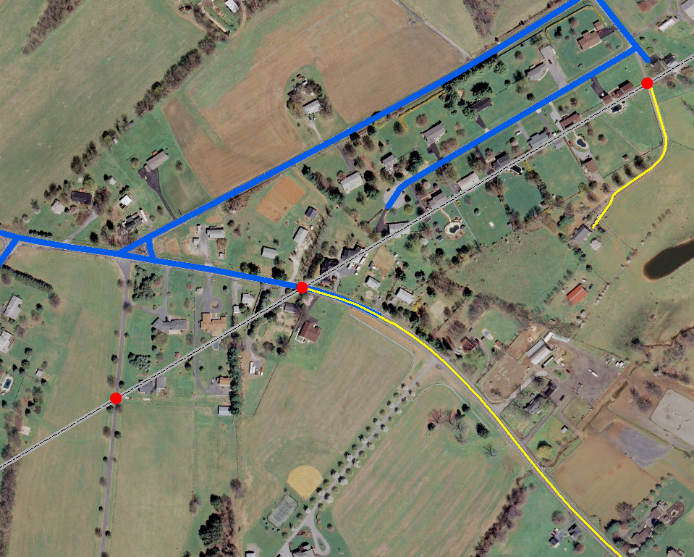
At the bottom-left is an example of a point on a long, private driveway that crosses the jurisdictional boundary. Even though this snap-to point does not fall on a public road, it is useful for emergency services in a situation such as this, where the only access to one part of a jurisdiction is through another jurisdiction. Maryland MDOT/SHA established snap-to points everywhere there is a border crossing. The MDOT/SHA requested that jurisdictions approve these points whether they are on a public road or not in case that information will be useful in the future, e.g. NG-911.
Figure 4: Status of Maryland’s system as of December 2016
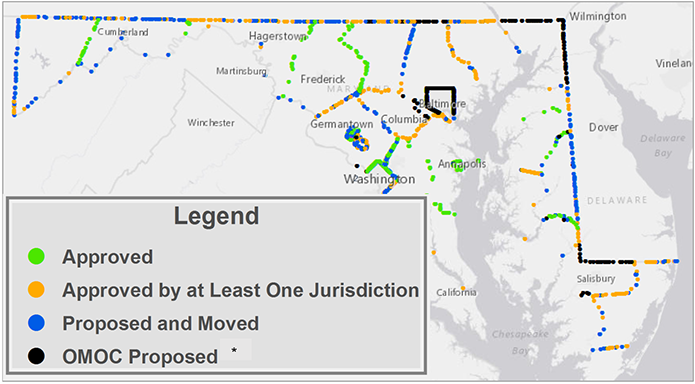
* OMOC - One Maryland One Centerline
Figure 4 above is a snap shot of the current state of the review process as of December 2016. Maryland borders four states. One of those states, Delaware, has provided Maryland with their snap-to points and Maryland is in the process of confirming them. Maryland intends to work with Virginia, West Virginia, and Pennsylvania to establish snap-to points along those borders as well upon a complete intial review by its local jurisidictions.
Live Demonstration
MDOT/SHA then presented a demonstration of the application (note: access to the application is secure and role-based—thus, requiring an Esri ArcGIS Online (AGOL) account). The application only shows points that are relevant to the needs of the user currently signed in. In other words, the application displays points that need to be reviewed by the jurisdiction the user represents, which can be seen in Figure 5 below.
Figure 5: List of snap-to points that need to be reviewed
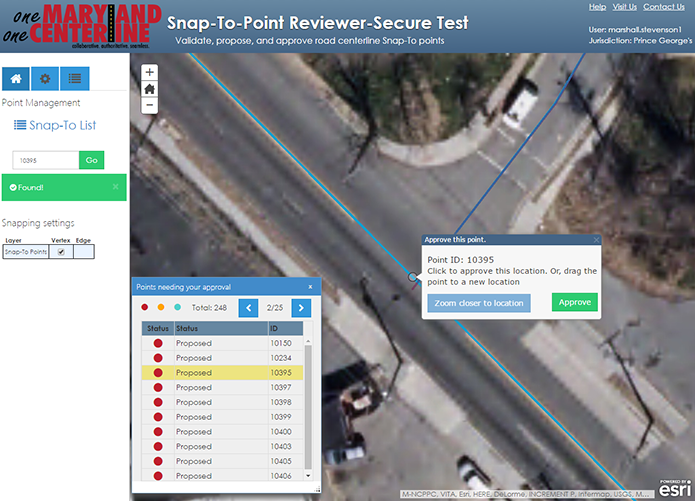
In the case of Prince George County, all of the points shown in Figure 5 were proposed by MDOT/SHA and are waiting approval by Prince George’s County. As the user goes through the list approving points, the list becomes shorter until the queue is empty and all snap-to points subject to review are complete.
Figure 6: Dropdown list of optional map layers
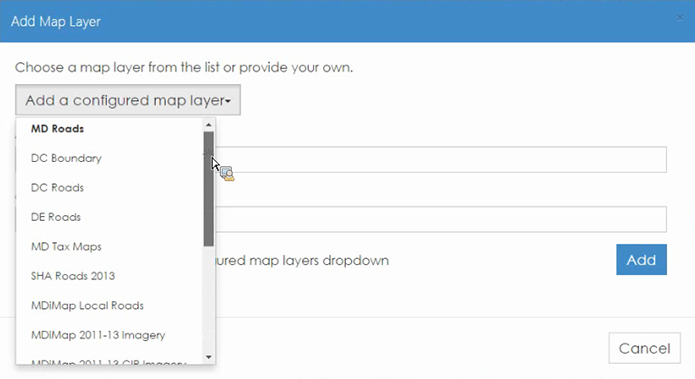
MDOT/SHA integrated authoritative GIS layers and other features that can be pre-loaded into the mapping application, which can be seen in Figure 6. In this example, the user representing MDOT/SHA loads a Washington D.C. boundary layer which automatically incoporates data from Washington D.C.’s data. Custom datasets can also be uploaded to the application if a county would like to reference something that is not already pre-loaded by MDOT/SHA.
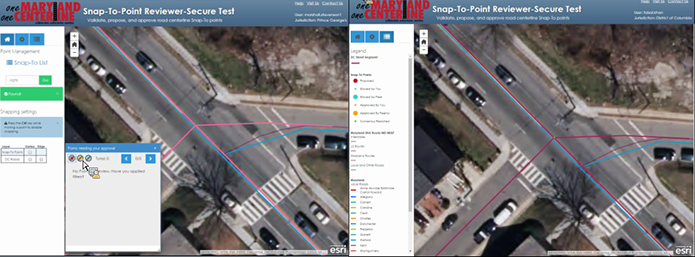
MDOT/SHA (serving the role of Prince George’s County) then demonstrated how the application works from two perspectives. While logged into the system as Prince George“s County, the split screen also demonstrated the viewpoint from DDOT’s vantage. Prince George’s County illustrated adjusting one point on the Washington D.C. border, and offered the opportunity to leave a comment as to why the snap-to point was moved. To explain the snap-to-point action, Prince George’s County included the description, “Matches closer to the intersection.” From the DDOT user perspective, the point had moved to the new location and changed colors to red to indicate that it then required approval by DDOT. DDOT demonstrated how to move the snap-to point to a location that is possibly more appropriate followed by a comment justifying the move. Following this, Prince George’s County noted that the snap-to point was now in the updated location and both of the explanatory comments were in the comment history. Finally, Prince George’s County aproved the new location after which the point turned blue on both screens indicating that both agencies had reached a consensus.
Figure 7: Split screen view from two users’ perspectives
The live demonstration of the application concluded and the presenters opened the discussion to questions from the audience.
Return to top
Questions and Answers
At what level in an organization is the end-user who is making these decisions about snap-to points? Is it a staff member versed in GIS or is there a more official decision-making process?
From what MDOT/SHA normally sees, the person adjusting and approving the snap-to points is generally a more technical-oriented person that would be the maintainer of the county centerline data. This person would typically be someone in public works, planning department, or public safety.
Is the final agreed-upon location of the snap-to points a formal or informal agreement?
MDOT/SHA tries to keep politics out of the matter as much as possible. It is generally an informal agreement. However, one reason that the comment history of the editing of the points is maintained is so that there is a record of which agency approved which snap-to points.
Where are the data of the comment history stored?
The data are permanently stored in a local database. The records are date- and time-stamped as well, so if there is any disagreement about where a point was or when it was approved, there is a record indicating so.
Does MDOT/SHA defer to the decisions of the locality and the county?
From MDOT/SHA’s standpoint, the decision of locality and county are not a main concern. Once the snap-to dataset is complete, MDOT/SHA will most likely let all of the counties and jurisdictions agree on a common centerline between themselves and then adopt that geometry as the state-wide standard.
FHWA has an ARNOLD network, but one thing they’re working on is trying to make these road networks connect to each of the state networks at the state boundaries. How have other states addressed edge-matching across the state border?
As an example of this issue, we can look at the boundary at the Washington D.C., Maryland, and Virginia borders where the Woodrow Wilson Bridge crosses the Potomac River, all of which can be seen in Figure 8. Maryland has its centerline going a number of feet into Virginia, and because the roadway crosses through a small sliver of Washington D.C., DDOT has to maintain a centerline as well. Users can see in the figure that although three jurisdictions have centerline data on one portion of roadway, the three sets of centerline data do not exactly match up. With time, this system can help bordering states agree on a common centerline.
Figure 8: Example of three jurisdictions maintaining a centerline
for the same section of roadway
How did MDOT/SHA get this project started?
Creating and implementing the edge-matching application has been a long, multi-year process. When working on such a project, it is important to engage stakeholders from the very beginning. The application team began with multiple presentations and meetings, especially at the local GIS conference in Maryland (TUgis). Mr. Stevenson has a professional relationship with a number of individuals who work at the county level from his previous positions, which was helpful in getting the project started. Two years ago, a common sentiment among GIS practitioners at MDOT/SHA was that counties believed maintaining a common centerline was not a topic of interest. Today, however, counties, and especially the organizations involved in emergency services, view it as essential.
Are local jurisdictions looking to use the MDOT/SHA attributes for their inventory?
There will be sharing of attribute information. One thing MDOT/SHA needs is the information from local stakeholders. Many local groups see the centerline program as an opportunity to provide a centerline for the localities as well. There will be multiple representations of street names capturing local and state street names as well as streets that are “also known as” and not necessarily signed as. That information will also be shared across jurisdictions.
Is MDOT/SHA exploring opportunities to create a framework for an FHWA-sanctioned specification that all states can leverage?
The FHWA would probably start with trying to highlight good examples of how it has been done at the State level. States often do not like being told how to do something, but at the same time regularly ask for a standard on something. The FHWA tries to walk that line by sharing information about best practices, and that is the approach they may use in this situation as well.
Return to top
Appendix
Before the presentation began, participants were asked to respond to a few questions to assess the population present in the webinar. The results of the poll are shown below in Table 1.
Table 1:
Results of poll asked of webinar participants
| POLL RESULTS |
| Who do you work for? |
| Federal Government |
8% |
| State Government |
85% |
| Private Sector |
7% |
| How did you learn about today’s webinar? |
| GIS-T Yahoo! Forum |
8% |
| GIS State DOT Managers email listserv |
17% |
| FHWA GIS in Transportation website posting |
17% |
| Other |
58% |
Have you ever visited the FHWA GIS in
Transportation Website? |
| Yes |
92% |
| No |
8% |
How many previous GIS in Transportation
webinars have you participated in? |
| 0 |
9% |
| 1-3 |
64% |
| 4-6 |
18% |
| 7-9 |
0% |
| 10-12 |
9% |
At the end of the presentation, participants were asked to respond to a few more questions. The results of the poll are shown below in Table 2.
Table 2: Results of poll asked at end of webinar
| What GIS topics would you be most interested in learning about in future webinars? |
| Asset management |
14% |
| Automated Vehicles |
17% |
| Climate change |
21% |
| Enterprise GIS efforts |
14% |
| Environmental analysis |
10% |
| Livability |
14% |
| Maintenance |
10% |
| Operations |
0% |
| Other (please specify via the chat pod) |
21% |
| Planning |
17% |
| Safety |
7% |
| Web 2.0 tools |
0% |
| Was the information presented in today’s webinar useful and relevant to you? |
| very useful |
18.2% |
| somewhat useful |
72.7% |
| not very useful |
9.1% |
| Do you read the FHWA GIS in Transportation newsletters? |
| I review most issues of the newsletter. |
27.3% |
| I review some issues of the newsletter. |
36.4% |
| I rarely or have never reviewed the newsletter. |
36.4% |
Return to top
Footnote

