Webinar 32
Data-Exchange Agreements to Meet Transportation Needs: How LA Metro Leverages Waze Data to Manage Traffic
April 27, 2017
Summary of the Federal Highway Administration’s Quarterly Webinar: Applications of Geospatial Technologies in Transportation
These notes provide a summary of the presentation discussed during the webinar and detail the question and answer session that followed the presentation.
The presentation is available upon request from the webinar speaker, Kali Fogel (FogelK@metro.net). A link to the webinar recording is available at https://connectdot.connectsolutions.com/p87bc4vb8x3/.
Presenter
- Kali Fogel, Regional Integration of Intelligent Transportation Systems (RITTS) Program Manager
Los Angeles County Metropolitan Transportation Authority, Los Angeles, CA
FogelK@metro.net
Kali Fogel graduated from California State University, Los Angeles with a Bachelor of Science degree in computer information systems and a certificate in computer programming. He has 17 years of experience providing detail and technical solutions to complex intelligent transportation problems. He currently serves as the administrator and configuration management committee chair of RIITS.
Participants
Approximately 34 participants attended the webinar.
Introduction
Mark Sarmiento of the Federal Highway Administration (FHWA) thanked participants for joining the webinar. This webinar was the thirty-second in a quarterly series of FHWA-sponsored webinars, which highlight applications of geospatial information systems (GIS) and other geospatial technologies in transportation.
As part of the introduction, Mr. Sarmiento announced the 2018 AASHTO GIS for Transportation Symposium (GIS-T) which will be held on March 19-22, 2018 in Little Rock, AR. Further information can be found on GIS-T website: https://gis-t.transportation.org/. Following the announcement, participants were asked to complete a short poll inquiring about the population in attendance. The results of the poll can be found in the Appendix at the end of this report.
Regional Integration of Intelligent Transportation Systems (RIITS)
Overview
The Los Angeles County Metropolitan Transportation Authority (Metro), serving the Los Angeles County metropolitan area and parts of adjacent counties, is the region’s largest transportation agency and the administrator of the Regional Integration of Intelligent Transportation System (RIITS). As the administrator of RIITS, Metro follows the National Intelligent Transportation Systems architecture to develop, integrate, store, exchange, manage, host, operate, maintain, and expand the collection, distribution, and use of transportation related data. The Connected Citizen Program through Waze is a free data exchange program that allows user to collect real-time traffic and road information. Kali Fogel presented a detailed slideshow on RIITS and the integration and potential uses of the Connected Citizens Program.
What is RIITS?
Regional Integration of Intelligent Transportation Systems (RIITS) is an interagency multimodal mobility program that supports the real-time exchange of information. This exchange helps manage the regional transportation system in Southern California, primarily focusing on Los Angeles County. RIITS compiles information collected from multiple intelligent transportation systems (ITS) located across freeway, traffic, transit, and emergency service agencies and disseminates that information in real-time. The information is made available to the public, other agencies, and planners to use for their benefit. The system operates on a web-based platform, which is accessible anywhere with secure network access (https://www.riits.net/).
Architecture
Enabling an exchange of information in real-time requires a well-established network architecture. An architecture is a set of rules that facilitate the building of systems in order to allow them to operate and communicate with each other. Logical elements of an architecture represent the communication links and physical components that connect these links such as operation centers, traffic lights, and railroad crossing signals. Logical elements include the flow of information and actions to be performed using that information. The architecture of RIITS can be broken down into three networks: communications, transportation, and institutional.
Figure 2. Schematic of the RIITS Communications Network Architecture
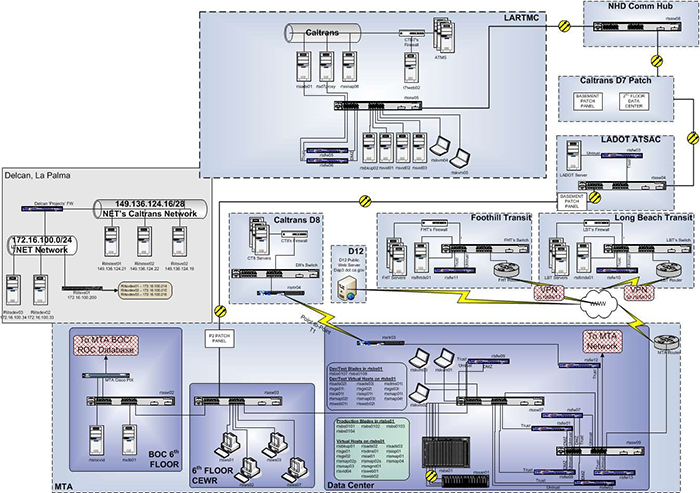
Source: LA Metro Presentation
The transportation architecture is currently being updated, but it will resemble the communication network upon completion. Most of the transportation architecture will be data architecture in a data cloud. Until the update is finalized, the transportation architecture is a hybrid cloud operating on Microsoft Azure. In the schematic below (Figure 3), the left side shows what is in the cloud and the right side shows services running on-site not currently in the cloud. Most of the ‘big data’ is primarily processed using cloud technology.
Figure 3. Schematic of the Computer Network Architecture
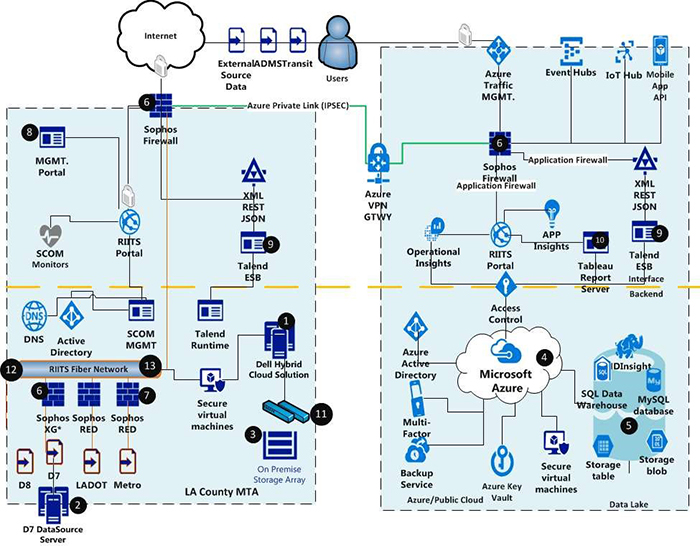
Source: LA Metro Presentation
The presentation continued with a detailed description of how RIITS compiles data, as seen in Figure 4, and what the network aims to achieve with this data. RIITS can integrate almost any type of transportation data into its network, which is then reformatted into what it calls “mobility” data. This mobility data is then distributed to the public and other agencies for consumption. Listed on the left of Figure 4 are the data inputs. Not listed, however, is a base map which is crucial to spatially and temporally locate information. Listed on the right of Figure 4 are the users.
Figure 4. Data Exchange Representation
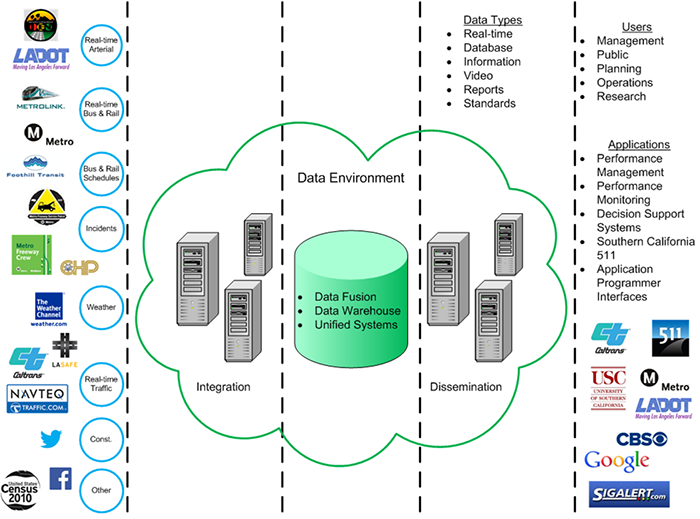
Source: LA Metro Presentation
In Southern California there is a policy in place committing the region to using ITS. Official agreements with public and private entities can be made for organizations interested in accessing or contributing to the data. Bylaws, procedures, and agreements are also in place to protect and regulate the use and access of the data. Together, these policies, bylaws, procedures, and agreements in place make up the institutional architecture of RIITS.
Waze and the Connected Citizens Program
Waze is a community-based traffic and navigation app that allows users to share real-time road information such as hazards, closures, congestions, and accidents in order to save everyone time and gas money. The Connected Citizens Program through Waze is a two-way data exchange program that aims to enable government partners to respond more immediately to accidents and congestion on the roads by integrating publicly available city data with Waze user inputs.
Waze as a Regional Resource
Waze allows RIITS to retrieve important and useful information that is usually difficult to access. For example, traffic management systems data is typically difficult to obtain without connecting directly to the traffic management system itself. However, Waze preprocesses the data and communicates the information via the internet. This allows for easy and inexpensive access of the traffic management systems data for RIITS to then use. Waze provides a very large amount of data that, once archived, can be integrated into RIITS and used to create a regional multimodal performance measurement that will aid in regional transportation planning.
Waze and Southern California 511
Southern California 511, which provides local traffic to commuters, plans to incorporate Waze data into its map by combining Waze user incident reports in a given geographic location into a single, major event notification. When evaluating the Waze application, one complaint Waze users have is that it provides too much information. To address this, Southern California 511 intends to avoid information overload by combining the Waze incident reports.
Figure 6. Southern California 511 Map
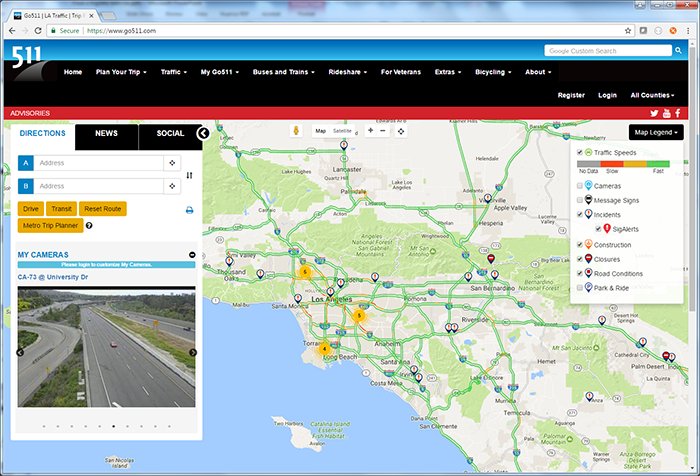
Source: LA Metro Presentation
Return to top
Questions and Answers
Mr. Sarmiento opened the discussion to participants who asked questions of Mr. Fogel. The participants’ questions and Mr. Fogel’s responses are below.
How is real-time operations data maintained if the data is delayed in its acquisition?
The data is delayed by approximately two minutes. The time at which the data is created, whoever, is in real-time, so the insights from using the data will not be affected because the data is archived with the correct times. What is affected are the real-time operations in the transportation management center. In the past, LA Metro’s transportation management center spent on average three minutes processing this type and amount of data, in addition to the two minute delay in obtaining the data. Today, LA Metro has managed to reduce its processing time to less than one second when analyzing an estimated two million records. Now, the only delay is the two minutes it takes for LA Metro to receive the data from Waze. Originally, this data could not be shared with a traffic management system because the system would need to download all the data, which consists of traffic, bus data, and other data. For these traffic management systems, the RITTS program acts as a server which can provide the data, already processed, in near real-time. In truth, the existing two minute delay does not greatly affect operations because most incidents occur over longer spans of time. This delay, however, can affect law enforcements ability to reach incident locations when needed. For this reason. LA Metro’s RITTS program does not provide this data to law enforcement.
Has Waze data been compared with NPMRDS (National Performance Management Research Data Set)?
No, but LA Metro is preparing to do that.
How well does the Waze data work in rural areas?
LA Metro has not analyzed Waze data in rural areas but their experience with data in rural areas is it is very spotty. What they have started to do in areas with limited data is use our archives to come up with algorithms to estimate the roadway conditions during certain times at certain points.
Does Waze provide usage statistics of Waze users in each state?
Yes, though it is not shared publicly. If you become a member of the Connected Citizen Program you will have access to this information.
Does Waze contain travel time? Or does it track vehicles in real time?
Waze is very concerned with privacy and they do not share private information.
Return to top
Appendix
Table 1: Results from the poll
| Who do you work for? |
| Federal Government |
25% |
| State Government |
25% |
| Metro/Regional Planning Organization |
41.67% |
| Other |
8.33% |
| How did you learn about today’s webinar? |
| GIS-T Yahoo! Forum |
8.33% |
| GIS State DOT Managers email listserv |
33.33% |
| FHWA GIS in Transportation website posting |
16.67% |
| Other |
41.67% |
Have you ever visited the FHWA GIS in
Transportation Website? |
| Yes |
66.67% |
| No |
33.33% |
How many previous GIS in Transportation
webinars have you participated in? |
| 0 |
10% |
| 1-3 |
90% |

