A Newsletter from the Federal Highway Administration (FHWA)
Printer-friendly PDF →
February 2022
Supply Chain Resilience and GIS Analysis
Article by Suchi Gopal, Professor, Boston University and Joshua Pitts, CTO, ESG Analytics AI
Our guest writers this month are from Boston University and the Colorado Department of Transportation (CDOT). Dr. Suchi Gopal is professor of earth and environment in the Boston University College of Arts &Sciences. Dr. Gopal is a renowned expert in the field of geographic information systems (GIS). Her latest research includes ESG materiality risk mapping, environmental justice, and public health. Her research is multidisciplinary, and deals with spatial analysis and modeling, GIS, information visualization, and artificial intelligence (AI). Dr. Gopal has over 200 publications in this field. She also teaches supply chains at the Vienna University of Economics and Business.
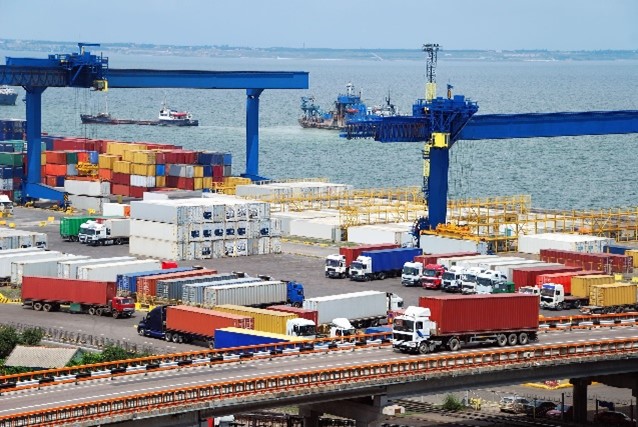 Figure 1. Photograph. Ports are integral transportation features of many supply chains. Source: Volpe Center
Joshua Pitts is a software engineer and data scientist with a specialization in large-scale analytics products, including deep learning and AI applications. He has built analytics products for Fortune 500 clients, including Google, among others, with product revenues over $100m USD. His published research spans data science and the social sciences with a focus on social applications and positive social good.
Nell Conti has over 20 years of GIS experience in both the private and public sectors with eight of those years focused on GIS program development. In her current position at CDOT, Nell is working to integrate Chief Data Office and GIS Section activities and technologies.
Introduction
Supply chain complexity has increased in recent years, driven largely by global growth and new access to emerging markets. A typical supply chain consists of many actors, including producers, distributors, consumers, vendors, warehouses, transportation companies, distribution centers, and retailers. For example, food supply chains vary in scope from local (farmers markets) to global scales, characterized by complexity in the number of actors and steps. Transportation plays a key role in facilitating the movement of on-time deliveries from the source to the designated destinations. In fact, the choice of transportation has a major impact on supply chain management strategy.1 Gone are the halcyon days of production happening within a single facility or a few factories near one another. In the last decades, manufacturing supply chains have relocated to China, Taiwan, South Korea, Singapore, Hong Kong, and other emerging markets through increased globalization and lower prices, which has led to the growth in size, diversity, and complexity of supply chain partners with multiple tiers of suppliers.
Events such as weather, geopolitics, and now Covid-19, have led to cascading supply disruptions worldwide, highlighting the need for robust and resilient supply chain management (SCM) strategies. For example, the recent semiconductor chip shortage—affecting products ranging from washing machines to cars—illustrates these effects throughout the global supply chain, ultimately leading to reduced supply and ensuing shortages. Covid-19 has proven to be a “Black Swan” event—an unlikely, unexpected event with enormous ramifications.2 Covid-19 exposed vulnerabilities in almost every company’s supply chain, with 94 percent of Fortune 1000 companies experiencing supply chain disruption and a consequential downgrade in their growth outlook.3 Covid-19 demonstrated the need for better SCM and localized supply chains in sectors such as agriculture,4 semiconductors,5 and critical supplies.6 Critical supplies can be essential supplies, such as medical equipment or fuel.
Analysis Approaches
The complexity of many supply chains makes it difficult for analysts to identify and model appropriate business strategies around locating, optimizing, and creating sustainable, resilient supply chains. Geospatial analysis with GIS plays an essential role in managing and analyzing supply chains and enables analysis of supply chains’ economic, environmental, and social impacts. Below, we discuss some contemporary approaches to supply chain analysis, with an emphasis on geospatial and transportation-related applications.
Dynamic Visualization
GIS-based dynamic analysis and visualization allows users to display the current conditions and changes over time in the supply chain. Additionally, GIS helps users detect issues such as flooding and determine if they affect a specific production facility, a transportation link, or the entire supply chain. Incorporating time-related inventory information into the GIS facilitates powerful animations of inventory changes over time at different locations.
As an example, geospatial analysis and visualization can help streamline and create public awareness about agricultural logistic processes. According to the U.S. Department of Agriculture (USDA) Economic Research Service, between 30 and 40 percent of the entire U.S. food supply is wasted every year. About 40 percent7 of the food wastage stems from supply chain issues. GIS helps in collecting, managing, storing, and displaying food supply data on maps and data dashboards. Such displays can lead to a better understanding of:
- Agricultural demand, supply, and freight movements;
- Impacts of climate change and environmental hazards (such as flooding and wildfires) on agricultural production and transport;
- Locations of food insecurity in areas;
- High-level business insights.8
Optimization
Algorithms such as the traveling salesman, shortest path, and vehicle routing problems can help to optimize supply chains. In the context of graph theory, the shortest path problem aims to find the shortest distance, time, or cost between two nodes in a network. The shortest path algorithm searches for the lowest cost path between starting point and destination. On the other hand, the traveling salesman problem (TSP) aims to find the least-cost-possible tour starting from an origin point with a given list of destinations and their pairwise distances, under the constraint that the TSP visits each destination exactly once and, finally, returns to the origin point. GIS can call on programs such as TSP to find the solution to transportation optimization problems to minimize cost, time, or distance specific to supply chain problems and display the results. TSP in GIS has been combined with linear and mixed-integer programming models to make strategic, tactical, and operational decisions.
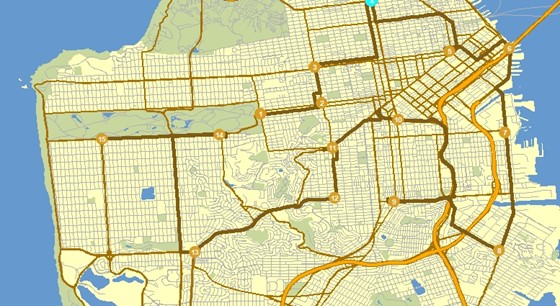
Figure 2. Map. How can we select the shortest path to minimize travel time or transportation costs? We have a set of 15 nodes as destinations. The shortest path algorithm uses the best route based on travel time between the 15 locations, holding origin and destination as fixed locations (nodes 1 and 15). The problem can become complicated when there are hundreds of locations. Source: Boston University College of Arts &Sciences.
For example, transportation planning or vehicle scheduling involves determining optimal truckloads, freight consolidation, and carrier selection based on overall and individual orders while considering constraints for route determination and vehicle scheduling. Such complex problems involve many algorithms embedded into GIS.
Predictive Analytics and AI
Dynamic and strategic management of supply chains is increasingly facilitated using big data and AI, as companies race to minimize damage and avoid losses. AI algorithms can now be integrated into GIS to facilitate dynamic visualization and optimization. AI algorithms can predict potential disruptions in the supply chain if they are trained on the right data. “Deep Learning” is a set of algorithms and methods that work well on complex data sets, especially imagery. This includes using satellite or drone imagery to predict weather events, report road obstacles in real time, and identify downed power lines. Other recent advances include using modified neural networks (e.g., recurrent neural networks) to augment traditional approaches such as multivariate analysis to achieve superior results, especially for prediction, planning, and data requiring a time-series dimension. These apply directly to many transportation-related analyses that have measurements across time.
Risk Analytics
Supply chains may link demand and manufacturing (supply) points via two or more intermediaries. More complex supply chains tend to have more intermediaries while simpler supply chains may not have any. Risk analysis in this context is about identifying threats and vulnerabilities to better plan for these cases or have contingencies in place if they do occur.
To build resilience in the network, supply chain managers can eliminate one or more intermediaries if they are disrupted by natural hazards, geopolitical tensions, or other factors. Additionally, location-siting analysis enables the intelligent selection of alternate locations by integrating data that can handle disruptions in the supply chain. For example, using scenario analysis, clothing manufacturers can make proactive decisions to identify potential raw material and factory production sites to avoid monumental losses when hit by a disaster. In this context, predicting risks/vulnerabilities is fundamental to making proactive decisions.
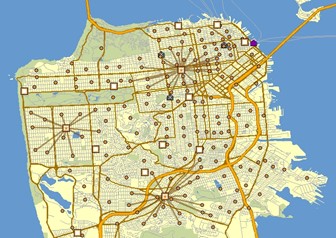
Figure 3. Map. Location siting analysis: Where can a new business or retail store or bank open a store to maximize its market share? The main objective is to locate stores close to population centers, where demand exists for the service or goods sold at the nearest store. This objective is based on the principle of least effort, which assumes that people tend to shop more at nearby stores than at those that are farther away. In this image, we are siting three stores (shown with a star node) in San Francisco based on the population of neighboring census tracts (2010). Source: Boston University College of Arts &Sciences.
Data Sources and Application Programming Interfaces
Modern map services provide data feeds (known as application programming interfaces, or APIs) of locations and directions for a series of locations considering the mode of transportation (driving, transit, cycling, or walking). Route estimation algorithms can calculate distance and duration (using historical and current traffic conditions) that is useful in supply chain optimization. Location data and live traffic information can lead to creating optimum routes for single or multidrop deliveries, allowing customers to see in real-time where their parcels are and when they will arrive, and make better decisions about strategic and operational issues. In this context, these APIs can capture movements of people across the States as Covid-19 lockdowns lift or cease to analyze the economic activity of a State or region.
OpenStreetMap (OSM) is a crowdsourced, free geospatial database of the world. OSM is updated daily by volunteers using GPS devices and satellite imagery and can be downloaded at any time. The communities create a transportation database in any region of the world consisting of roads, buildings, as well as land-use data. In a forthcoming study, we assessed the accessibility to health insurance facilities for pregnant women in Kenya based on OSM’s road network of paved and unpaved roads. We were able to estimate travel times based on traffic volumes and routing in Kenya. Geofabrik provides free access and downloads of OSM data.9
Translating Real-Time Data Streams into Location Intelligence
Editorial by Nell Conti, GIS Section Manager, Colorado DOT
The Colorado Department of Transportation (CDOT) invests in several efforts to modernize and streamline data storage, discovery, usage, and analysis to provide leadership access to the information they need to make critical decisions about Colorado’s transportation network and supporting infrastructure. Over the last few years, CDOT’s Chief Data Office has developed a data lake and an advanced analytics platform to transform CDOT’s data so that it helps increase operational efficiencies and decision-making. One of the components of this platform is the CDOT Real Time Data Hub. The majority of CDOT’s data is geospatial so it is important to ensure that the data hosted in these platforms integrates seamlessly with CDOT’s GIS systems to enable department staff, partners, and the public to access the data on a map.
In integrating this data with the GIS systems, CDOT worked with the Esri Advantage Program to develop a methodology to transform the data streams hosted in the Real Time Data Hub into geospatial layers. To complete the translation, CDOT leveraged their ArcGIS Enterprise environment and ArcGIS GeoEvent server. Operational data streams in the Real Time Data Hub include atmospheric weather, road surface conditions, automatic vehicle locations, vehicle speeds, and events such as road closures, incidents, roadwork, and restrictions. These real-time layers are consumed via GIS applications such as web maps and dashboards. CDOT currently maintains a Traffic Operations Dashboard and a Wildfire Situational Awareness Dashboard that incorporate these data streams and provide CDOT staff with critical real-time information in a location intelligent environment. CDOT is also working to prepare these layers for public consumption so that local agencies and jurisdictions can leverage this data in their own GIS applications.
Translating real-time data streams into geographic data facilitates data sharing and data literacy for CDOT staff and the public through online dynamic mapping applications. Spatially enabling this data allows users and decision-makers to understand the what and, most importantly, the where, of real-time events across the State.
Other News
Newly Available
Data Dashboards at State DOTs: Case Studies of Select Transportation Agencies
This report investigates the use of online, geospatially enabled data dashboards at select State Departments of Transportation (DOTs) for applications including data quality control, asset management, performance management, and more. Check it out here.
Past Events
Leveraging GIS for Right of Way Webinar
In February, FHWA’s GIS in Transportation program supported the Vermont Agency of Transportation (VTrans) on the efforts of VTrans to develop a statewide property parcel data layer. A summary of the webinar can be viewed here.
For more information about this newsletter, please contact Mark Sarmiento, FHWA Office of Planning, at Mark.Sarmiento@dot.gov.
Footnotes
Back to Top