SPRING 2011
A Newsletter from the Federal Highway Administration
www.gis.fhwa.dot.gov
A Look at the Kentucky Transportation Cabinet's (KYTC) Billboard Application
This edition's Q&A is with Andrew McKinney (Mobile GIS Lead), Chris Lambert (Transportation Engineering Tech II), and Will Holmes (Office of Information Technology's GIS Support Services Branch Manager), all of KYTC. They discuss developing a mobile billboard application.
Upcoming Events
- GIS in Public Transportation Conference
St. Petersburg, FL
September 13-15, 2011
See transitgis.org/
- National States Geographic Information Council's Annual Conference
Boise, ID
September 26-29, 2011
Q. Why was the application developed?
A. With reduced staffing and shrinking budgets, KYTC fell behind in reporting outdoor advertising devices to FHWA. FHWA asked KYTC to address this issue. KYTC agreed to inventory an estimated 4,000 devices by December 31, 2011.
KYTC's Division of Maintenance's Permits Branch partnered with the Office of Information Technology's GIS Support Services (OIT-GIS) Branch to create a mobile GIS solution. The resulting billboard application allows novice GIS users to efficiently capture location and feature information and easily integrate data into an enterprise database.
The billboard application uses Trimble Juno handheld devices and ESRI ArcGIS Mobile 9.3. It was developed within 1 month and then deployed to 40 staff in Kentucky's 12 highway districts. Initially, the inventory project was estimated to take 12 months to finish. However, using the mobile application, it was completed in 3 months with 3,432 billboards collected.
Q. How do people use the application?
A. Each of Kentucky's highway districts has a District Outdoor Advertising Coordinator (DOAC) who assigns specific routes to field inspectors. Inspectors use the mobile application to collect all billboards along a route. If a billboard is easily accessible, the inspector captures its exact location.
If it is located off the right-of-way, on private property, or is too difficult to access, inspectors collect an offset location and then add attribute information into a pre-built form.
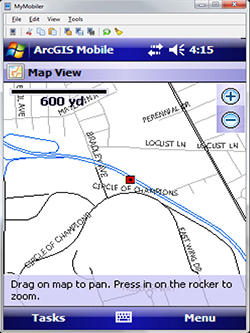 Figure 1. Collected Outdoor Advertising Device Point.
At day's end, the inspector brings the mobile unit to the DOAC, who then uploads data to the database. DOAC and Permits staff later use an ArcMap template to post-process billboard data, correct the offset located billboards, and update permit data. If a permit does not exist for the existing structure, further investigation is required.
The desktop GIS template also executes automated post-processing to attach linear referencing and other attributes to billboard records.
By clicking on a billboard point in the desktop template, the user can access a hyperlinked field. The hyperlink opens a folder that contains pictures, permit documents, and other applicable information related to the billboard. This functionality is extremely important to staff in the Permits Branch.
Currently, not all billboard information (permits applications, photos, etc.) are attached to each billboard point, but they will be in the future.
Q. Why was the application chosen as a tool to meet KYTC's needs?
A. The Permits Branch needed an effective solution quickly. After discussing options with two other Maintenance Branches that were working with mobile applications, the Permits Branch identified mobile GIS as the most effective solution over traditional paper methods.
OIT-GIS already had built two successful pilot programs for data collection and attribute editing using the Juno and ArcGIS Mobile combination. As a result of these experiences, OIT-GIS staff was comfortable supporting and developing the billboard application although it involved a tight deadline and a larger scale for data collection.
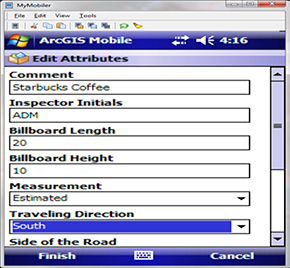 Figure 2. Attribute Data Form.
Q. How do staff use information collected in the billboard application?
A. Information gathered is used to verify a billboard's compliance with State and Federal regulations. Most regulations deal with billboard spacing information, such as the spacing between them, their distance from the right-of-way, the sign's distance from the business being advertised, and whether the sign is within urban boundaries. Geospatially enabling the billboard application allows a small number of staff to discern compliance based on these types of spatial criteria.
Q. Who initiated development of the application?
A. The Permits Branch proposed that OIT-GIS build a mobile application to collect billboard data. Together they defined a strategy and presented it to management, who accepted it on the condition that a working product be completed in 1 month.
OIT-GIS built statewide- and district-focused mobile and desktop applications and supporting databases. KYTC's Central Office Permits Branch oversaw data collection, helped gather some data, and performed quality assurance and quality control. Training was a key element to encourage adoption of the new technology.
Q. Where did KYTC obtain data?
A. OIT-GIS leveraged existing statewide data (e.g., roads, county boundaries) that are part of the State's enterprise GIS. Billboard data were built collaboratively by the Permits Branch and OIT-GIS.
Q. Are there funding challenges?
A. There were several funding challenges related to the billboards project. Federal funds were considered to purchase the project's Juno devices, but budget cuts made that funding unavailable. Nancy Albright, KYTC Director of Maintenance, authorized $60,000 from the Maintenance budget to acquire equipment. Other pressing projects required that these purchases be made quickly. Staff set up funds, designated hardware specifications, and placed orders for equipment within 1 month.
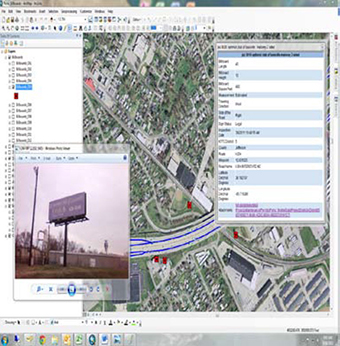 Figure 3. Outdoor Advertising Device Inventory statewide map template.
Q. What have been some signs of success?
A. The Permits Branch conducts monthly billboard progress meetings with FHWA. FHWA has been satisfied with the results of the project and has expressed appreciation for the simplicity of the billboard application. Many KYTC managers now see the benefits of geospatial data and plan to continue leveraging these types of technologies.
The Permits Branch shares its geospatial technology experiences with others looking for solutions. Many District and Central Office Permits staff would like to expand the use of this technology in their daily work. This has prompted ideas for new projects.
Of the billboard application, Ms. Albright says, “we are very surprised and pleased with how quickly the technology captured and integrated [billboard] information. We completed the billboard survey in less than half the time we thought it would require.”
Q. What have been the critical success factors?
A. The critical success factors are detailed below:
See the big picture. FHWA wanted a “current report.” KYTC addressed this need while streamlining the business process, saving significant time and funding, and delivering information to many more customers. Projects should be built to satisfy larger enterprise needs.
Focus the application. Make the process intuitive to non-GIS customers and commit training time to increase applications' rapid adoption. KYTC was able to exceed FHWA's goal by making the billboard application user-friendly and building in training time.
Stretch but know your strengths. OIT-GIS leveraged technology it understood well while also expanding use of mobile GIS, demonstrating that it could deliver products within a short timeframe and on a larger scale.
Q. What are anticipated future plans for the application?
A. As the billboard fieldwork wrapped up, Permits Branch staff asked OIT-GIS to expand the application to support encroachments, recyclers, schools and airspace. This upgrade, which will use ArcGIS 10, will allow staff to manage all inspections and let users see current information.
OIT's Application Development Branch is also rebuilding a permit application (PERKS). OIT-GIS is working closely with this branch to integrate GIS with PERKS. This solution will allow inspectors to better maintain and update information over the life of the permit.
For more information, please contact:
The GIS for Strategic Asset Management (GSAM) Group
Editorial From Shawn Blaesing-Thompson, Iowa Department of Transportation (DOT) and Fred Judson, Ohio DOT
The new GSAM group is a collaborative discussion and idea-sharing forum that the Ohio and Iowa DOTs facilitate. The impetus for the group stemmed from conversations between Iowa DOT and Ohio DOT on the use of GIS for asset management, as well as conversations between these DOTs and others at different levels of government. The forum is open to government and educational agencies.
Another impetus for GSAM was discussions that stemmed from an FHWA-sponsored GIS in Transportation webinar that the Ohio DOT presented in mid-2010 (see http://gis.fhwa.dot.gov for more information) and subsequent conversations with other interested government agencies.
The purpose of GSAM is to gather interested agencies to discuss asset management topics, best practices, and lessons learned. GSAM hopes that by working with all members, it can address identified spatial asset data collection and management issues.
Iowa DOT, Ohio DOT, and others believed that a focused group for collaboration would be a tool to help staffs' daily business needs, particularly because many agencies have similar business needs and work flows. As GIS technology matures and location data management changes, asset management become more and more reliant on GIS and geospatial technologies. It is important to foster conversations on these topics so that GIS professionals can do their jobs more effectively and efficiently, in order to better manage data, design work flows, train field crews, support hardware and software, and analyze data.
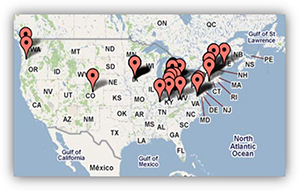 GSAM members are from around the U.S.
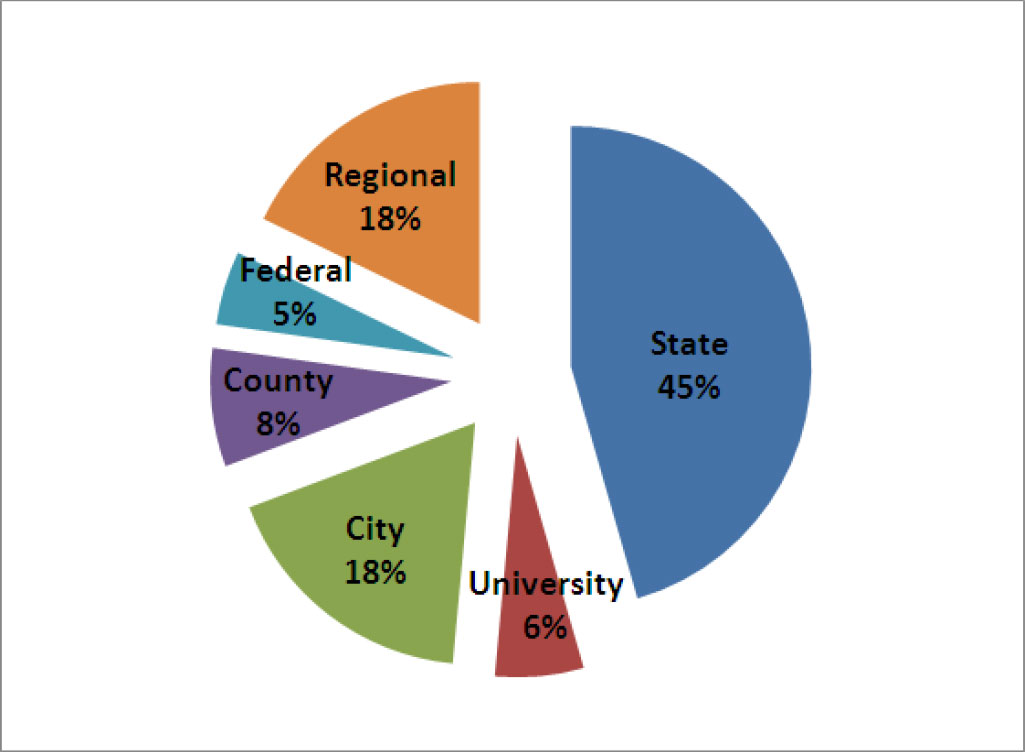 GSAM members represent a variety of organizations.
Currently, GSAM is composed of 38 members in 12 states. Membership is continuously growing. Members include representatives from universities and several sectors of government including cities, counties, and Federal, regional, and state agencies. State agencies are the largest sector represented in GSAM. There are 18 state agency representatives on GSAM; of these individuals, nine represent state DOTs.
GSAM members communicate via quarterly webinars. Upcoming GSAM meetings are scheduled for May 26, August 25, and November 17 (all at 1 PM EST).
The group also maintains an external SharePoint site hosted by the Ohio DOT and led by GSAM administrators Fred Judson and Shawn Blaesing-Thompson. The SharePoint site provides a forum to exchange documents, code, and data. It also provides opportunities for open discussions (which are regularly posted on the site) and a venue for members to ask questions and share information with the entire group.
GSAM does not force large-scale standardization of asset management processes. Rather, it seeks to establish dialogue between and among agencies to leverage experiences and knowledge from around the United States.
Typical topics discussed by GSAM include sharing recommendations or lessons learned about third-party software, solutions to common problems, tutorials, and other information that helps form a base of best practices for asset management.
GSAM quarterly meetings include three parts:
- The first part is a presentation from a group member pertaining to GIS and asset management. This presentation helps informs the group about what others have done and facilitates discussion both during and after the meeting.
- The second part is a presentation from an industry vendor. These vendor presentations allow GSAM to stay apprised on the latest technology and industry trends.
- The third part focuses on spotlighting new asset collection and maintenance technologies.
Staff follow up the meetings with an e-mail to GSAM members that include links to tools, additional information, and data available on the site that may be of interest to the group.
The group is currently closed to private industry to ensure protection of data and information, and to facilitate open communication among members.
Iowa DOT and Ohio DOT share the following comments about GSAM:
| |
“Our management is paying attention to what we are learning from this group, and it is our hope that we can take from others successes and failures to build a robust spatial asset management system at the Iowa DOT.” – Iowa DOT |
|
“An open forum gives like-minded professionals a central place to share ideas, view solutions, and network with other professionals who have the same issues or experience in dealing with this complicated topic.” – Ohio DOT |
|
If your organization is interested in participating in GSAM, please contact us:
Other News
Website Update
FHWA has updated the GIS in Transportation website at www.gis.fhwa.dot.gov. The new website offers information on GIS events, industry news, and innovative GIS applications from around the country, as well as the FHWA GIS in Transportation quarterly webcasts and newsletters.
The website also includes new ways to stay in touch and informed about events through an email listserv, Twitter ‘tweets,’ and an RSS feed.
To sign up for the listserv or access the Twitter and RSS feed options, please see the “Connect” section in the lower right-hand corner of the website.
Reports
FHWA produces reports on uses of GIS tools and applications to support transportation decision-making. Most recently, FHWA released Applications of GIS for Livability in March 2011. The report summarizes the results of a study conducted to assess how GIS applications are being used to identify, evaluate, and assess livability issues from a transportation point of view.
This report and others are available at www.gis.fhwa.dot.gov. Please visit the site to learn more or to submit information about your agency's transportation GIS applications.
For More Information
For more information about this newsletter, please contact Mark Sarmiento, FHWA Office of Planning, at mark.sarmiento@dot.gov.