WINTER 2011
A Newsletter from the Federal Highway Administration (FHWA)
www.gis.fhwa.dot.gov
A Look at Buncombe County's (North Carolina) Multi-Hazard Risk Tool
This month's Q&A is with Todd Pierce, Research Scientist at the Renaissance Computing Institute (RENCI) at the University of North Carolina (UNC)-Asheville. He discusses developing the Multi-Hazard Risk Tool.
Upcoming Events
- American Association of State Highway and Transportation Officials (AASHTO)
GIS for Transportation Symposium
Hershey, PA
March 28-30, 2011
- American Society for Photogrammetry & Remote Sensing (ASPRS)
Opportunities for Emerging Geospatial Technologies
San Diego, CA
April 26-30, 2011
Q. Why was the Risk Tool developed?
A. In September 2004, the Asheville, North Carolina, area experienced severe flooding from heavy rainfall that the remnants of Hurricanes Frances and Ivan caused. Portions of the Asheville area received up to 20 inches of rain, leading to extensive flooding that inundated many roads, bridges, houses, and businesses. The Biltmore Village area, a key tourist destination and transportation corridor, was impassable for several days due to high water, which affected transportation throughout Asheville.
The 2004 flood is just one example of the many natural hazards that affect Buncombe County and the City of Asheville. The area is also vulnerable to landslides, wildfire, high winds, and winter storms. All of these events have the potential to adversely impact the Buncombe County transportation network and threaten lives and property.
The Federal Emergency Management Agency (FEMA) requires the Buncombe County Emergency Operations Center (EOC) to submit an updated hazard mitigation plan every five years to demonstrate it has planned for disaster mitigation and response. A key part of this plan is evaluating the impact of natural hazards on transportation.
To help assess hazard impacts, the Buncombe County EOC developed the Buncombe County Multi-Hazard Risk Tool, an online mapping and reporting application.
While Buncombe County GIS staff are very responsive to EOC requests, EOC staff desired a solution that would let them view hazard datasets and generate maps and reports from their desktops. In particular, EOC staff needed a tool that would show the extent of each hazard, the total value of property parcels at risk from each hazard, and the key infrastructure and critical resources at risk during a hazard event. To meet these needs, the Risk Tool was developed as a Flash web application using the ESRI ArcGIS Server.
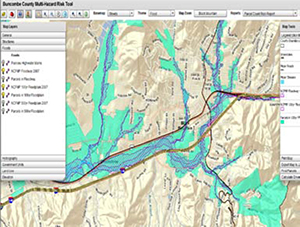
The user interface for the Risk Tool is a rich Internet application created with ArcGIS Server API for Flex. The application includes a map interface that shows the areas affected by hazards, as well as other layers such as transportation, utilities, population, and emergency responders (see Figure 1).
 Figure 1. Flood risk assessment.
The tool has a set of reports that summarize parcel counts and values for each hazard grouped by parcel classification and vacancy status, with documentation explaining the assumptions and models used to determine hazard risk. In addition, the interface includes a toolkit with functions that allow users to identify map features, find parcels, control map layer visibility and transparency, obtain map layer metadata, calculate drive times, and create a printer-ready version of the map.
Using the Risk Tool, EOC staff can answer targeted questions such as:
- What is the total property value at risk from a 100-year flood?
- Could a flood block road access to a planned subdivision?
- Could a dam failure cause damage to a planned rail hub?
- Is there any land expected to be developed that is at high risk for wildfires?
- How many parcels have unstable land that is prone to landslides?
Q. How is the Risk Tool being used?
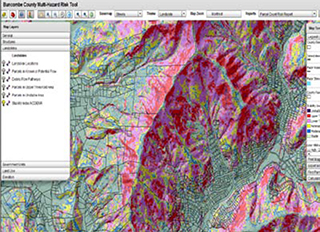
The tool is currently being used primarily for emergency response activities. In a transportation setting, it lets EOC staff evaluate how hazards might affect roads and other transportation infrastructure, such as railroads that fall within a 100-year floodplain or highways that might be affected by a landslide debris flow (see Figure 2).
In addition, the tool helps EOC planners locate communities that might be cut off from resources and evacuation routes during an emergency. Buncombe County has many communities that are built on hills and are only accessible via bridges located in adjacent valleys.
By identifying bridges that lie in a floodplain or potential debris field, planners can locate these at-risk communities and communicate information to emergency management officials to help them prepare appropriate emergency response plans.
Q. Who are the main users?
A. Currently, Angela Ledford, the Deputy Director for the County EOC, is the primary user of the Risk Tool. However, staff members at the Asheville Fire Department, including Fire Chief Scott Burnette, have also used the tool to assist with their accreditation process and for planning locations of fire stations.
 Figure 2. Landslide risk assessment.
Q. How was the Risk Tool developed?
A. Angela Ledford initiated the process by discussing her needs with RENCI, a North Carolina state agency devoted to technology transfer. The RENCI Engagement Center at UNC-Asheville was then asked to develop the Risk Tool in cooperation with the EOC. The RENCI Engagement Center is a unique collaboration between UNC-Asheville, multiple government agencies, and the public sector. Formed in 2006, the Center's focus is on decision-support tools related to natural hazards, community and regional planning, and economic development issues.
RENCI staff met multiple times with several staff from Buncombe County and the City of Asheville to determine user requirements and necessary datasets. RENCI staff then used ESRI technology to develop the Risk Tool. Four staff from the RENCI Engagement Center were involved with the user interviews. Of these four, one staff person coded the Risk Tool.
In 2009, the Risk Tool was released to Buncombe County with improvements made throughout 2010. Reports and data from the Risk Tool were incorporated into the county's latest FEMA plan update. A new version of the tool was released in February 2011.
Q. Where did you obtain data?
A. An ESRI ArcSDE database stores over 140 layers for the tool, including roads, utilities, and key structures, future land development scenarios, geographical extents for each hazard, and parcels at risk from each hazard.
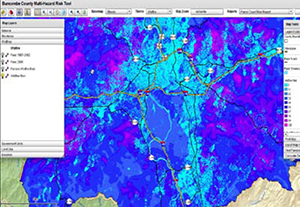
Infrastructure and parcel data layers were obtained from Buncombe County's GIS department. RENCI staff used ArcView to create risk maps for each hazard by intersecting a map of property parcels with maps of hazard extents obtained from trusted sources such as the North Carolina Department of Environmental and Natural Resources (landslides), the Southern Group of State Foresters (wildfire), and the North Carolina Floodplain Mapping Program (floods). Future development data came from the Center for Applied Geographic Information Science at the UNC at Charlotte (see Figure 3).
Q. Are there funding challenges?
A. Because RENCI performed the tool development and had funding for such activities, the Buncombe County EOC did not need to obtain any funding on its own. However, given expected North Carolina state budget cuts, there is no guaranteed funding source to maintain the tool over the next few years.
Q. How has the tool met agencies' needs?
A. According to Angela Ledford, “one of FEMA's requirements for the Hazard Mitigation Plan is to express hazard vulnerabilities in terms of dollars. The best available data at the time the original plan was written only covered flood vulnerability, and reviewing at-risk properties and calculating potential losses took days. With the Multi-Hazard Risk Tool we are able to run reports on additional hazards such as landslides and wildfire, and those same reports now take only moments to produce.”
 Figure 3. Wildfire risk assessment.
The Risk Tool was also provided to the Asheville Fire Department, which uses it to identify potential new fire station locations and make resource decisions.
Q. What have been the critical success factors?
A. One major factor contributing to the tool's success is that the tool was developed after extensive conversations to determine users' needs and requirements. Also, during tool development, staff held periodic review meetings to keep development on track. Staff modified several tool features to better reflect users' changing requirements. Tool development was a true partnership between EOC and RENCI.
The Buncombe County Risk Tool also demonstrates an important use of an online GIS. By using ESRI server technology to serve datasets through the web, the tool has helped EOC staff update hazard mitigation plans more quickly and efficiently than before. The Risk Tool also helps provide information to small towns and municipalities in Buncombe County, where planners do not have extensive in-house GIS resources. The tool facilitates online reporting and retrieval of geospatial information throughout the county and fosters a common base of geographic data for hazard planning and response.
Q. Are there future plans to change the tool?
A. RENCI plans to upgrade the tool to consider other hazards including tornados, earthquakes, and droughts. Staff also developed a public version of the tool that excludes sensitive information; this version is now online. RENCI is working to expand the tool to other local counties. So far, Risk Tools have been set up for Macon and Watauga Counties in North Carolina. These tools are available at https://renci.org/research/coastal-hazards-modeling/.
Editorial from Ed Arabas, Senior Operations and Policy Analyst, State of Oregon Department of Administrative Services
Aerial imagery and near real-time data feeds are mainstays of most transportation management and maintenance systems across the Nation. The hardware, software, and communications networks to support those systems are increasingly web-based. The public expects up-to-date traffic and road condition information at every hour and in every place.
Through long-term, collaborative partnerships between local, state, and Federal agencies, highway departments have compiled generations of ortho-imagery at ever-improving spatial resolution and quality. Oregon's first statewide generation (1993-1996) was at a one-meter resolution in black and white. Our latest generation (2009) was at a half-meter resolution and was in color and infrared.
With a little over 98,000 square miles of land area, data storage and data access requirements have significantly grown, from the first generation's 500 gigabytes to just over 6 terabytes for the latest generation. Oregon now has close to 12 terabytes of ortho-imagery. This will only grow exponentially as we begin to capture and utilize LiDAR data across the state.
For DOTs, remotely sensed data support road construction, road maintenance, environmental remediation, and highway safety improvements. The data also support land use planning, forest and agricultural management, and cadastral mapping.
Storing and distributing this imagery data across state agencies and between governmental jurisdictions can be redundant, inefficient, and ineffective. Uncoordinated application development and web optimizations might ultimately undermine our ability to successfully meet citizens' expectations. We should work together across agencies and other boundaries to simplify data storage and access issues associated with tax-supported image acquisition and use.
For more information, contact Ed Arabas at edward.p.arabas@state.or.us or 503-378-6111.
Other News
Website Update
FHWA has updated the GIS in Transportation website at www.gis.fhwa.dot.gov. The new website offers information on GIS events, industry news, and innovative GIS applications from around the country, as well as the FHWA GIS in Transportation quarterly webcasts and newsletters.
Reports
FHWA has produced several reports on uses of GIS tools and applications to support transportation decision-making. For example, a March 2010 report focused on transportation agencies' uses of web 2.0 technologies, including GIS mashup maps.
These reports are available at www.gis.fhwa.dot.gov. Please visit the site to learn more or to submit information about your agency's transportation GIS applications.
For More Information
For more information about this newsletter, please contact Mark Sarmiento, FHWA Office of Planning, at mark.sarmiento@dot.gov.