GIS Capability Maturity Model Peer Exchange
Nashville, Tennessee
September 20-21, 2016
Host Agency
Tennessee Department of Transportation

Participating Peer Agencies
Arizona Department of Transportation
Iowa Department of Transportation
Michigan Department of Transportation
North Carolina Department of Transportation
Ohio Department of Transportation
Oregon Department of Transportation
Tennessee Department of Transportation
TABLE OF CONTENTS
ACKNOWLEDGMENTS
The U.S. Department of Transportation John A. Volpe National Transportation Systems Center (Volpe Center) in Cambridge, Massachusetts, prepared this report for the Federal Highway Administration’s (FHWA) Office of Planning. The Volpe Center project team wishes to thank the participants in the peer exchange, which are listed in Appendix A, for providing their experiences, insights, and editorial review. The time they kindly provided was vital to preparing the exchange and reviewing this final report.
Back to Top
INTRODUCTION
Purpose
This report provides highlights from a peer exchange held in Nashville, TN, on September 20-21, 2016. The exchange was held as part of the Federal Highway Administration’s (FHWA) Geographic Information Systems (GIS) in Transportation program1 and was hosted by the Tennessee Department of Transportation (TDOT). The purpose of the exchange was to highlight the role that organizational assessments can play in developing a comprehensive GIS strategy, by sharing experiences between State DOTs that have undergone organizational assessments and State DOTs that have limited experience with, or have not undergone, an assessment.
Background
A Capability Maturity Model (CMM) is defined by the Urban and Regional Information Systems Association (URISA) as “a tool to assess an organization’s ability to accomplish a defined task or set of tasks.2” A CMM usually involves a numerical ranking system to be used for comparison and analysis of the organization. The ranking system shows where the organization is on a “maturity scale” for the defined task(s). Maturity refers to the level at which the task can be performed.
A GIS-specific Capability Maturity Model was developed by URISA in 2009 and was first implemented as a self-assessment tool by Washington State GIS operators.3 The results from this implementation were discussed at URISA’s Annual Conference in 2010, and CMMs were subsequently adopted as an official URISA initiative. In 2011, the first comprehensive pilot for GIS CMM was carried out by Washington and Oregon State GIS managers, alongside the development of a straw-man draft called the URISA Geospatial Management Competency Model (GMCM). This straw-man draft process was critical to making the connection between professional GIS management practices and the management of an enterprise GIS operation.
Through the use of CMMs, GIS managers and the executives who oversee the deployment of resources for GIS will be able to have meaningful dialogues regarding the structure and characteristics of a mature, well-managed enterprise GIS. While many organizations can point to successes in implementing a GIS or geospatial tool for specific projects, the completion of these projects does not necessarily reflect the maturity-level of the organization’s GIS operations. GIS projects are often performed on an ad hoc basis to address immediate needs or requests. This practice results in ignoring GIS technology as a whole and only using them when needed, which limits their effectiveness to address overall program needs. Additionally, once a tool or project is completed, organizations often cannot continue to dedicate staff time or resources to maintenance and fine-tuning, reducing the tool or project’s benefits over time.
Undertaking a CMM evaluation is a time-intensive process, and a full version might not be appropriate for organizations with limited resources or time. For such organizations, a less intensive Organizational Assessment can be performed, which is an alternative scaled-down, compressed approach to CMMs.
FHWA’s Office of Planning, Realty and Environment (HEP) sponsored the peer exchange with support from FHWA’s Office of Highway Policy Information (OHPI). The Tennessee Department of Transportation (TDOT) hosted the peer exchange in Nashville, TN. Participants included staff from TDOT, and representatives from Ohio Department of Transportation (Ohio DOT), North Carolina Department of Transportation (NCDOT), Iowa Department of Transportation (IDOT), Arizona Department of Transportation (ADOT), Michigan Department of Transportation (MDOT), and Oregon Department of Transportation (Oregon DOT). Allen Ibaugh, a representative of URISA, was also present.
The Peer Exchange was held over the course of two days. FHWA began the exchange by presenting an overview of the FHWA GIS in Transportation program and a summary of GIS Capability Maturity Models. This was followed by a series of presentations and roundtable discussions that addressed pre-identified topics of interest to both FHWA and the peers. The exchange concluded with a discussion of next steps and final remarks from FHWA that summarized recurring themes. See Appendix A for the peer exchange agenda, including roundtable discussion topics.
Overview of Peer Examples
The examples presented in the peer exchange focused on the use of CMMs/Organizational Assessments, and the attributes that support GIS maturity including “selling” GIS to upper management, GIS staff organization, data governance policies, and the role of Information Technology IT within GIS operations. Table 1 (below) provides an overview of the examples highlighted during the peer exchange.
Table 1. Overview of Examples
| Agency Name |
Completed CMM or Organizational Assessment? |
Overview of GIS Strategy and Organization |
| Arizona DOT |
Yes |
ADOT is focused on separating GIS from IT, and utilizes contractors to perform a large amount of GIS work. A CMM revealed that ADOT has four primary challenges: limited skill sets and internal knowledge, insufficient training, data quality issues, and no data collection standards. ADOT currently has a small but flexible staff that perform data documentation. |
| Iowa DOT |
Yes |
IDOT follows a centralized GIS model, and has performed multiple CMMs. IDOT is performing a geospatial inventory, a data governance initiative, and working with an IT consultant on an e-vision project and an IDOT Open Data Portal. Part of IDOT’s goal is to continue to educate all users about GIS technologies. |
| Michigan DOT |
No |
Michigan is interested in learning from other State DOTs. Currently, MDOT utilizes GIS tools and services on a project-by-project basis. |
| NCDOT |
Yes |
NCDOT has implemented a hybrid governance model that is central coordination for NCDOT’s GIS platform, technology, and standards. This model also allows for support of different business units depending on their level of GIS need and expertise. The goal is to empower our customers as much as possible by making GIS ubiquitous within the enterprise, often without them realizing it. |
| Ohio DOT |
Yes |
Ohio DOT has performed multiple rounds of assessments starting in 2002. The State DOT’s GIS group has focused on defining the value of GIS to the agency, and implementing structured management processes within the GIS office. Ohio DOT also realized the importance of executive-level support through written policies, and the use of marketing to spread the word of GIS uses across the agency and to the public. |
| Oregon DOT |
No |
Oregon DOT is interested in learning from other State DOTs about the CMM process. The State DOT does not have a direct State GIS mandate but their work is critical in supporting and supplementing several state and federal reporting requirements. They want to determine where the GIS Unit can best support the agency. |
| Tennessee DOT |
No |
TDOT is trying to optimize their organizational structure and system architecture, and are interested in learning more about CMMs. |
Back to Top
PEER EXCHANGE DISCUSSION HIGHLIGHTS
The peer exchange participants had a lively and meaningful dialogue that was aimed at exploring ideas, providing solutions for each other’s GIS-related issues, and sharing resources for addressing them. Overall, peers discussed the CMM process, as well as a series of challenges related to organizational assessments and CMMs. The discussions of the exchange were focused on:
- Capability Maturity Models & Organizational Assessments;
- GIS Awareness in Management;
- Organizing and Building a GIS Organization within an Agency; and
- Data Management.
A. Capability Maturity Models and Organizational Assessments
The focus of the peer exchange was in the lessons from two State DOTs’ (Iowa and Ohio) past organizational assessments. IDOT’s and Ohio DOT’s presentations went through their experiences with the assessments, how they benefited them, and offered recommendations and guidance to other State DOTs who were interested in performing CMMs.
Peer example: Iowa DOT has been working through the different levels of data maturity (see Table 2 below).
Table 2. Levels of Data Maturity
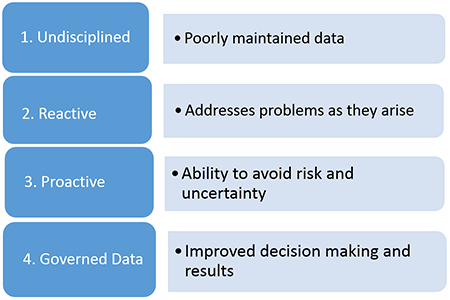
As an agency moves through the levels of maturity towards governed data, there is an exponentially bigger pay off for each level achieved. In the case of IDOT, the State DOT’s data governance falls somewhere between “reactive” and “proactive” IDOT is experiencing gaps such as not having the location of all IDOT projects and appropriate right-of-way information in their databases. IDOT does have information on all bridge locations and guardrails, and crash data that expands over 10 years. There also exist duplicate data governance efforts with the same goals, which are a result of top down initiatives.
From 1995-2016, IDOT completed only 50% of its original GIS plan. With a plan update in 2008, the goals were updated to meet the organization’s current needs. In 2012, IDOT created a new assessment of the current maturity model. Iowa’s findings for their three CMMs were as follows:
- 2004 Maturity Assessment: Iowa assessed its current status with respect to six different measures, scoring each based on a level of maturity.
- 2015 Maturity Assessment: Reassessed the maturity of the organization based on the same categories.
- 2016 Maturity Assessment: Across four categories there was a drop in rating and across the remaining two categories, the scores went up.
Iowa’s current projects include: performing a geospatial inventory; a data governance initiative; working with an IT consultant on an e-vision project; and an IDOT Open Data Portal. IDOT wants to continue to educate all users on GIS technologies, allowing them to understand data processes, including collection, storing, maintaining, and future analysis. There are geospatial forums available to all staffers in IDOT allowing them to discuss an array of topics, ask questions, and raise any concerns about GIS processes.
Iowa has been very satisfied with its results with organized data and organizational restructuring resulting from their CMM. IDOT stressed that organizational assessments are not a one-time solution; constant changes in technology result in changing needs, and in turn, there is a new need to for an organizational assessment. This process of continuous improvement makes agencies progressively more efficient.
Peer example: Ohio DOT carried out its first assessment in 2002. The process involved individuals across the GIS and IT Divisions. The assessment helped to raise GIS awareness and knowledge across the agency, and contributed to the formation of a GIS committee. There was also greater IT integration and support within GIS projects, and many Ohio DOT staff members began training in GIS. A new administrator took over the Office of Technical Services, bringing a realignment of the strategic vision for GIS.
In 2014, Ohio DOT’s performed another organizational assessment, which resulted in the Enterprise Architecture assessment report.4 The report yielded recommendations including improved technology governance, the creation of a roadway information management system, and a framework for institutional solution culture, which encourages involvement and collaboration across the agency.
Overall, the Ohio DOT GIS group has placed importance on defining and communicating the value of GIS tools and practices to the overall agency. Ohio DOT also learned to utilize structured management processes within the GIS office and across the agency in general to their advantage. Ohio DOT also learned how important it is to have executive-level support through written policies that can be relied upon, rather than sentiment alone. Using marketing to spread the word of GIS’s uses across the agency and to the public, has also proved to be an effective approach in highlighting the value of GIS technologies.
B. GIS Awareness in Management
A common problem facing the peers was one of “selling” the value of GIS technologies to upper management. This problem exists because GIS can mean something different to everyone, making it somewhat difficult to clearly define what GIS is within the context of the organization. This ubiquity results in upper management not being able to see the direct applications of GIS tools and practices for their organization, and subsequently the direct benefits. Furthermore, executive-level and middle-level management can have misaligned goals. The message might be clear for upper management who are fluent in how GIS tools are applied and what they can produce, but not clear or acted out effectively by middle-management, who may not be as knowledgeable about GIS applications. Either way, the problem lies within the lack of awareness or knowledge of GIS technologies and their relevant applications for the agency.
Peer example: NCDOT had an interesting perspective on this problem. During the exchange, NCDOT pointed out that there is no “hard sell” to upper management for GIS; at NCDOT, the worth of GIS is self-evident, as it is an enormously powerful tool. The State DOT’s problem lies with defining specific features that can be applied by the organization. Upper management may not know much about the topic of GIS or may get overwhelmed by the sheer amount of things it can do. Thus, GIS managers should be prioritizing the features of GIS software and presenting them to management for the organization to invest in. These features can be as simple as using GIS applications for the itemization of transportation projects and assets as a whole.
Peer example: Ohio DOT and Oregon DOT each brought up a similar complimentary point about increasing general knowledge of GIS within an organization. Without knowledge of GIS throughout the organization, its use will remain an external, IT-related concept. Oregon DOT has experienced this situation, as there is no direct mandate within Oregon DOT as to how GIS software should be housed or used. Consequentially, GIS tools and practices are relegated to a support role within other mandates.
Peer example: Since 2004, IDOT has consistently struggled to define the role of GIS technologies within the State DOT or what the responsibilities and functions of GIS staff person are. IDOT recommends looking at GIS as a tool and not a standalone trade. IT should be accessible to all levels of experience. Overall, IDOT believes GIS technologies are a tool that should be used to empower other initiatives or projects.
C. Building and Organizing GIS within an Agency
A challenge experienced by all peers was choosing the GIS organizational structure that best fits their agency. The peers discussed the different models of GIS organizational structure that have been tried or are being planned. The peers also pointed out that each organization has different staffing needs, resources, and technical knowledge, therefore a one-size-fits-all organizational model would not be feasible. Rather, the organizational structure should be individualized for each agency, and informed by findings from CMMs and organizational assessments.
Participants found that two general organizational models prevailed: a centralized GIS department that is either a stand-alone department or one that sits within the IT organization, or a decentralized model where GIS users are dispersed throughout all departments (including IT). The peers also discussed how there are “two sides” of GIS: System Data Management (system architecture, and software & data support - essentially keeping GIS up and running) and Analysis & Planning (the business of using GIS software for projects).
Peer example: NCDOT has incorporated multiple strategies to reorganize GIS within their IT structure. A unit was formed with multiple subgroups within the IT department. These Groups work to empower users within the agency to use GIS themselves and remove IT from the equation. This also includes a staff of the GIS scientists and power users who do advanced GIS work.
The GIS Unit is responsible for the agency’s GIS Strategic Plan. NCDOT’s GIS Strategic Plan was developed based on an internal study to assess the needs for GIS information and tools, and involved obtaining executive-level buy-in to ensure GIS is a priority going forward. The first (and the most important) step in ensuring the value of GIS work was to create a strong mission and vision statement. This Strategic Plan also clearly defined the goals that they wished to accomplish with GIS. NCDOT also believes that in order to achieve these goals, existing staff cannot have GIS functionalities continuously added to their work load, which results in an overburdened staff who must sacrifice their existing work.
As a result of the Strategic Plan process, NCDOT made a number of adjustments in its practices for structuring GIS staff and operations. The greatest challenge to NCDOT’s GIS operational effectiveness and efficiency was found to be the duplication of data, effort, and services. Instead of on a central database server or enterprise system, data could be found spread across many users’ individual computers. This would create delays in access, and force users to search for, or recreate, these data files. The elimination of duplication is the low-hanging fruit of data governance and management. NCDOT developed the communication and tools necessary to reduce duplication, open lines of communication between users, and show where tasks can be consolidated.
North Carolina’s Budget Office also undertook a study to determine how GIS should be used within their State DOT, and how to most cost-effectively consolidate State GIS initiatives within the organization. The Budget Office found it would be more efficient for them to house GIS services under their IT department, which is where the division is now located.
Peer example: ADOT focused on separating GIS as a discrete area from IT. GIS is both system data management (the support-level described by NCDOT) and geographic science analysis (GIS-use for projects). A consolidated resource model hurts the analysis unit, as it cannot devote the time and resources necessary to provide technical support while performing spatial analysis. For example, an engineer does not belong in IT simply because they know to use GIS software. ADOT’s model is more “business”-driven, rather than IT-driven, though the State DOT believes there must be a balance between the two. While ADOT believes IT is important to GIS-use as a whole, IT-related responsibilities need to be separate from the analysis side of the work. ADOT has found that by using an enterprise system, the work between the two camps can be separated.
Contractors also perform a large portion of the GIS-related work. For ADOT, the higher upfront cost of using contractors is worth the price, as there are no longer term training costs involved. The greatest challenge in using contractors for ADOT is finding a balance between in-house capabilities and outsourced capabilities. This is where organizational assessments help clarify an agency’s own capacity and skill level.
A 2001 assessment within ADOT uncovered four primary challenges: the agency had limited skill sets and internal knowledge, insufficient training, data quality issues, and no data collection standards. Currently, ADOT has a small but flexible staff that views documentation standards and internal knowledge as an asset rather than “busy work.” This mentality must be instilled into the mainstream work culture, or it will not be treated with importance. Managing GIS data as an asset contributes to reduced bottlenecks in workflows.
Peer example: IDOT chose to follow a centralized GIS administration model, consisting of two full time staff and two consultants. There are also office coordinators and GIS experts. The GIS group is in charge of asset management and strategic communication. Under the current leadership, GIS work has been deemed a core program within IDOT. IDOT also houses a number of different subject matter experts, which it can rely on at an ad-hoc basis.
IDOT’s goal is to create a central authoritative database that is software neutral (that is, can be used with both Open Source GIS and ArcGIS), available easily to the customer, and can produce data that is serviceable by machines (e.g. data that can be adopted by companies such as those that produce Automated Vehicle technologies).
Peer example: ADOT has been facilitating the onboarding process of new employees by developing a “living document” of knowledge management. This OneNote document is added to by all staff members as they perform work and learn new tasks and concepts within GIS. The document, essentially a manual, is available to all staff members. Not only does this allow new employees to lead their own trainings and learn how to accomplish specific tasks, but it also prevents loss of GIS knowledge, which comes with staff turnover.
Contractors are often a solution to staffing troubles. However, some State DOTs experience that the contracting process either limits them to too short of a contract timeline, or that the long-term contractor acquisition process is far too resource-intensive. In most cases, there are no options for anything in between these extremes. An ideal solution would be to set up a limited services option to pre-compete experienced GIS contractors.
Peer example: Tennessee and Michigan DOTs both have a system for limited service/on-call contractors by using Federal IDIQ (Indefinite Delivery, Indefinite Quantity) contracts. Both States utilize the General Services Administration schedule to ensure competitive rates. Tennessee has a task-based project management system that prioritizes what projects need to be done. Using a qualifications-based, quick-turnaround process to solicit proposals, TDOT then makes recommendations to their commissioner, who makes the decision on whom to contract with. These contractors are assigned to tasks within two years, and have three years to finish their projects.
Peer example: Over time, Oregon DOT has witnessed GIS technologies taking on a more prominent role in transportation planning and maintenance activities, which has in turn increased the need for more resources to support the new role. In order to track and quantify these GIS projects, it was important for Oregon DOT to make sure upper management was committed to project prioritization criteria. These criteria are based on a project’s merits. Their GIS steering committee only reviews projects that require 200+ hours of effort; all other smaller projects are subject to “short-burn” resourcing. Oregon DOT also uses a SharePoint site for project tracking purposes where clients enter their project request information into a simple form, which is then tracked by project type. Once approved, the GIS Unit will resource the project. The SharePoint site also offers status on the projects. This system has resulted in three plus years of metrics showing how the GIS Unit is spending its time. The GIS Unit tracks project work under four major categories, Large, Small, Data and Infrastructure. The GIS project tracking site works in association with the number of hours logged by staff for each project type. The example below represents the last three years.
| Project Type |
Percent of Total
Projects Requested |
Percent of Total
Hours Worked |
| Large |
7% |
16% |
| Small |
79% |
30% |
| Data |
6% |
7% |
| Infrastructure |
8% |
47% |
As you can see, a small percentage of project requests can create a large percentage of hours worked. Most of the Infrastructure related projects are the ongoing activities that support the Large and Small projects. For example, Infrastructure Projects include but are not limited to:
- Application Maintenance
- Customer Support (remedy tickets, user group)
- Develop and Maintain Support/Maintenance Agreements
- Emergency Mapping (AOC)
- GIS Hardware
- GIS Software (license management, testing, ELA reporting/negotiating)
- GIS Website
- Security (Determine, request and approve ‘Active Directory groups,’ server and database roles and members)
- Standards and Guidelines
- Training (provide and receive)
- Data Management
D. Data Management
The lack of data management policies and systems was found to be a common problem for the majority of peers. GIS tools are an enabler of data use, which open up and help visualize multiple layers of data. It thus behooves all agencies using GIS to maintain structured data architecture and practices. “Structured” data is defined as data that is organized and actively maintained within an Enterprise Database system; “unstructured” data refers to all data that is not actively managed and organized. Multiple participants noted that unstructured data tends to waste significant resources (time, money and effort). Unfortunately, unstructured data is more common than structured. Data ends up scattered throughout the agency (on desktops, locked within IT or known only to certain users). The challenge for most State DOTs is therefore in breaking down siloes in data storage to arrive at consistent data standards.
Peer example: NCDOT pointed out that too much information tends to be held at the top of an organization. This concentration of information creates a bottleneck in decision making processes and presents a potential loss of information if that top-level staffer leaves the organization. One possible solution to this problem is a detailed documentation process, which can be addressed through the creation of data governance expert positions. The goal of this process can be to ensure continuity for legacy/outdated data processes, and to reduce knowledge loss from the turnover of senior staff. Such a process can be politically contentious, however, as it can increase the perceived risk to staff in senior positions because of the apparent redundancy of their positions and loss of bargaining power if their knowledge is available to the agency without them.
Peer example: TDOT has limited resources in the IT division and has asked Esri for an evaluation of its GIS data management. In one limited assessment, TDOT found that some of the same data can be located in up to six different places. By moving towards an enterprise system, TDOT hopes this issue can be fixed. TDOT has the support of the management Advisory Committee for a data management system.
Peer example: Arizona DOT’s previously mentioned “living” OneNote document is also an example of data management. By building a nuanced knowledge library of technical GIS information, data and projects, the document both proliferates GIS knowledge by making it accessible to anyone who can read the document, but also breaks down barriers to retrieve data that may have been isolated on a single computer or only accessible to one person.
Peer example: In 2016, Ohio DOT created a Transportation Asset Management Plan that, in part, aims to provide a cost-efficient strategy for asset management. The plan calls for a three tier process for prioritization and provides direction during project selection and development. Included in this process, the Transportation Asset Management Advisory Group (TAMAG) provides a technical review in four stages - authoritative initial request, project requirement breakdown, prototype, and production. This review process seeks to save Ohio DOT resources and to determine if it is more cost-effective to perform the project in-house, or to create an RFP and outsource it. For example, a project for signage on curves underwent this technical review and it was found that by using in-house tools and fragmenting the workload, Ohio DOT lowered the total cost from $9M to $2.2M.
On average, the total time to needed to run through the technical review has improved. Currently, the average run-time is about 4 months. There was initial push back with delays in production even though the review can save Ohio DOT a significant amount of resources. Ohio DOT believes the delays during the review can be avoided by having a business workflow clearly established before initiating project implementation.
Back to Top
Conclusion
The Peer Exchange yielded in-depth conversations about the strategies and actions that State DOTs can take to perform organizational assessments, and to improve their GIS operations. Additionally, the group discussed the possibilities for a workshop at GIS-T and collaboration with URISA to create a CMM specifically for State DOTs.
The key takeaways from this Peer Exchange include:
CMMs and scaled assessments are critical to developing GIS departments.
An agency cannot develop without knowing where it is starting from. To implement a CMM or organizational assessment, it is important to match the scope of the assessment to an agency’s resources available to enact changes. Scaled-down, self GIS assessments of individual power users are a good first start. Assessments can be done as broadly or narrowly as agencies need. Assessments can take from five to twelve months based on previous experiences of DOTs. Agencies should plan ahead accordingly and should budget at least six months for an assessment. Peer State DOTs can be used as testing groups for benefits and limits of the URISA CMM Tool. There is a possibility for standardizing the list of questions on the URISA questionnaire in order to compare results between states.
The organizational structure of GIS, IT, and Planning departments within an agency must be addressed.
It will also be important to foster a relationship with IT and staff who own/maintain relevant data. There needs to be an equal-footing relationship between IT and the GIS/Planning offices; they’re both important to making GIS work! Resource and philosophy problems might be encountered. Similarly, working out fundamental issues within and between these offices is important. This will ensure long-term success.
Define GIS and its role within the agency.
Clearly defining GIS’s features and applications within agencies is important in order for upper management to understand its value. NCDOT recommended that agencies consider where GIS fits into an agency’s goals; it should not be used simply to have it. The agency must also stay engaged with GIS to maintain and develop general knowledge of GIS throughout the organization, and the importance of measuring the growth of these new structures is just as critical. Additionally, it is critical to consider as many minute details of a GIS program as possible—relate GIS to everyday work items to show non-power-users how much it can benefit them.
Collaborate with Human Resources to develop staffing solutions.
GIS work is highly specialized work, and the first year on the job for new employees includes significant amounts of time dedicated to training that goes far beyond simple mapmaking. Entry level GIS positions often require a combination of an IT background and interpersonal skills, which can be difficult to find. Additionally, looking at the prospects of long term professional development, GIS staffers can end up being pigeon-holed by their job titles and position descriptions, being unable to branch out to other work. Still another problem that was discussed was the issue of compensation. GIS staff are highly skilled employees, and retaining them can require a salary from $90k and up as a state employee. Compensation is not much of an issue with entry-level GIS specialists, whom are more common in the workforce. However, those with more experience and higher-end skills are more likely to take lucrative offers from private firms. In order to address these issues, it is important for public agencies to work with Human Resources to create specific classifications of positions, and also allow GIS departments to write the job descriptions themselves. Satisfactory compensation, both monetary and benefits-wise, must also be a priority. The creation of a GIS-worker union and a bonus-based pay system were also discussed as possible strategies. New mechanisms for short-term GIS contractors are also needed to fill the gaps in staffing.
Fixing resource problems and bottlenecks first will enable a much smoother and efficient road to enacting the bigger changes.
This can be accomplished in part by getting data into a structured form. This process should be a top priority for both executives AND middle management after an assessment. Structured data will form a strong foundation to build upon. Applying metadata should be integral to the new structures, as it will be highly useful for letting users know what the newly organized data is and how it can be used. The goal here is to move down the path of “data lakes” towards building a “golden record,” having clearly defined data “buckets” with accompanying metadata to describe it, and a record of use in the past and going forward.
Setting up data management policies and getting all staff members on the same page.
Agencies should be sure to get all staff members on the same page for data governance policy and philosophy, as data management can mean different things to different people. Once this is done, the agency can then move forward figuring out what data is important. The end goal is to use metadata to tell users what they don’t know to get the results they want. This could be as simple as utilizing a SharePoint site much like Oregon DOT does for budgeting. Automating content management as much as possible and defining data buckets (ex: LiDAR, documents, projects) will be the low-hanging fruit yet will set the agency up for success as it continues down the path of data structuring.
Back to Top
APPENDIX A: PEER EXCHANGE AGENDA AND PARTICIPANTS
FHWA Peer Exchange: GIS Capability Maturity Models (CMMs) and Organizational Assessments
Peer Participants
Peer Agenda
| Tuesday, September 20 |
| 8:30 – 8:45 |
Welcome and Introductions – FHWA |
| 8:45 – 9:15 |
Overview of USDOT GIS and Organizational Assessment Initiatives – FHWA |
| 9:15 – 10:00 |
What do State DOTs new to organizational assessments want to learn?
- Michigan DOT
- Oregon DOT
- Tennessee DOT
|
| 10:15 – 11:00 |
Demonstration/Presentation 1
|
| 11:00 – 11:45 |
Demonstration/Presentation 2
|
| 1:15 – 2:00 |
Demonstration/Presentation 3
|
| 2:00 – 2:45 |
Demonstration/Presentation 4
|
| 3:00 – 4:00 |
Roundtable 1: Staffing Needs and Funding Challenges – All Participants
- What staffing and funding challenges have you experienced?
- How have you overcome or addressed them?
- How have mandates affected your staffing challenges?
- Is your GIS staffing centralized or decentralized? How does that affect your organization’s performance?
|
| 4:00 – 4:15 |
Day 1 Key Points/Wrap-Up – FHWA |
| Wednesday, September 21 |
| 8:00 – 8:15 |
Day 1 Re-cap – FHWA |
| 8:15 – 9:00 |
Demonstration/Presentation 5
|
| 9:00 – 10:00 |
Roundtable 2: Capability Maturity Models – All Participants
- How does an agency develop and implement a capability maturity model?
- What are the benefits?
- What are the barriers to implementation and how can an agency overcome them?
|
| 10:15 – 11:00 |
Roundtable 3: How to Conduct an Assessment – All Participants
- How can agencies be successful at implementing the recommendations that come from organizational assessments?
- How do you get buy-in from leadership?
- What challenges have you faced and how have you overcome them?
|
| 11:00 – 11:45 |
Roundtable 4: Turning Assessments into Actions – All Participants
- How can agencies be successful at implementing the recommendations that come from organizational assessments?
- What does success look like?
|
| 11:45 - Noon |
Day 2 Key Points/Wrap-Up – FHWA |
Back to Top
FOOTNOTES

