Crowdsourced Data and Safety Performance at State DOTs and Local Partners
Case Studies of Select Transportation Agencies
July 2021

Prepared for:
Office of Planning
Federal Highway Administration
U.S. Department of Transportation
Notice
This document is disseminated under the sponsorship of the Department of Transportation in the interest of information exchange. The United States Government assumes no liability for the contents or use thereof.
The United States Government does not endorse products or manufacturers. Trade or manufacturers’ names appear herein solely because they are considered essential to the objective of this report.
| REPORT DOCUMENTATION PAGE |
Form Approved
XXX
|
| Public reporting burden for this collection of information is estimated to average 1 hour per response, including the time for reviewing instructions, searching existing data sources, gathering and maintaining the data needed, and completing and reviewing the collection of information. Send comments regarding this burden estimate or any other aspect of this collection of information, including suggestions for reducing this burden, to Washington Headquarters Services, Directorate for Information Operations and Reports, 1215 Richmond Highway, Suite 1204, Arlington, VA 22202-4302, and to the Office of Management and Budget, Paperwork Reduction Project (0704-0188), Washington, DC 20503. |
| 1. AGENCY USE ONLY (Leave blank) |
2. REPORT DATE
July 2021 |
3. REPORT TYPE AND DATES COVERED
Final Report |
4. TITLE AND SUBTITLE
Crowdsourced Data and Safety at State DOTs and Local Partners:
Case Studies of Select Transportation Agencies |
5a. FUNDING NUMBERS
HW2LA500/UF025
|
6. AUTHOR(S)
Eric Englin ORCID 0000-0003-4424-7438
Sarah Davis ORCID 0000-0002-3656-9202
|
5b. CONTRACT NUMBER |
7. PERFORMING ORGANIZATION NAME(S) AND ADDRESS(ES)
U.S. Department of Transportation
John A. Volpe National Transportation Systems Center
55 Broadway
Cambridge, MA 02142-1093
|
8. PERFORMING
DOT-VNTSC-FHWA-21-11
|
9. SPONSORING/MONITORING AGENCY NAME(S) AND ADDRESS(ES)
U.S. Department of Transportation
Federal Highway Administration
1200 New Jersey Avenue, SE
Washington, DC 20590 |
10. SPONSORING/MONITORING AGENCY REPORT NUMBER
|
| 11. SUPPLEMENTARY NOTES |
12a. DISTRIBUTION/AVAILABILITY STATEMENT
This document is available to the public on the FHWA website at https://www.gis.fhwa.dot.gov/.
|
12b. DISTRIBUTION CODE |
13. ABSTRACT (Maximum 200 words)
In supporting State Departments of Transportation (DOTs) and metropolitan planning organizations (MPOs) in using Geographic Information Systems, the Federal Highway Administration (FHWA) is publishing this Case Study Report focusing on the use of crowdsourced data collection methods and how transportation agencies use this data to improve transportation safety. To gather information for this report, the U.S. DOT Volpe National Transportation Systems Center interviewed eight transportation agencies and developed a case study focusing on their experiences. The purpose of this document is for State DOTs and MPOs to consider the notable practices that these agencies used in collecting, analyzing, and utilizing different crowdsourced data types to improve safety. |
14. SUBJECT TERMS
Geographic Information Systems (GIS), safety management, performance management, crowdsourced data |
15. NUMBER OF PAGES
32 |
| 16. PRICE CODE |
17. SECURITY CLASSIFICATION OF REPORT
Unclassified |
18. SECURITY CLASSIFICATION OF THIS PAGE
Unclassified |
19. SECURITY CLASSIFICATION OF ABSTRACT
Unclassified |
20. LIMITATION OF ABSTRACT
Unlimited |
Acknowledgments
The Federal Highway Administration and the U.S. Department of Transportation Volpe National Transportation Systems Center would like to thank the participating agencies and interviewees that made this case study report possible. The participating agencies are listed below and the particular individuals who took the time to be interviewed for this report are listed in Appendix A: Case Study Participants.
- Iowa Department of Transportation (IDOT)
- Kentucky Transportation Cabinet (KYTC)
- City of Boulder
- Denver Regional Council of Governments (DRCOG)
- Mid-Ohio Regional Planning Council (MORPC)
- Ohio Department of Transportation (ODOT)
- Oregon Department of Transportation (ODOT)
Table of Contents
| Abbreviations |
Term |
| AASHTO |
American Association of State Highway and Transportation Officials |
| ATIS |
Advanced Traveler Information Systems |
| AT |
Active Transportation |
| ATP |
Active Transportation Plan |
| CCP |
Connected Citizens Program |
| CDOT |
Colorado Department of Transportation |
| COTA |
Central Ohio Transit Authority/td>
|
| DOT |
Department of Transportation |
| DRCOG |
Denver Regional Council of Governments |
| FHWA |
Federal Highway Administration |
| GIS |
Geographic Information Systems |
| GIS-T |
GIS for Transportation |
| GSA |
General Services Administration |
| HSIP |
Highway Safety Improvement Program |
| IDOT |
Iowa Department of Transportation |
| ITS |
Intelligent Transportation Systems |
| KYTC |
Kentucky Transportation Cabinet |
| MAP-21 |
Moving Ahead for Progress in the 21st Century Act |
| MORPC |
Mid-Ohio Regional Planning Commission |
| MPO |
Metropolitan Transportation Organization |
| NHTSA |
National Highway Traffic Safety Association |
| O-D |
Origin-Destination |
| ODOT |
Ohio Department of Transportation or Oregon Department of Transportation |
| PM |
Performance Management |
| RFP |
Request for Proposal |
| STIP |
State Transportation Improvement Program |
| TIMS |
Transportation Information Management System |
| TMC |
Traffic Management Center |
| TPM |
Transportation Performance Management |
| USDOT |
United States Department of Transportation |
1. Introduction
1.1 Background
Geographic Information Systems (GIS) are an effective and increasingly essential tool at State Departments of Transportation (DOTs). With applications in all aspects of their work, GIS has helped State DOTs make better transportation decisions that are more informed and delivered in a cost-efficient, timely manner. While State DOTs have been using GIS in varying capacities over the last 30 years, new technological advancements and program initiatives have presented these agencies with new challenges. The Federal Highway Administration (FHWA) promotes the better use of GIS among State DOTs to help them address these challenges through the GIS in Transportation Program.
From the 2019 AASHTO GIS for Transportation (GIS-T) State Survey, State DOTs identified the use of crowdsourced data and related activities, like understanding safety trends and sharing this data with local partners and the public, as areas where they are interested in learning how GIS is applied.
This case study report identifies notable practices from State DOTs across the country, specifically describing:
- How State DOTs and partner agencies collect crowdsourced GIS data;
- How State DOTs and partner agencies use data collection and GIS to support safety management practices;
- Available technologies or tools and how States choose tools and methods to support decision-making;
- Challenges State DOTs face and methods for addressing them; and
- How State DOTs and partner agencies successfully share crowdsourced data with outside partners.
1.2 Methodology
FHWA used the GIS for Transportation (GIS-T) 2019 Survey, administered by the American Association of State Highway and Transportation Officials (AASHTO), to identify State agencies with experience in using GIS tools with crowdsourced data to understand and improve safety. In this survey, States submitted information about their GIS-related projects and initiatives. The team conducted further research into the list of transportation agencies identified and selected agencies that had significant experience implementing, deploying, and creating organizational “buy-in” to safety-related GIS tools and other planning products using crowdsourced data. The following agencies were willing and available for interviews:
- Iowa Department of Transportation (IDOT)
- Kentucky Transportation Cabinet (KYTC)
- City of Boulder with supplementary content from Denver Regional Council of Governments (DRCOG)
- Mid-Ohio Regional Planning Commission (MORPC) with supplementary content from Ohio Department of Transportation (ODOT)
- Oregon Department of Transportation (ODOT)
Representatives from each of the identified transportation agencies generously provided their time for a phone interview with the research team. Agency representatives were the most knowledgeable staff on how crowdsourced data and safety performance management are developed and used within their organizations. The research team developed a standardized interview guide found in Appendix B: Interview Guide, to use for each of the interviews. This allowed the research team to guide each interview consistently among agencies and produce consistent information that can be compared among respondents.
1.3 Definition of Crowdsourced Data
Crowdsourced data is broadly defined as data that has been collected from a group of people. A Michigan DOT report defined crowdsourcing as “leveraging the combined intelligence, knowledge, or experience of a group of people to answer a question, solve a problem, or manage a process.”1 In the context of transportation, crowdsourced data can vary widely depending on a set of collection types and data specifications. A few of the major considerations are outlined in Figure 1, including common data providers, how data is collected from users, and what type of data is collected and analyzed. Many new types of crowdsourced data can be generated at large scale by private technology and software companies; however, interviews with local and State agencies revealed simple but effective forms of crowdsourced GIS data, including community meetings requesting feedback by physically marking a large map.
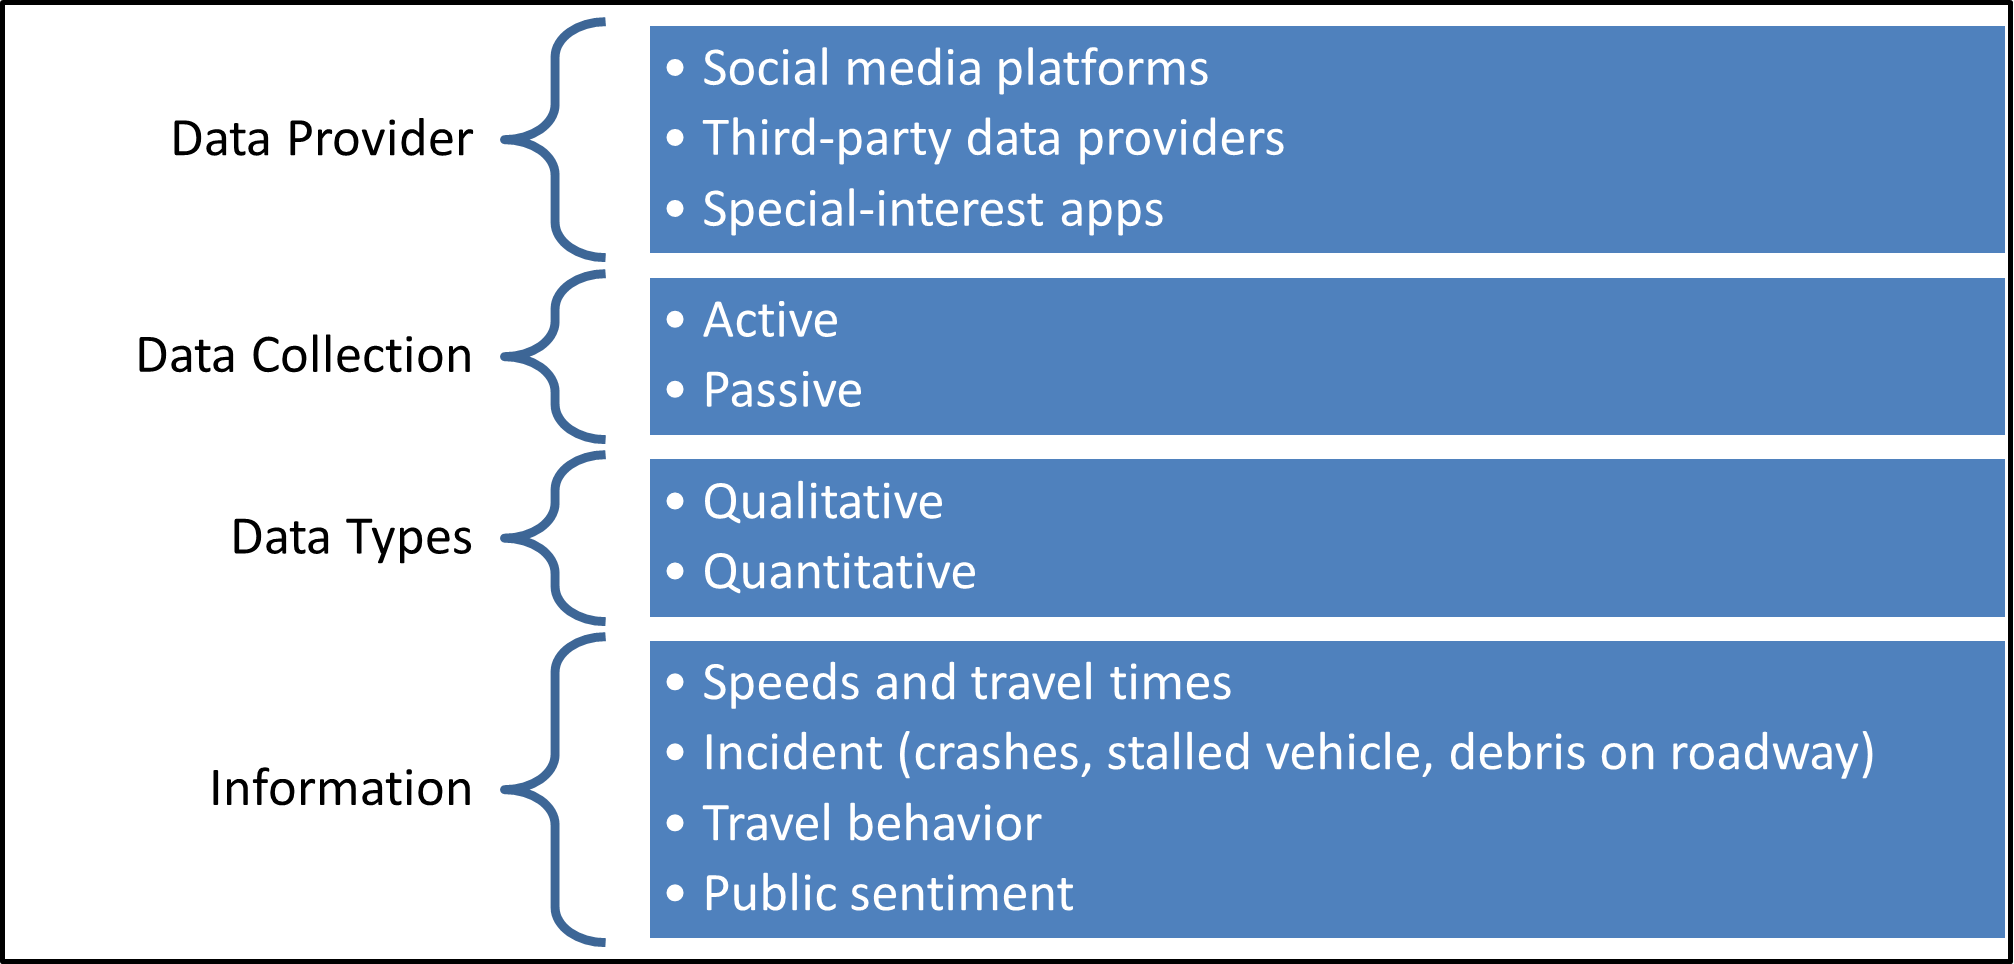
Figure 1. Illustration. Common crowdsourced data considerations.2
Crowdsourced data is a powerful tool to understand trends across geography and across time. There are many potential use cases of interest to transportation agencies. For example, crowdsourced data can help agencies understand current and historical traffic trends, including speed bottlenecks, parking, speeding, and congestion. Relatedly, agencies can use crowdsourced bicycle and pedestrian data to identify popular routes and destinations, in addition to areas that lack comfortable facilities for vulnerable road users. Existing crowdsourced data can track user routes, identify origin-destination pairs, and compile reported hazards, among other things.
1.4 Motor Vehicle Safety Performance
In 2016, FHWA published the Highway Safety Improvement Program (HSIP) and Safety Performance Management Measures (Safety PM) Final Rules in the Federal Register.3 These rules added requirements for State DOTs and metropolitan planning organizations (MPOs) to provide planning and performance measurements on safety. Both intend to significantly reduce the number of fatalities and serious injuries on public roads.
As shown in Table 1, the Safety PM Final Rule details five performance measures. State DOTs and MPOs have been mandated to track these measures since 2017. State DOTs and MPOs are also mandated to establish targets for each of these measures. These new regulations allow for a common method of tracking and communicating progress on reducing fatalities and serious injuries. By collecting this information over time, each State and region should have the ability to go beyond communication and be able to analyze and understand trends contributing to motor vehicle safety risks. Some of these trends could include inclement weather patterns, traffic congestion, and many types of roadway hazards like potholes or wildlife crossing. Like other transportation performance management practices, the goal is to build this understanding and address the root causes to increase safety performance on the roads.
Table 1. Transportation Safety Performance Measures.4
| Performance Measure |
Description |
| Number of fatalities |
The total number of persons suffering fatal injuries in a motor vehicle crash during a calendar year. |
| Rate of fatalities |
The ratio of total number of fatalities to the number of vehicle miles traveled (VMT, in 100 million VMT) in a calendar year. |
| Number of serious injuries |
The total number of persons suffering at least 1 serious injury in a motor vehicle crash during a calendar year. |
| Rate of serious injuries |
The ratio of total number of serious injuries to the number of VMT (in 100 million VMT) in a calendar year. |
| Number of non-motorized fatalities and non-motorized serious injuries |
The combined total number of non-motorized fatalities and non-motorized serious injuries involving a motor vehicle during a calendar year. |
1.5 Bicycle and Pedestrian Safety Performance
As referenced in Table 1, FHWA’s Transportation Safety Performance Measures include investigation into the number of non-motorized fatalities and non-motorized serious injuries. Further, in 2011, FHWA published a Guidebook for Developing Pedestrian and Bicycle Performance Measures.5 Although the document does not prescribe required performance measures, it recommends several options including access to community destinations, number of crashes, average travel time, miles of pedestrian/bicycle facilities, person throughput, population served by facilities, vehicle miles traveled (VMT) impacts, and volume, among others. Cities and regions take a variety of approaches―often reflecting this guidance―to measuring pedestrian and bicycle safety performance.
Many cities and regions currently utilize crashes to measure bicycle and pedestrian safety performance, and some have shifted toward Vision Zero6 goals that broadly seek to end traffic fatalities of all types.
Other cities and regions have begun to investigate crashes on a per-bicycle or pedestrian miles traveled basis to accurately compare pedestrian, bicycle, and vehicle crash data. While crashes can indicate safety levels, practitioners and officials recognize that this approach can neglect other factors, including equity. Equitable safety analysis examines safety on a deeper level, considering income level, English speaking ability, race, age, and disability within areas impacted by crashes or dangerous conditions. Safety performance measures have played and will continue to play a key role in planning a transportation system that saves lives and reduces crashes in an equitable way.
The U.S. Government Accountability Office (GAO) recently released Pedestrians and Cyclists: Better Information to States and Enhanced Performance Management Could Help DOT Improve Safety.7 This review was motivated by a significant rise in pedestrian and bicyclist fatalities between 2009 and 2019; it examines road user behaviors, National Highway Traffic Safety Association (NHTSA) countermeasures intended to guide States in selecting effective projects, and DOT use of performance management practices to ensure that safety improves. The report recommends shared national performance measures and safety behavioral countermeasures to create a safer country for all road users.
1.6 Notable Practices for Design and Implementation
To improve safety and invest thoughtfully in infrastructure, many local, regional, State, and national agencies and entities recently started pursuing new sources of vehicle, pedestrian, and bicycle data. Crowdsourced data has helped to fill an often-costly gap by demonstrating highly trafficked areas, popular trip routes, trip distances, hazards, crashes, and more. Crowdsourced data relevant to safety can include a multitude of data types, sources, and purposes; however, different types of crowdsourced data can have varied levels of overall development, volume, and bias.
Bias, volume, and development levels in transportation-related crowdsourced data present themselves in multiple ways. Pedestrian and bike route tracking platforms, including Strava, a fitness app where users track bike rides and runs, document the routes of users who turn on an app to track their walk, run, or bike ride. Similarly, platforms that ask users to input road hazards, such as Waze, rely on a group of users that choose to input data. Because these data sources pull from users who opt to track or input activity, this data can be skewed. Bicycle and pedestrian data can skew toward recreational trips rather than trips to commute, run errands, or complete other necessary tasks, while user-input hazard data can be influenced by user experience level and honesty. Because this data relies on smart phones, all data is skewed to represent roadway users with access to smart phones. Additionally, crowdsourced data can at times be imprecise in location; cell phone location data collection tools have left planners wondering whether bicyclists are travelling on a shared use path or an adjacent sidewalk. Generally, practitioners aim to check this data against existing route and count data, but this can be more difficult for pedestrian and bicycle user data because less data currently exists.
Practitioners have used existing data to supplement and adjust potentially biased crowdsourced data. For vehicle-related uses, most crowdsourced data can be checked against other data sources, including weather radar, congestion and traffic information, phone reports, and more. For active transportation uses, some practitioners developed formulas adjusting crowdsourced data as it compares to other data, such as pedestrian and bicycle count locations. Practitioners developed an alternative method to identify potential pedestrian and bicycle activity using vehicle data to identify high-density locations of short (less than 1, 3, or 5 miles) vehicle trips that could be changed to walking or biking trips. Crowdsourced data, in all its forms, represents a new―if imperfect―tool for planners and engineers to add to their toolbox of data that can increase safety for all road users.
Back to top
2. Agency and Project Profiles
Interviews with Iowa DOT, Kentucky Transportation Cabinet, the City of Boulder, Mid-Ohio Regional Planning Council, and Oregon DOT explored the ways these agencies integrate crowdsourced data with their initiatives to track and improve transportation safety. Each of these agencies utilize GIS tools to understand and communicate crowdsourced information to internal and external stakeholders; some of these efforts focus on immediate operational changes and responses while others focus on longer-term planning and investment decisions. Iowa DOT and Kentucky State Transportation Cabinet utilized crowdsourced data for vehicle safety. Alternatively, Oregon DOT, City of Boulder, and MORPC utilized crowdsourced data to understand and improve safety for alternative transportation means, such as bikers and pedestrians.
These profiles identify key components of each agency’s approach to leveraging different types of crowdsourced data related to the safety and trying to use that data to create meaningful change within the agency. As the data source is still maturing and evolving, these profiles will also identify how agencies have changed their approach over time.
2.1 Iowa DOT
The Iowa Department of Transportation’s Traffic Operations Bureau oversees the safe mobility of vehicles along the major highways and State routes. There are less than 50 full-time employees within the Traffic Operations Bureau, which oversees Advanced Traveler Information Systems (ATIS)―including Iowa’s 511―and monitors vehicle traffic and safety on the State’s major roadways. An important subgroup within the Traffic Operations Bureau is the State Traffic Management Center (TMC). The TMC coordinates real-time response to traffic and safety issues occurring on major Iowa roadways.
Iowa DOT’s TMC was an early adopter of Waze data. The agency began a partnership through the Waze Connected Citizen Program (CCP) in 2014, a program that created a method to share Waze data on traffic events with Iowa DOT. Prior to 2014, the TMC primarily tracked crashes and safety events through law enforcement. Given the size of Iowa, the TMC realized that this data likely had significant gaps, and crowdsourced data provided an opportunity to identify and support these crashes in real-time, especially in rural areas. Similarly, the TMC added speed data through a procurement process with Inrix. This provided a new type of data―average speeds and bottlenecks by roadway―that the TMC utilized for traffic management. Crowdsourced data allowed for the creation of public-facing GIS products while also facilitating internal agency performance tracking.
Iowa’s 511 page contains 17 GIS layers that can be turned on or off to understand different real-time traffic patterns. Figure 2 shows this public-facing map with real-time Waze events and traffic speeds displayed. The Waze GIS layer shows user-reported events pertaining to weather, traffic, crashes, closures, construction, and other roadway hazards. The TMC developed a process that filters Waze data by event type and roadway location before events are added to the public map. Similarly, traffic speeds come from Google traffic layer. Although this does not give historical data, it provides further context on the 511 page that the public may find useful.
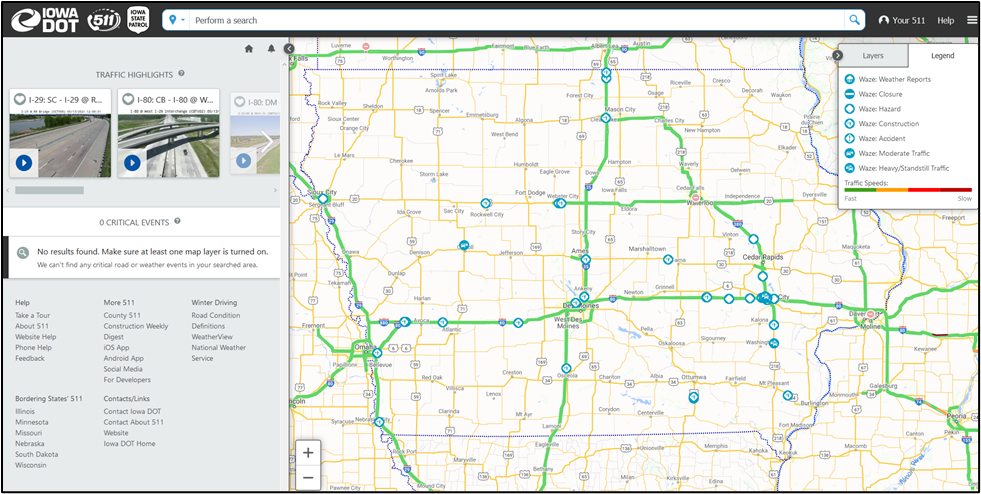
Figure 2. Illustration. Iowa DOT 511 Public Page shows major roadways along with layers from crowdsourced data (Waze events, traffic speed layers displayed). Image courtesy of Iowa DOT.
Iowa also uses data for internal performance monitoring. Figure 3 shows the incident tracking for each district in Iowa. Waze initially identified 22 percent of the total crashes on Iowa’s roadways for the given period. This number is significant as it is disproportionately higher in some districts. Iowa’s TMC has come to rely on this data as a critical source of crash data in their State, which impacts safety performance and response times because these crashes would be identified later or potentially would not be identified at all if not for crowdsourced data. This allows for better decision-making and faster response-times through more accurate safety tracking.
Iowa DOT
Traffic Management Center Performance Measurements
| Incident Totals by Detection |
| The total number of incidents (an event on the roadway which affects or can affect normal traffic flow) during a given period. |
| Type |
Total |
% |
|
District 1* |
District 2 |
District 3 |
District 4* |
District 5 |
District 6* |
| Camera |
845 |
33% |
|
407 |
26 |
11 |
71 |
31 |
270 |
| Highway Helper |
585 |
23% |
|
187 |
1 |
1 |
88 |
2 |
305 |
| Waze |
554 |
22% |
|
270 |
16 |
13 |
61 |
22 |
164 |
| State Patrol |
148 |
6% |
|
44 |
5 |
16 |
24 |
15 |
44 |
| County Sheriff |
133 |
5% |
|
32 |
12 |
22 |
14 |
11 |
41 |
| Police |
107 |
4% |
|
51 |
1 |
8 |
10 |
1 |
36 |
| Other |
45 |
2% |
|
27 |
1 |
1 |
3 |
1 |
12 |
| Tour |
43 |
2% |
|
21 |
1 |
0 |
5 |
1 |
12 |
| Maintenance |
40 |
2% |
|
15 |
3 |
0 |
9 |
1 |
12 |
| DOT Personnel |
24 |
0.95% |
|
7 |
0 |
0 |
5 |
1 |
9 |
| Iowa Agency |
9 |
0.35% |
|
5 |
0 |
0 |
2 |
0 |
2 |
| Citizen |
4 |
0.16% |
|
3 |
0 |
0 |
0 |
0 |
1 |
| Total |
2,537 |
100% |
|
1,069 |
66 |
72 |
292 |
86 |
908 |
|
|
*-Totals include Highway Helper Incidents |
Source: Iowa DOT
Figure 3. Illustration. Iowa DOT Traffic Management Center Performance Measurements. Iowa DOT integrates Waze with other traditional data sources to track highway crashes.
2.2 Kentucky Transportation Cabinet (KYTC)
The Kentucky Transportation Cabinet (KYTC) Intelligent Transportation Systems (ITS) Department leads the integration of new data sources to support KYTC functions. The group comprises three full-time employees housed in the maintenance and IT divisions. The team has GIS expertise, application development, and general data science and analytics. This broad knowledge allows the ITS department to provide support on a wide set of problem areas and use cases at different divisions within KYTC, including snow and ice management, work zone monitoring, and crash analysis, among others.
The ITS group started out of the KYTC maintenance division. During the 2012-2013 winter, record storms increased the cabinet’s maintenance and operations cost to about 150 percent of a normal winter. The snow management team nearly ran out of salt during the winter, so the agency decided to invest in data to more efficiently use resources like salt and better prevent interstate crashes in future winters. Kentucky became the second State DOT to join Waze’s Connected Citizen Program (CCP) in 2014.
KYTC combines multiple data sources in their snow and ice operations and maintenance process. Figure 4 shows the weather radar spatially joined onto the major roadway network in the State. This data is then compared with other crowdsourced data from Waze and HERE. HERE shows roadway speeds and congested bottlenecks, and Waze pinpoints specific events happening on the roadway such as crashes or cars parked on the road shoulder. Combining multiple data sources makes it possible to understand the reality of what is happening on the roads, allowing for real-time response and decision-making.
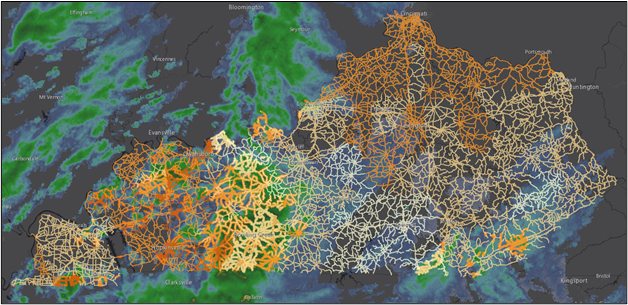
Figure 4. Illustration. KYTC weather spatially joined to Kentucky roadway network. KYTC integrates weather to understand real-time safety risks and adjust maintenance responses.
KYTC’s system is also highly integrated with reporting and alerting updates in real-time. Crowdsourced data is available live and provides an opportunity to affect drivers and decision-makers as soon as information is clearly available. Figure 5 shows the process flow of the data inputs and outputs supporting the agency and public. KYTC incorporates input data from existing assets and mandated data collection, social and crowdsourced data, and other data from local partners and other third parties. The ITS team then collects and analyzes the data to create real-time reporting web applications, automated alerts, and comprehensive databases. KYTC utilizes their Twitter page to provide alerts on crash reports throughout the major roadways in the State.
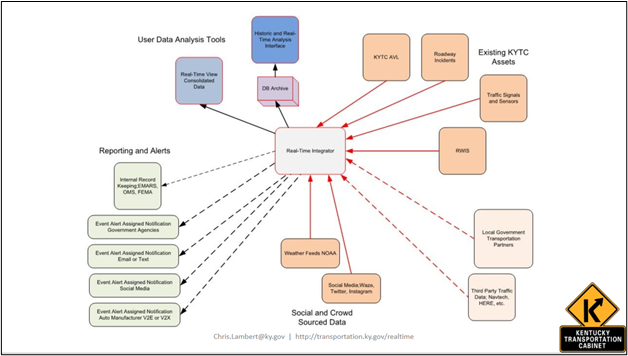
Figure 5. Illustration. KYTC data architecture shows the data inputs and outputs for reports, alerts, and data available for research and analysis.
The ITS team has become an internal data science consulting team for KYTC. Their project work has covered a wider range of the agency tasks and responsibilities. However, there are still teams that do not believe data science and newly integrated data can improve their division’s performance. The ITS team will continue working within KYTC to further develop and integrate this new model of performance and analysis in areas such as secondary crash detection, congestion mitigation, signal timing, automated direct messaging, and automated bookkeeping.
2.3 City of Boulder and Denver Regional Council of Governments (DRCOG)
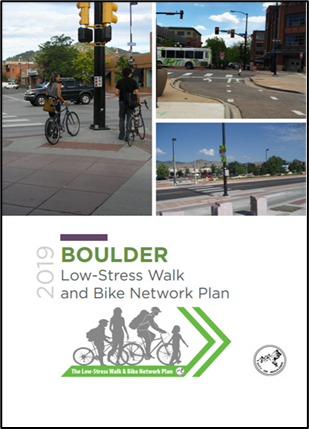
The Boulder Transportation and Mobility Division is housed within the City’s Planning Department. The division plans for active transportation modes―including walking, bicycling, and transit―within the City. Within this team of 40-50 staff members, a subgroup worked on the City of Boulder’s 2019 Low Stress Bike and Walk Plan. The subgroup created the plan in coordination with the City’s 2019 Master Transportation Plan update, in hopes that the City could prioritize future corridors and projects for safer and more accessible bike and pedestrian use.
In developing the Low Stress Bike and Walk Plan, the City of Boulder worked with Community Cycles, a local advocacy group, to create a long-term vision for what the active transportation network might look like. Having decided to pursue a new measure of bicycle safety―crashes per bicycle miles traveled―in place of more traditional methods, planners hoped to get a sense of how the on-street network was being used by cyclists. Using Strava data through a partnership with the Colorado Department of Transportation (CDOT), the team was able to make informed decisions based on data about where bicycle facilities were needed.
Source: City of Boulder
Figure 6. Illustration. Boulder’s Low-Stress Walk and Bike Network Plan was completed in 2019.8
Partnered with community stakeholders and a transportation advisory board, and armed with crowdsourced data to guide decisions, the final network plan identified what bicycle facilities should be located on which streets. Additionally, the plan prioritized what projects should be completed first, with a further plan to revisit the document every five years for context-sensitive adjustments and design changes. Furthermore, the plan uses Census data to compare projects to equity considerations, using this as a criteria for prioritization. New facilities guided by this plan will impact the community at large, with the general public being one of the project’s biggest champions. Additional partners included CDOT, local advocacy organizations, and the Denver Regional Council of Governments (DRCOG).
Boulder created an intentional, community-supported plan with the help of innovative data sources and local partners; however, the planning team learned several lessons during the development process. With Strava data, the team was limited to accessing data within Boulder’s limits, which was complicated by the fact that many bicycle trips starting, ending, or passing through the City leave its limits. With an understanding of incompleteness, the team utilized this data to assess commuting trips beyond the City’s borders. In accessing and utilizing this data, the project team also found that patience was key.
With the final plan published in 2019, Boulder continues to work toward implementing projects identified in the Low Stress Bicycle and Pedestrian Network Plan. After utilizing Strava for this network plan, the City regularly references Strava Metro data, and plans to incorporate shared micromobility data through a partnership with DRCOG, using Ride Report. The plan’s five-year update is scheduled for 2024.
2.4 Mid-Ohio Regional Planning Council and Ohio DOT
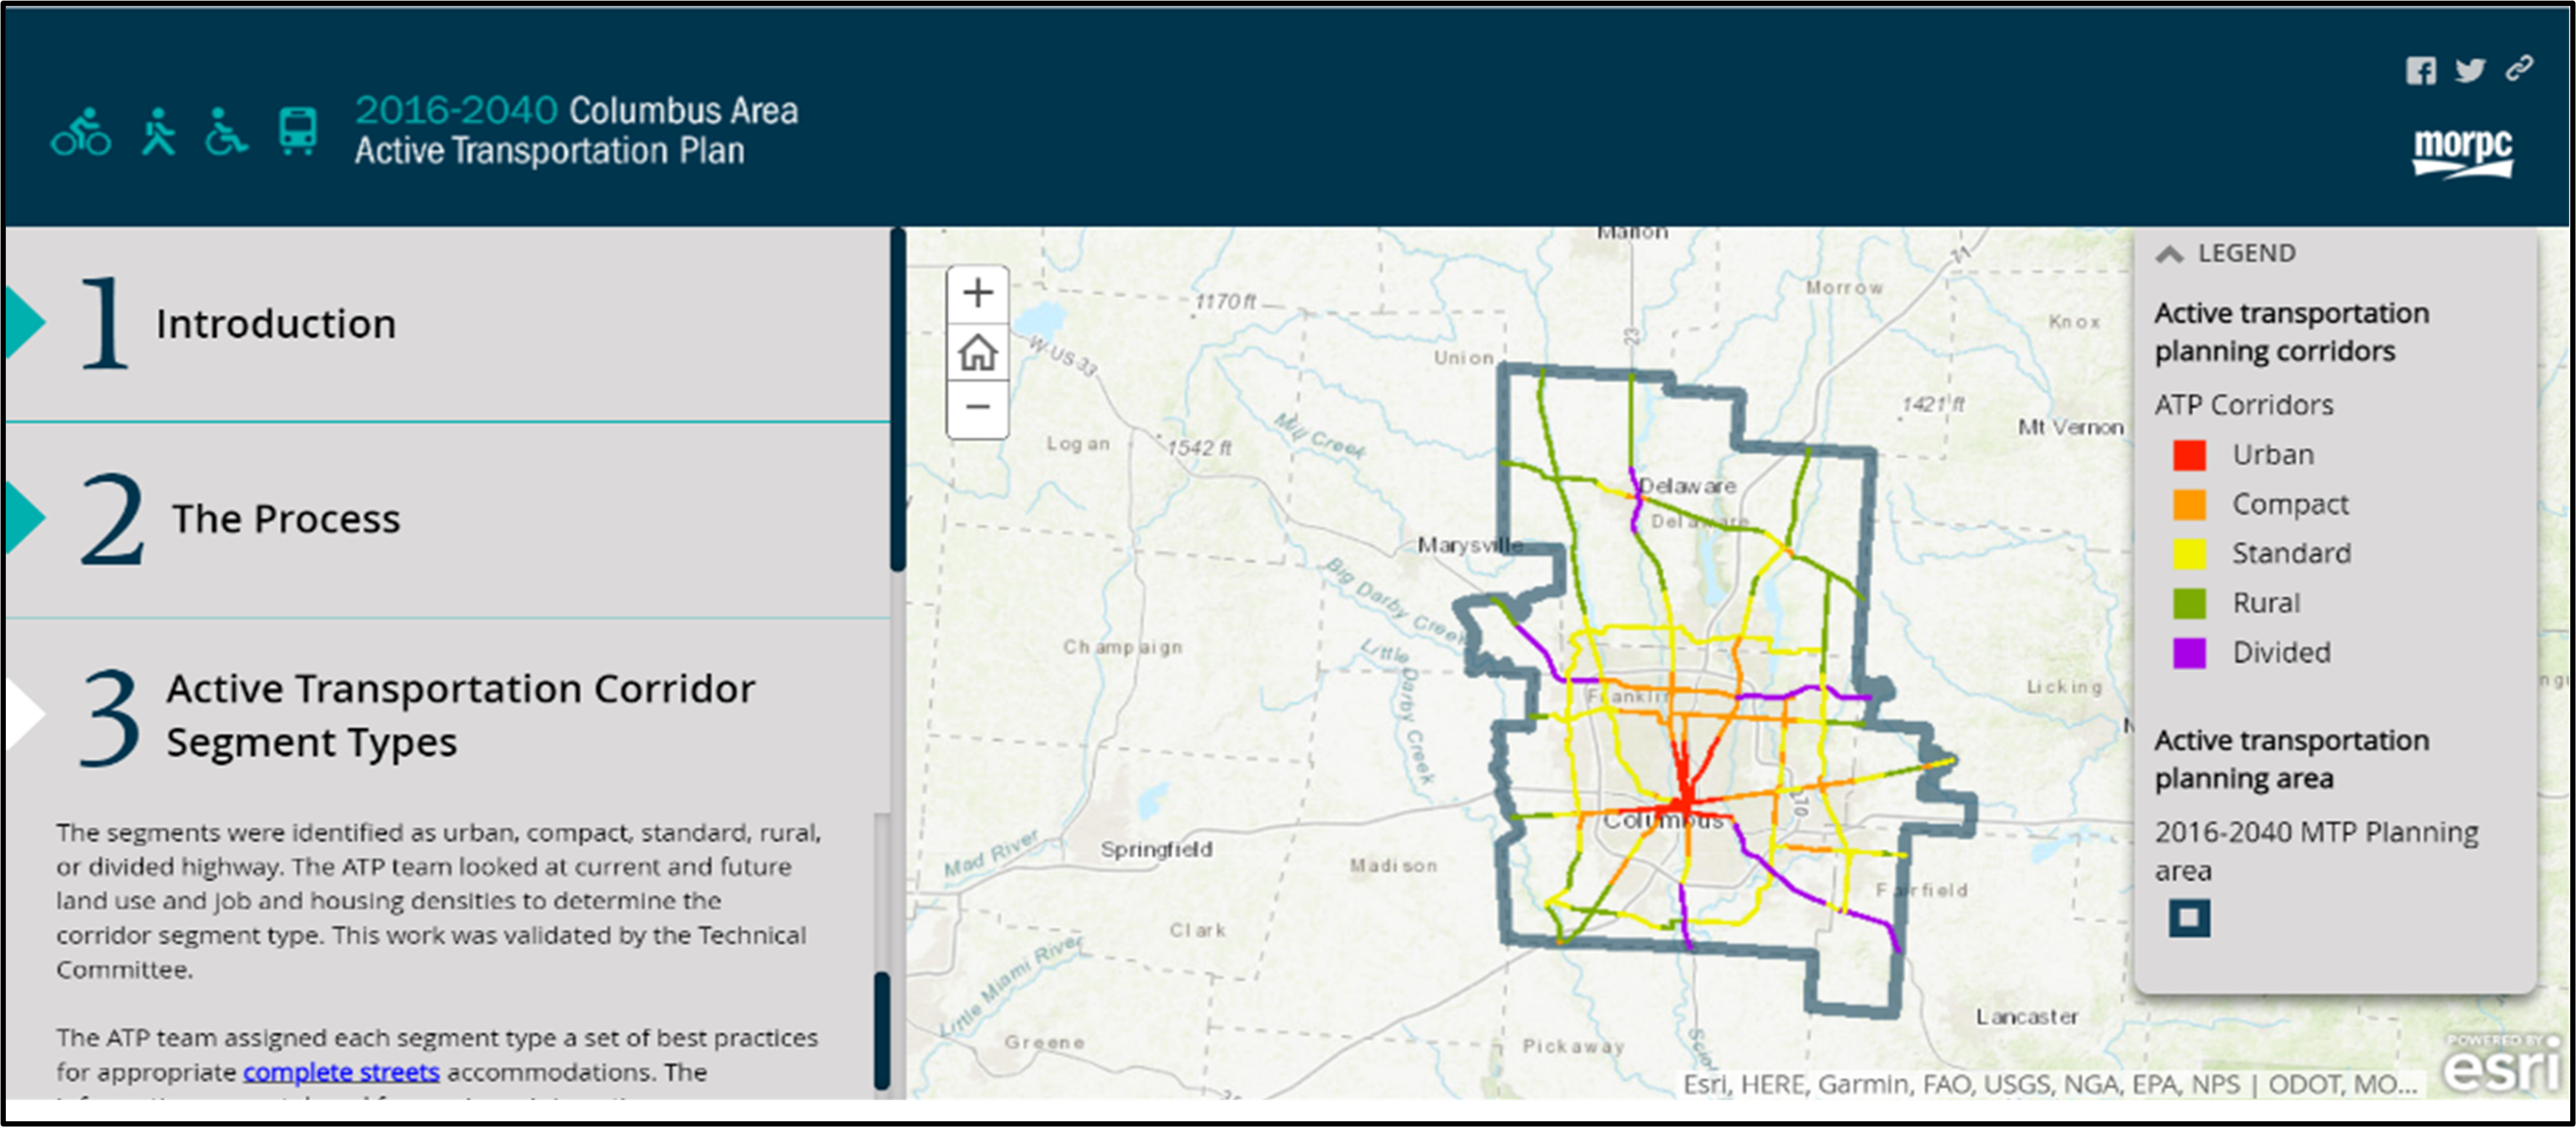
The Mid-Ohio Regional Planning Council (MORPC) is the Columbus, Ohio MPO. MORPC consists of approximately 75 staff members that work on planning, energy, air quality, and community development efforts across 15 counties that in Central Ohio. MORPC is in the process of completing their 2020 Active Transportation Plan (ATP), which encourages active transportation planning projects and investments throughout the region to create an equitable and connected network. The first iteration of ATP in 2016 examined regional corridors of significance to ensure that projects supported these corridors becoming more “complete” in coordination with local governments. During the update process in 2020, MORPC took a broad approach to the entire network to understand how to improve streets regionwide rather than only within key corridors; MORPC hoped that this would support a more equitable outcome that identified locations in need of investment.
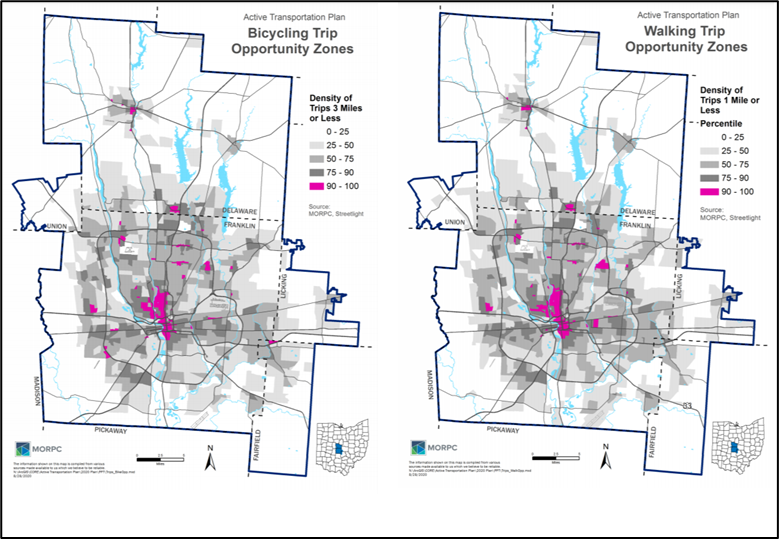
At the onset of the ATP update, MORPC conducted extensive data collection to inform the planning process; however, the project team quickly found that they lacked bicycle ridership data. As a solution to this problem, MORPC investigated Streetlight as a data source. Although Streetlight provides some pedestrian and bicycle data, the project team decided to rely on vehicle data―mainly Origin-Destination, or O-D, analyses―due to its higher volumes and increased overall reliability, as shown in Figure 7. O-D analysis allowed the project team to identify trips under one and three miles in length that could potentially be converted to an active mode. ATP 2020 is intended to serve local governments within the region, in addition to local advocates and implementers (i.e., planners and engineers who rely on ATP to make decisions). Development required close partnerships with the City of Columbus and the Central Ohio Transit Authority (COTA). LinkUs, the mobility initiative for Central Ohio, was another project partner seeking to provide a complete mobility system along key regional corridors, and further coordination with the Ohio Department of Transportation (ODOT) facilitated Streetlight data sharing.
Source: MORPC
Figure 7. Illustration. MORPC used Streetlight to identify clusters of short trips―less than one or 3 miles―throughout the corridor.
Source: MORPC
Figure 8. Illustration. The 2020 ATP is an update to the 2016 ATP, shown here. Map shows the overall planning areas and ATP corridors.
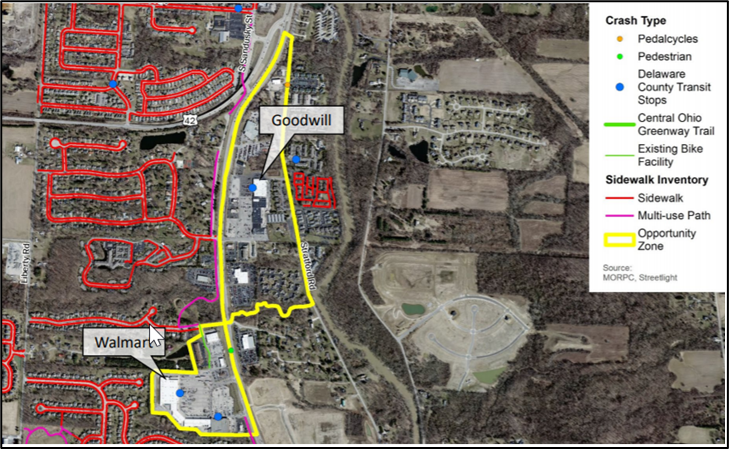
In using Streetlight data, MORPC learned several lessons about crowdsourced data. First, stakeholders are excited about this new data source, and have expressed enthusiasm when seeing related analysis at meetings. However, because Streetlight provides relative―not absolute―data, the MORPC data team has realized the lack of existing pedestrian and bike data to compare with Streetlight data. Specifically, there is a significant lack of information about existing sidewalk infrastructure, and few resources available to collect and clean data to demonstrate sidewalk locations and accessibility. Finally, when multiple facilities run close to one another, like a multi-use trail and a nearby street, it can be difficult to assign or understand where user(s) traveled due to lack of precision. For these reasons, in addition to a higher reliability of Streetlight vehicle data, MORPC relied on vehicle data only for the crowdsourced data collection portion of their assessment. Figure 9 shows an example of an area with a high density of vehicle trips less than one mile long.
Source: MORPC
Figure 9. Illustration. Maps of short trip clusters identified local pedestrian and bicycle accommodations, recent crashes, and transit access.
MORPC continues to develop ATP 2020, which is scheduled to be published in 2021. After utilizing Streetlight as part of this data collection and analysis process, MORPC hopes to continue to utilize crowdsourced data in the future. Crowdsourced data has the potential to fill a gap that demonstrates the bicycle and pedestrian travel experience; specifically, Streetlight data may be effectively calibrated with existing data on the Central Ohio Greenway trail network. Additional pedestrian and bicycle data can help this traditionally vehicle-centered region create a network that is comfortable for all road users.
2.5 Oregon DOT
At the Oregon Department of Transportation (ODOT), the Active Transportation (AT) group is responsible for planning and enhancing mobility for bikers, pedestrians, and other non-motorized vehicles in the State. The AT unit has three people, and includes significant work researching bike and pedestrian trends. As bike and pedestrian regulations and monitoring are typically done at the local level, the ODOT’s AT unit works closely with universities, Oregon MPOs, and other local partners.
In 2014, Oregon DOT became the first State transportation agency to purchase data from Strava, the fitness app. ODOT analyzed 2013 data and found about 17,700 riders, 400,000 individual bike trips, and over 5 million bicycle miles traveled. This provided a starting point to understand bicycle-riding habits across the State but were clear early on that this only provided a sample of all active transportation in the State – about 2.5 percent of total ridership when compared with an automated bike counter.9
Since that time, crowdsourced data has become more available and transportation agencies have become more sophisticated with their data use cases. ODOT is now working to create an average annual daily traffic (AADT) metric for bicyclists and pedestrians. The group is using a method called data fusion, which combines multiple network-based data sources to create reliable estimates of travel volumes across the system that can be used for travel monitoring. This is necessary for bicycle and pedestrian traffic because count locations are generally in limited locations, and crowdsourced data generally has limited users and only provides relative counts. Figure 10 shows the process of combining geospatial data sources to create traffic estimates.
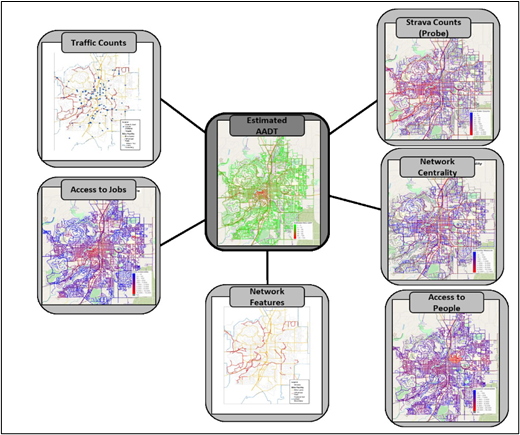
Source: Oregon DOT
Figure 10. Illustration. Oregon DOT Bicycle Data Fusion Model Schema to Estimate Bicycle Average Annual Daily Traffic (AADT) in Bend MPO. Estimated AADT derived from traffic counts, job access, network features, Strava counts, network centrality, and access to people.10
This new strategy allows a more data-driven planning and evaluation of active transportation safety in Oregon. While the State will continue tracking fatal and severe crashes as required by Federal guidance, these new traffic estimates allow the group to consider rate-based performance measures. This creates opportunities to better understand disparate safety risks in different communities and understand where people are being dissuaded from active transportation due to real or perceived safety risks on roads in their communities.
Back to top
3. Lessons Learned
Agencies may collect and use crowdsourced data to fulfill multiple objectives. Agencies’ experience with crowdsourced data depends on the purpose of their project and planning efforts, the mode of travel, and the availability of agency expertise of required technology. This section of the report features advice and lessons learned from agencies that have started or worked extensively with crowdsourced GIS data for safety management, as well as the implications of these findings for other agencies.
3.1 Crowdsourced Data Collection Process
The agencies interviewed for this case study emphasized a few shared key points on their effort to collect and institutionalize crowdsourced data collection within their organizations. These lessons learned should support agencies in similar positions to have more success understanding the key caveats and limitations to crowdsourced data, and how other agencies have been able to effectively work within these boundaries.
3.1.1 Combine and compare multiple data sources
All interviewees noted the impressive availability of new data sources and how they could impact their agency’s planning, investment, and operational responsibilities. However, with the wide variety of new data, it is important to combine data sources to feel more confident that the data closely represents bicycle, pedestrian, and vehicle system users. The data do not need to be fully duplicative, but they should align in a sensible way.
For example, one interviewee monitoring snow and ice road conditions combined time series data on a similar roadway stretch to compare weather patterns with Waze alerts for hazardous road conditions and crashes. Taken together, a pattern emerged: the weather changes first, then Waze alerts rise for hazardous road conditions, then Waze alerts rise for crashes. This data combination allows for deeper insights and greater confidence in the data trends, and this confidence made it easier for this interviewee to push for organizational changes that better incorporate these data into planning and operations practices.
3.1.2 Understand the bias and limitations in your data
All interviewees described the importance of understanding bias and other limitations in their crowdsourced data. In general, crowdsourced data is going to be gathered by a collection of individuals that does not represent the population―there are usually systemic differences between who is in a crowdsourced dataset and who is not. Many of these biases are noted throughout this report and vary based on the specific data, but the general lessons learned were to understand these biases and ensure that data users do not apply analyses when in a systemic or inequitable way.
Some of the interviewees noted a series of questions to help think through the biases in crowdsourced data from mobile devices:
- Do users need a smart phone to be included? Or will any type of phone work?
- Are users automatically tracked or do they have to opt in?
- Are users specialized in some area, or is there any type of incentive for them to create crowdsourced data?
Iowa DOT noted that these biases and limitations do not always have a large effect because they may be complementary with other data sources. In their example, navigation app-based data from Waze would help locate crashes in rural areas that might otherwise be missed. In more urban areas, the State DOT could monitor crashes using multiple overlapping sources of information to locate crashes. In this situation, the interviewee used crowdsourced data to supplement current approaches, rather than completely relying on a single biased data source.
3.1.3 Consider methods to improve crowdsourced data
Most interviewees took steps to significantly clean, filter, optimize, and extrapolate their data to make it higher quality for their project work. Many crowdsourced data types are new and constantly changing, so these methods are likely to continue evolving as well.
Oregon DOT’s data fusion model uses crowdsourced data from Strava Metro as an input, but then adds in absolute data from bike/pedestrian traffic counters, which allows the State DOT to create a network of traffic estimates. This will be the starting point for a new series of rate-based safety performance measures that would not otherwise be possible from raw crowdsourced data.
Traffic network conflation is an ongoing challenge as many crowdsourced data platforms utilize Open Street Map, which may have geometric differences to roadway network data maintained by DOTs. If crowdsourced data is mapped using Open Street Map, State DOTs must realign these data elements to the State DOTs roadway network data, which can introduce error. Similarly, pedestrian and bicycle crowdsourced data is often difficult or impossible to join to existing networks, which creates data quality issues (e.g., bicycle trips that display on interstate highways).
Finally, data providers can consider ways to capture route choice dynamics, which are lost in the aggregation of data utilized to protect user privacy. Increased data on route choice will allow practitioners to understand how vehicle volume, bicycle lanes, and crosswalks influence route-making decisions.
3.2 Organizational Opportunities
3.2.1 Consider how users perceive crowdsourced data, and frame the new data appropriately
In addition to potential data bias or shortcomings, agencies noted varying perceptions of crowdsourced data as a reliable source. While working on planning problems, users and stakeholders were often excited about new data sources. However, Waze often faced scrutiny among real-time data users compared to other more established data sources. Agencies have found success in screening crowdsourced data before publication, and some have created formulas to ensure that only data submitted by multiple users can be transmitted to the public through the agency’s systems. In some cases, agencies explicitly tag data from Waze, while in other instances―for example, communicating to maintenance or road safety crews―agencies have found it best to omit the origin of crowdsourced data that has been checked against other data sources to maintain credibility.
3.2.2 Be aware of private sector competition
While some agencies have approached crowdsourced data through the creation of their own mobile app, this approach is limited by private sector competitors. Privately developed apps are widely used across the country, and motivating users to switch to an area- or region-specific app can be difficult if not impossible. Several agencies successfully developed apps aimed at collecting data from bicyclists; however, these projects were ultimately halted as a response to low user volumes as compared to other apps.
3.2.3 Consider the pros and cons of data sharing for all jurisdictions, partners, or paying participants within a State or MPO
Several State DOTs and MPOs have utilized a one-time procurement model that allows sharing of crowdsourced data within their jurisdiction. This approach saves time and money by streamlining the often time-consuming and complicated procurement process for data access; however, before agreeing to use this process, model agencies must consider several factors. Cost sharing with data users can be required to fund data access, but can also create equity concerns because some agencies may not have enough funding available to participate. Additionally, agencies should consider in what format data will be transferred and retained during the procurement process. Finally, agencies should remember that data users can come to rely on access to a particular data platform, which might not always be available.
3.2.4 Consider a short-term pilot agreement prior to procuring any long-term agreement with a private data provider or platform
While the procurement process is often lengthy and complicated, all crowdsourced data case studies admitted that creating a fair contract that worked with their needs was difficult. By piloting a short-term agreement, agencies have time to learn what they do and do not like about a contract and a data source before refining and committing to a long-term contract.
3.2.5 Consider data transmission to public
After accessing, analyzing, and organizing crowdsourced data, some agencies wish to share this data in real-time with the public. Often, agreements limit if and how this sharing is accomplished. Some agencies use social media to distribute data, with a tool turning live data analysis into tweets about road hazards and conditions. Alternatively, some agencies rely on live maps to fulfill the same task. Finally, some agencies work with private data companies to push known road hazards, such as planned construction events, to an additional platform.
Back to top
4. Conclusion and Next Steps
New sources of data are becoming increasingly available and relied upon by agencies seeking to improve data-driven, decision-making processes. This data can create much more efficient processes and can provide a better end product, but not without risks and limitations. Agencies seeking to use crowdsourced GIS data and tools to improve safety performance should understand their organizational readiness to begin implementing these processes. Regardless of organizational maturity, all agencies can benefit from using the notable practices of improved data collection processes, more large-scale data sharing to promote overlapping regional efforts, and piloting new processes before committing to long-term investments.
Strategies for improving safety management using crowdsourced data, and using that data to inform agency practices, are evolving as more agencies and partners adopt these practices and as agencies’ needs change. Increasing use of data-driven safety management has great potential to promote and align with USDOT strategic goals and other goals like Vision Zero at State, regional, and local levels. The five highlighted projects in this case study can provide information to agencies beginning to integrate new data types and create a better picture of safety risks on their roadways.
Back to top
Appendix A: Case Study Participants
| Agency |
Department Type |
Name |
Title |
| Iowa DOT |
Traffic Operations Bureau |
Sinclair Stolle |
Traffic Management Systems Engineer |
| KYTC |
Maintenance |
Chris Lambert |
Systems Consultant |
| City of Boulder |
Active Transportation Planning |
DK Kemp |
Senior Transportation Planner |
| DRCOG |
Transportation Planning and Operations |
Emily Lindsey |
Transportation Technology Strategist |
| MORPC |
Planning |
Jennifer Noll |
Principal Planner |
| MORPC |
Planning |
Lauren Cardoni |
Senior Planner |
| Ohio DOT |
Office of Statewide Planning & Research |
Jordan Whisler |
Statewide Planning Manager |
| Oregon DOT |
Research Unit |
Josh Roll |
Data Scientist |
Appendix B: Interview Guide
Introduction
Thank you for taking the time today to discuss your agency’s work on improving safety using crowdsourced data. Working closely with FHWA, the Volpe Center is interviewing a handful of State DOTs, MPOs, and local government agencies to discuss the different challenges, best practices, and potential lessons learned regarding how different agencies are using GIS to monitor and improve safety using crowdsourced data. Our objective is to create a collection of case studies that will highlight a range of approaches and practices that can then serve as a guide to other State DOTs, MPOs, local jurisdictions, and FHWA.
Background
- Agency details:
- What is your role within your agency?
- Approximately how many employees work for your organization?
- What department or team was this project housed in?
- How many people were involved?
- What is the technical capacity of your team?
- Walk us through the use of crowdsourced data at your agency
- How did you first decide to use crowdsourced data?
- What project did your agency plan to use it for initially, and did you end up using it as planned?
- Did you develop any new GIS-based tools to use this crowdsourced data?
- Is this the first time that your agency has utilized crowdsourced data?
Purpose
- What problem(s) was this project intended to solve?
- Before starting the GIS analysis and/or implementing GIS-based tools, how did your agency track safety or improvements to safety?
- Does your agency track safety performance differently when using crowdsourced vs non-crowdsourced data?
- Has your agency changed or improved these tools since first implementation?
People
- Who were the main stakeholders in this project?
- Did this project require work across departments? Who championed the project?
- Did your agency partner or engage with any outside partners? If so, who?
Process
- Can you describe the data collection and data sharing process? Please include any legal agreements and user interactions.
- Did you have a specific end user group and/or project in mind for this work?
- Can you describe the process for designing the GIS tool, including the functionality and aesthetics?
- How did you decide what data to include and the time intervals at which the data is updated?
- Was the development of your tool(s) completed in-house or contracted out?
- What technical and organizational obstacles did you face in the development of the crowdsourced data collection tool(s)?
- What platforms and technologies did you use to create the tool?
- How does this GIS tool interface with other systems at your agency?
Reactions
- What have been the reactions of internal and external stakeholders to your GIS data/tool(s)?
- If there were intended end user groups, do these groups use the GIS data/tool like you imagined they would?
- How has the newly available crowdsourced data changed your business practices?
- Has the organization changed any decisions based on this data?
- Have other users changed any decisions based on this data?
- Has the organization changed any investment decisions based on this data?
- Are there limitations to using the crowdsourced GIS data or related tools? Are there plans to mitigate these limitations in the future?
- Has the crowdsourced GIS data provided value beyond what more traditional data sources could provide?
- Does your agency plan to undertake any other projects utilizing crowdsourced data? Have they already?
- What lessons did your team learn while working on this project?
- Has crowdsourced data impacted safety in your agency’s jurisdiction? Is there any data to support that?
Next Steps
- Do you have any relevant content/photos/links to provide?
- Would you be willing to be part of a future webinar?
- Is there anyone else that we should speak with regarding this project or platform?
Thank you very much for taking the time to speak with us today. We will take the info from this interview and several other interviews that we are conducting to develop a summary of all case studies and key takeaways. After we draft the text, we will email you a copy for your review.
U.S. Department of Transportation
John A. Volpe National Transportation Systems Center
55 Broadway
Cambridge, MA 02142-1093
617-494-2000
Volpe Center Website
Footnotes
Back to Top