Webinar 28
Pennsylvania DOT (PennDOT) and Delaware Valley Regional Planning Commission (DVRPC) Present on:
Visualizing TIPs and STIPs Using GIS
April 27, 2016
Summary of the Federal Highway Administration’s Quarterly Webinar: Applications of Geospatial Technologies in Transportation
These notes provide a summary of the PowerPoint presentation and live demonstrations discussed during the webinar and detail the question and answer session that followed the presentation.
The DVRPC PowerPoint presentation is available upon request from the webinar speaker, Chris Pollard (cpollard@dvrpc.org).
The webinar recording is available at:
https://connectdot.connectsolutions.com/p1sjxyau5sn.
Presenters
- John Parker, Transportation Planning Manager
Pennsylvania DOT (PennDOT) Bridge Program, Pennsylvania, PA
chparker@pa.gov
- Christopher Pollard, Manager of Geospatial Application Development
Delaware Valley Regional Planning Commission (DVRPC), Philadelphia, PA
cpollard@dvrpc.org
- Glenn McNichol, Senior GIS Specialist
Delaware Valley Regional Planning Commission (DVRPC), Philadelphia, PA
gmcnichol@dvrpc.org
- Brett Fusco, Project Manager
Delaware Valley Regional Planning Commission (DVRPC), Philadelphia, PA
bfusco@dvrpc.org
Participants
Approximately 100 participants attended the webinar.
Introduction
Mark Sarmiento of FHWA thanked participants for joining the webinar. This webinar was the 28th in a quarterly series of FHWA-sponsored webinars. The series deals with the application of geospatial information systems (GIS) and other geospatial technologies to transportation. The webinar featured presentations by two agencies:
- Presentation 1: PennDOT presented on a custom GIS project application for its Act 89 Transportation projects, construction projects, and TIP and STIP projects and highlighted some of the application's key features, including how it was developed and evolved into the main web application for the public.
- Presentation 2: DVRPC presented on the role that GIS plays in how they visualize, analyze, evaluate, and manage their Transportation Improvement Program (TIP).
- Question and Answer Session: PennDOT and DVRPC
- Chat Pod Questions
Mark also discussed upcoming reports on Regional Geospatial Collaboration and Return on Investment.
Presentation 1: GIS Helping to Answer the What? How Much? And When? Of PennDOT Projects
Overview
John Parker of PennDOT provided an overview of the State's efforts to consolidate and monitor all State projects on one website. With the goal of a centralized location for project information, the State faced three challenges: The first challenge was to know what was under construction or what is going to happen this year, an idea that was driven by PennDOT's press office. The second challenge was to update PennDOT's Act 89 transportation projects and P3 projects with legislators. And finally, the third challenge was to get the State Transportation Improvement Plan (STIP) and Transportation Improvement Plans (TIP) to the public in a way the general public could understand.
Background
In the past, there were multiple sites for the Construction projects, Comprehensive Transportation Funding Plan (Act 89) related projects, and STIP and TIP projects. There was demand from both the public and legislators to see the progress and keep track of these projects and the spending associated with them. One of the ways that PennDOT decided to display this information was by having all projects searchable on a map.
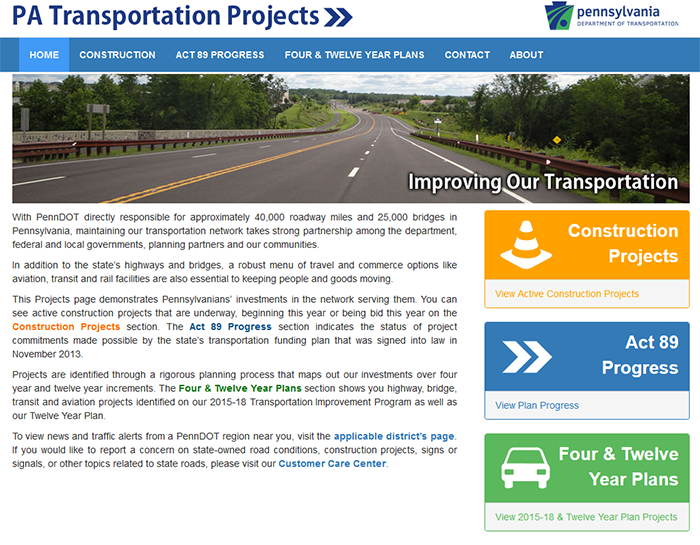
Working with the consultant, GeoDecisions, PennDOT set the goal of bringing all State-level construction projects together and displaying them in one place. On their main website, www.penndot.pa.gov, there is a section for Construction & Planned Projects, where public users can access three types of project, shown in Figure 1.
Figure 1. PennDOT GIS Web Applications
https://gis.penndot.gov/paprojects/PAProjects.aspx
Construction Projects
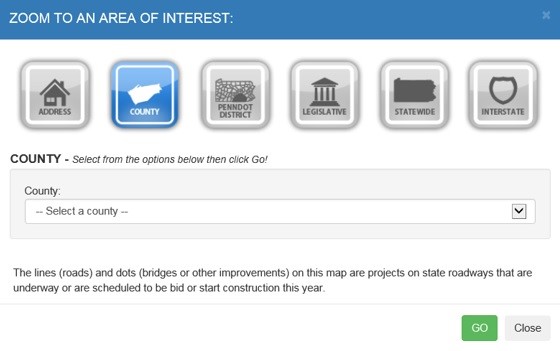
As an ongoing part of transportation developments, construction projects are important to both PennDOT and the general public. As such, it is important for PennDOT to be able to communicate to legislators and the general public about ongoing and upcoming projects, their progress, costs, and who can be contacted regarding project details. Examples of construction projects include Private Public Partnerships (P3), special initiatives, and bridge replacements. Construction projects are now searchable by address, county, engineering district, legislator or legislative district, Statewide, or corridor.
John Parker reviewed Adams County as an illustrative example of a searchable regional unit, as seen in Figure 2. By filtering the map to Adams County, all projects available for that county appeared on the screen. Using the milestone dates in the project management system, PennDOT identifies what is under construction and what is not. There are also anticipated current year construction projects highlighted under a different color on the map. While there is an option to identify Traffic Camera locations, there are currently no traffic camera data connected to the maps. Traffic camera data are available externally through the Intelligent Transportation Systems (ITS) division.
Figure 2. PennDOT GIS Web Applications
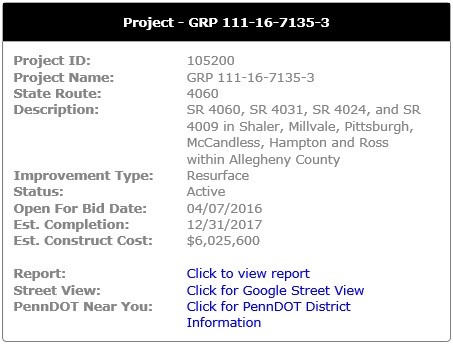
Information on anticipated projects is readily available through the Construction Projects GIS application. By clicking on the project on the map, the user can see project ID, a description of the project, how much the construction will be, and when it will be opened for bid, as seen in Figure 3. Users can also click to the Summary Report, which contains additional information, such as engineering district and contact information (e.g. the contractor name and address). Additionally, the summary report provides a link to Google Street View for a view of the project area. All of these details provide a richer narrative for construction projects that was not available in the past. This has vastly improved PennDOT's ability to communicate project details with internal leadership, external stakeholders, and the general public.
Figure 3. PennDOT GIS Web Applications
Project Reports are also available for projects that are under construction. These reports provide the contractor name, address, email, and telephone as well as similar information for the inspector in charge and the Community Relations Coordinator. Finally, included in the report is a more detailed narrative of the project physical limits on the map and the up-to-date construction costs. Similar to the anticipated projects, the consolidation of all of this information onto one site is a new and improved aspect for PennDOT projects.
Another important added feature to the GIS application is the ability to export populated information into an HTML document, Excel spreadsheet, or CSV file. Instead of having to copy and paste information or take a screen shot, the user can download the information directly. The URL itself can also be shared directly by email. The URL can then be opened by another user, who will arrive at the same filtered display of information as the original user.
Finally, the map itself has toggle features for formatting the display of the map. For example, the legend can be added and removed. Also, different views can be chosen such as ESRI aerial or Bing Aerial with applicable map labels.
Act 89 Progress
In 2013, Governor Tom Corbett signed into law Pennsylvania's Act 89, otherwise known as the Transportation Bill. The legislation required an estimated $2.3 to $2.4 billion in investments in transportation-related projects, within five years.1 Following the bill, legislators were increasingly interested in keeping track of projects that they had voted on. To meet this new demand, PennDOT developed a specific tracking application for Act 89 projects.
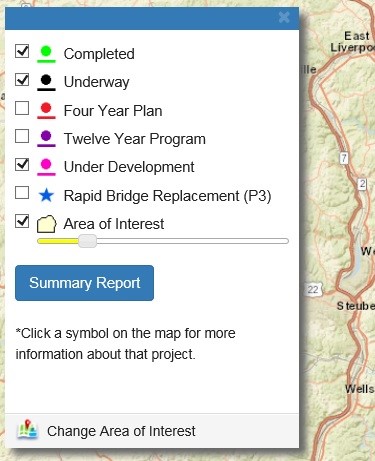
On the Act 89 map, a public user or legislator can search for projects by specific areas. Within these areas, the map can highlight what projects are complete, underway, part of the Four Year Plan or Twelve Year Plan, and Rapid Bridge Replacement Projects (a type of P3 project) as seen in Figure 4. A summary report, much like on the Construction website, produces a Project ID, title, type of work, PennDOT district, Planning Partner, State Representatives, Senator, and US Representatives related to the project, County, Route, and Project Manager contact information. Additional links include a Google Street View and the option to export the report. These reports are particularly helpful to legislators that want to share this information with her constituents.
Figure 4. PennDOT GIS Web Applications
Finally, in the “About” section for the Act 89 Progress application, PennDOT shares a link called the “Deep Link.” The information available through this link is something the agency has provided for a number of years and has received generally positive feedback on. Similar to copying and pasting URLs as mentioned earlier, the link leads to further links that are divided up in ways that allow a user to access an address, county, or district, directly, without needing to navigate through the map page first. It is now commonplace for some Pennsylvania Senators and House Representatives to include these Deep Links directly on their websites for constituents to access their respective legislative regions.
Four & Twelve Year Plans
Finally, PennDOT reviewed its GIS-based STIP and TIP applications. These plans are the first four years of the Twelve Year Program (TYP), which outlines the multimodal transportation improvements. The STIP includes all of Pennsylvania's 23 individual TIPs, corresponding to the State's Metropolitan Planning Organizations (MPOs) and Regional Planning Organizations (RPOs). The site includes links that detail the roles of MPOs and RPOs in the TYP, as well as the roles of the State Transportation Commission (STC), the Federal Highway Administration (FHWA), the Federal Transit Administration (FTA), and the Environmental Protection Agency (EPA).
The layout of the Four & Twelve Year Plan application is very similar to the previous two applications. After accessing the map, the user can search by PennDOT district, county, legislative region, planning partner, or address. As an example, John searched the application by the planning partner, Altuna. The filter options of the map include filtering by TIP, TYP, aviation location, and transit location. A summary report can also be produced for each individual project along with the same information that is provided under the Construction and Act 89 applications.
In addition to the three applications mentioned above, The following PennDOT websites are available of the public and other planning organizations to access:
Return to top
Presentation 2: Delaware Valley Regional Planning Commission (DVRPC) – Utilizing the Power of GIS to Help Visualize and Manage the Transportation Improvement Program (TIP)
As one of the largest GIS programs that the MPO manages, DVRPC discussed how GIS has played an important role in how it visualizes, analyzes, evaluates, and manages TIP projects. Chris Pollard, Glenn McNichol, and Brett Fusco discussed the types of evaluation and analysis performed with TIP data layers and other work program projects, such as the Long Range Plan (LRP), Environmental Justice (EJ), and the Congestion Management Process (CMP).
Background
Brett Fusco, Assistant Manager of Long Range Planning, reviewed the definition of an MPO and its role in the regional planning process.
DVRPC is a two-State, nine-county MPO that includes 350 municipalities and an estimated 5.7 million residents, as of 2016. By 2040, the MPO is expected to grow to 6.3 million residents. One of the most important and difficult tasks that DVRPC faces is effectively coordinating with all regional authoritative organizations on issues such as land use, which each State has direct control over.
TIP Project Evaluation Criteria
Working with the Regional Technical Committee (RTC), DVRPC's aim is to evaluate regional projects in order to align them with the goals of the TIP, LRTP, and regional objectives. To do this, the MPO created a series of criteria using the TIP GIS application, which is available on their website https://www.dvrpc.org/. While this application is not the only tool for deciding what projects are included in the TIP, it plays a major role in the evaluation process.
Project evaluation criteria for the TIP must cover the entire nine-county region, provide a quantitative analysis of benefits, use readily available data, have strong likelihood of continued availability, and provide ease of accessibility and interpretation by users and the general public.
One of the requirements DVRPC adopted for establishing evaluation criteria was to create a series of metrics that can identify different and encompass all impacts of a given project. In addition, each metric would be applicable to projects of different types (e.g. resurfacing, new lanes, etc.) and complexity. Using proprietary decision-making software, DVRPC's RTC identified nine criteria through which any project could be evaluated. Figure 5 below describes the criteria along with their weighted factors of importance.
Figure 5. DVRPC Project Criteria Weighting
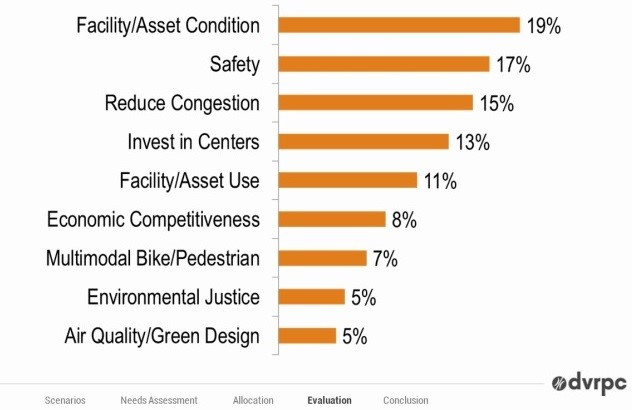
The way a project is scored overall depends on the how each criteria is calculated. With respect to Facility/Asset Condition, for example, asset condition is measured with DVRPC's asset management system. If the project will improve the condition of an asset in poor repair, a higher score will be assigned. If the project also extends the life of the asset, the project will also score points. Overall, DVRPC's objective is to choose projects that will give the largest net benefit per dollar spent, across each of the criteria above.
DVRPC also noted that an important benefit of the project scoring system is the short time required for fully evaluating a project. As an example, a set of projects that were due to be submitted on a Friday deadline were then fully evaluated and ready to be discussed with stakeholders and planning decision-makers as early as the following Tuesday morning.
The system is not fully comprehensive for purposes of project selection, however. For example, DVRPC cannot currently consider other regional priorities, input from the public, support from politicians, local government priorities, geographic distribution and equity, and fund eligibility within this scoring system. Because each of these factors is important in the decision-making process, they are taken into account separately.
Using GIS
Following the summary of the planning and project criteria process for DVRPC, Glenn McNichol, a senior GIS specialist at PennDOT, explored the technical aspects of using GIS in the TIP process.
One of the challenges in using GIS for DVRPC has been the way in which projects are mapped. Unlike in the past where locations and assets—particularly bridges and intersections—were entered as a single point feature, Glenn and his team use lines to represent each project. The reason that lines are used in the TIP evaluation process is that several of the evaluation steps require intersecting the mapped projects with other layers. Also, other aspects of the roadway where the project is located need to be determined and this is more readily accomplished by representing each project as a line feature rather than a point.
Congestion, City Centers, and Transit Scores
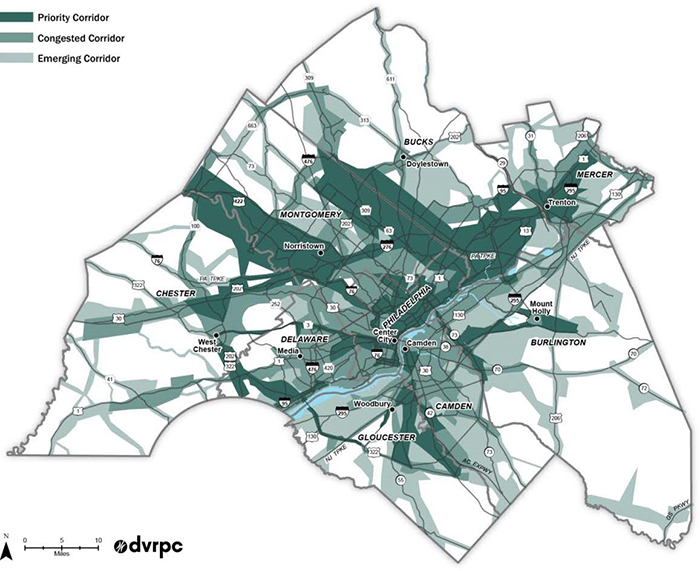
After everything is mapped, DVRPC runs an evaluation for connecting centers used in the Long Range Plan. These centers, which are represented as polygons in the GIS software, are visually compared to the mapped projects to determine if any of the project connects two or more centers. Afterwards, other attributes are added into the attribute table for each project. An example of an added attribute is a CMP corridor (seen in Figure 6 below), which is a GIS file that originates from of the congestion management process. Corridors are broken down into priority corridors, congested corridors, and emerging corridors.
Figure 6. DVRPC CMP Corridors
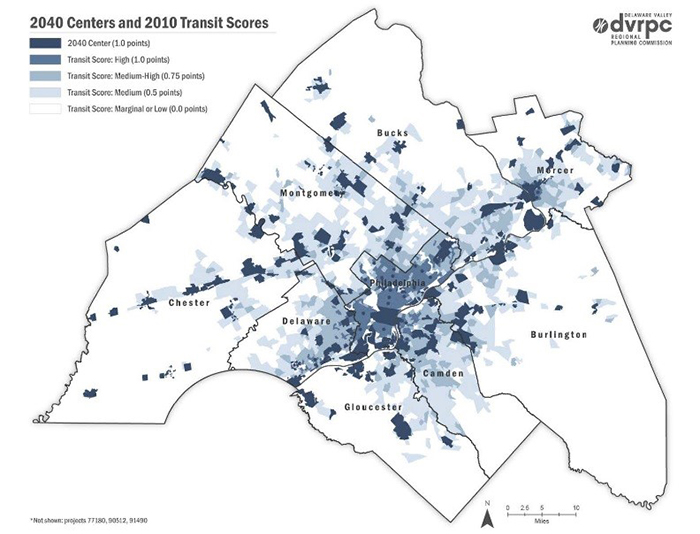
Another component of the DVRPC GIS analysis and visualization process includes identifying local urban, suburban, and rural centers and transit centers, as in Figure 7 below, to which areas receive the most and least investment. Transit centers, which include areas with stations and transit infrastructure, are evaluated as part of the 2040 Long Range plans.
Figure 7. DVRPC CMP Corridors
Environmental Justice
Organized by census tract, areas are identified by their number of Indicators of Potential Disadvantage (IPDs) as seen in Figure 8. There are eight IPDs, each representing a population group that may have a specific planning-related issue or challenge. Those eight groups are listed below:
- Non-Hispanic Minority
- Hispanic
- Limited English Proficiency (LEP)
- Persons with a Physical Disability
- Elderly Over 75 Years Of Age
- Carless Households
- Female Head of Household with Child
- Households in Poverty
Figure 8. DVRPC Environmental Justice
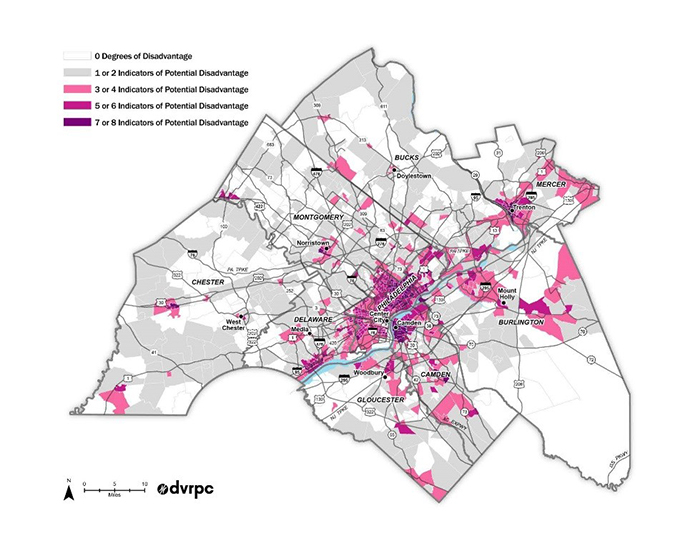
As with aforementioned centers and CMP corridors, the mapped TIP projects are intersected with a polygon layer that represents the IPD tracts. The resulting TIP project features are coded with the type of center, CMP corridor and number of IPDs that they intersect with.
Lastly, various roadway information for each project location is added to the GIS file. This information consists of Average Annual Daily Traffic (AADT) volumes, truck volumes, roadway types (based on the highest functional class of a given road), high crash locations, total length of project, and bicycle and pedestrian counts The attribute table of the GIS data is then exported into an Excel spreadsheet. The remaining analysis is performed in Excel.
The Excel analysis calculates a value for each project based on centers, CMP corridors, and Environmental Justice IPD tracts that the project intersects. In order to be more precise, each project is segmented according to which center, CMP corridor and IPD tract that the individual project intersects. This enables the assigned point values that are based on these three evaluation factors to be more accurately represented for each project. This is particularly important for lengthy projects that span multiple centers, CMP corridors or IPD tracts.
TIP Web Mapping
Chris Pollard concluded DVRPC's presentation by reviewing how DVRPC visualizes the results of their analyses via web mapping available to the public. There are several web mapping applications that display the TIP, CMP, Environmental Justice, and other tools.
The TIP is one of largest web mapping applications that DVRPC builds in terms of the detail of information it provides. Primarily, the organization uses ESRI for their GIS needs and all of the TIP information is uploaded into an Oracle database. For the final web application, DVRPC uploads their GIS information into Oracle as well, allowing all of the relevant information to be stored in one location. The geographic information generally includes longitude and latitude data for location information.
Years ago, DVRPC decided to use Google Maps API for several of their web mapping applications. It was familiar and easily accessible for the general public to navigate. There is a Street View option that allows users to immediately access location information. Similar to PennDOT, a user can search the map application by county or operator. Some of the information available is a project number, funding data by year, project title and category, detailed project description, and geographic location. The search can be refined by county, municipality, fund, category, MPMS, and general keywords.
Chris delved into an example filtering by Haverford Township in Delaware County, an area that contains a number of Southeastern Pennsylvania Transportation Authority (SEPTA) projects. SEPTA is the Philadelphia metro areas regional public transportation authority. Upon selecting a project on the map, users can view a description of the project, as well as funding and related milestones. An option to view a report for the project is also available on the application. This report summarizes all of the previous information (as well as a map) into a single format which can easily be printed or downloaded.
Part of the success of the application is DVRPC's ability to receive feedback from users and incorporate it when applicable. Within the past three years, DVRPC has received a number of comments to help improve data or correct errors in specific locations by building a tool for the web mapping application that allows users to click on the map and submit their comments. The comments are pushed directly into the Oracle database, allowing the developers to see the information without any loss of data.
Return to top
Question and Answer Session: PennDOT and DVRPC
What data are used for DVRPC's congested corridor map?
A separate set of criteria is used for identifying CMP corridors based on congestion, safety, and a number of different measures. On the website, by searching for CMP, there is an interactive web map for the congested corridors. Included is also the methodology that explains how the underlying data was obtained and lists the project managers.
In the past, how did PennDOT receive requests from legislatures and the general public regarding project information?
In the past it was a much longer process to both submit and process requests regarding project information. Most users are unaware of the technical definitions for engineering districts or press offices. The press office from each engineering district would receive numerous calls regarding each project. With the goal of directing each call to the appropriate source of the information, a user could be redirected up to six times to reach the appropriate contact. Having the project contact information readily available on PennDOT's website has limited what used to be two to three hundred calls a year in the past.
PennDOT and DVRPC are moving towards a more open data format. This has already resulted in improved data sharing for the TIPs and STIPs not only with the general public, but between States and MPOs as well. Having this information available via ESRI and Oracle web mapping applications has allowed greater communication and collaboration with planning partners.
In the past, how did DVRPC receive requests from legislatures and the general public regarding project information?
Elizabeth Schoonmaker, who manages the TIP and Capital Program at DVRPC, commented on how it is much easier now to both comment and receive comments from the public on TIP projects. DVRPC has used a web map application for about eight years. During a public comment period, up to 350 varying issues will be submitted by the public. Before, a user would have to appear at a public comment meeting, send a letter, or email in order to submit their questions.
DVRPC recently rebranded their website to include the linear features that Glenn referenced, in order to reflect the most up to date information. Similar to PennShare, having this information readily available creates a much more fluid conversation between the planning side and the general public.
Is PennDOT hearing from more MPOs and RPOs due to the development of their GIS web mapping applications?
Pennsylvania has about nine MPO and RPOs that have created their own ArcGIS online data websites, similar to PennShare. Because the ArcGIS's license expenditures are low enough, a relatively small organization has the ability to create their own open data website.
One of the benefits of an open data source is that it can be downloaded in multiple formats, which creates a more users friendly experience for the users.
Return to top
Chat Pod Questions
Are PennDOT project locations displayed immediately? If so, at what stage of project development are they allowed to be added to display?
Once the project is in design and has a road segment assigned to it, PennDOT will list the project online.
How long does PennDOT work with stakeholders on requirements to determine what to show or manage in the web portal?
On average, it will take about three months for project data to reach the web portal. This data has to be reviewed by stakeholders before it can be shared with the general public. On average, it also takes about one month to format the data into the format needed to be posted on the web application.
Is all of the PennDOT data in the web portal linked to Enterprise production data live?
Yes. All PennDOT project data displayed on the web map applications are live.
What platform or software did PennDOT use to build its maps?
PennDOT uses ESRI, Angular and Java Script to build its maps.
Did PennDOT use ArcGIS for Server and/or ArcGIS Online?
PennDOT uses both Server and ArcGIS online.
Return to top
Footnote
Return to top