Webinar 33
Mobile LiDAR - Uses at Oregon DOT
May 23, 2017
Summary of the Federal Highway Administration’s Quarterly Webinar: Applications of Geospatial Technologies in Transportation
These notes provide a summary of the presentation discussed during the webinar.
The presentation is available upon request from the webinar speaker, Chris Glantz (Christopher.Glantz@odot.state.or.us).
Presenter
- Chris Glantz, Lead Remote Sensing Surveyor
Geometronics Unit, Oregon Department of Transportation, Salem, OR
Christopher.Glantz@odot.state.or.us
Chris Glantz graduated from California State University with a Bachelor of Science in Geomatics Engineering. He is now a professional licensed land surveyor in six states. He is also an active member of the National Society of Professional Surveyors and the Professional Land Surveyors of Oregon.
Participants
Approximately 36 participants attended this webinar.
Introduction
Mark Sarmiento of the Federal Highway Administration (FHWA) thanked participants for joining the webinar. This webinar was the thirty-third in a quarterly series of FHWA-sponsored webinars. The series deals with the applications of geospatial information systems (GIS) and other geospatial technologies in transportation.
Mr. Sarmiento began the webinar by announcing the 2018 AASHTO GIS for Transportation Symposium which will be held on March 19-22, 2018 in Little Rock, AR. He directed participants to this site for more details: https://gis-t.transportation.org/. Following the announcement, participants were asked to complete a short poll inquiring about the population in attendance. The results of the poll can be found in the Appendix at the end of this report.
Mr. Sarmiento then introduced Mr. Chris Glantz from Oregon Department of Transportation (ODOT) and gave him the floor.
Presentation: Mobile LiDAR - Uses at Oregon DOT
Overview
Light Detection and Ranging (LiDAR) scanning technology provides a smarter, safer, and more efficient means of surveying geospatial information of transportation infrastructure. In this presentation, Mr. Glantz provided an explanation on how LiDAR works and gave examples on how ODOT has used LiDAR data.
LiDAR (Laser Scanning)
A passive system, such as a camera, collects energy emitted from another source (light from the sun). LiDAR, however, is an active remote sensing system meaning it collects energy that it emits.
The energy that LiDAR emits is in the form of a laser. This laser hits a spinning mirror and scans the surroundings. When the laser is intercepted by an object, it reflects back onto the mirror and sensor. The system then determines the angle and wavelength of the reflected laser energy and uses this information to compute a 3D point cloud representation of the scanned surface (Figure 1).
Figure 1. Still image from animation demonstrating how LiDAR sensing works
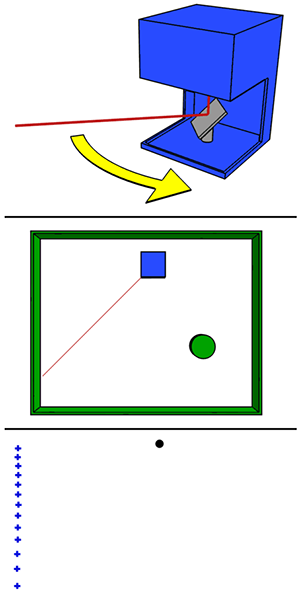
Source: Oregon DOT presentation
Types of LiDAR
Static LiDAR
Static LiDAR is when the system is mounted on a stationary tripod (see Figure 2). Static scanning captures physical geometry of objects within a certain range and orients itself based on a survey control point. ODOT uses static scanning for mapping, reverse engineering, non-contact structural inspections, structure analysis and testing, determining fit before shipping to a construction site, as-built surveys, and historical archives.
Figure 2. Static LiDAR in the field
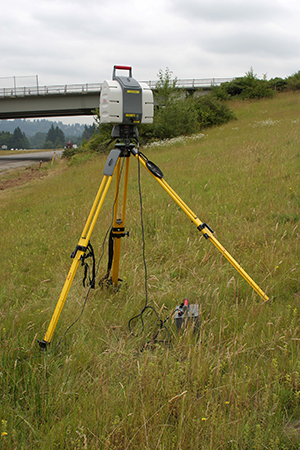
Source: Oregon DOT presentation
Terrestrial mobile LiDAR
Terrestrial mobile LiDAR is when LiDAR scanners are combined with Global Navigation Satellite Systems (GNSS) and Inertial Measurement Units (IMU) for extremely fast data collection (millions of points-per-second) and can be mounted on a land or water vehicle (Figures 3 and 4). Terrestrial mobile scanning has a much larger range than static scanning. For example, mobile scanning is able to capture features within the right-of-way such as signs, fences, guardrails, and striping. Some uses of mobile scanning include surveying, asset inventory, bridge/overhead structure clearance, structure inspections, corridor studies, as-built surveys, and virtual highway corridors.
Figure 3. Mobile LiDAR system mounted on an SUV
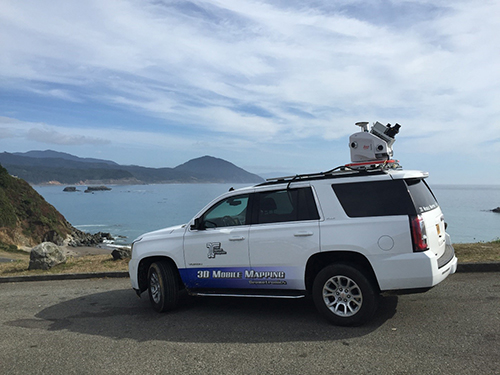
Source: Oregon DOT presentation
Figure 4. Mobile LiDAR system mounted on a boat
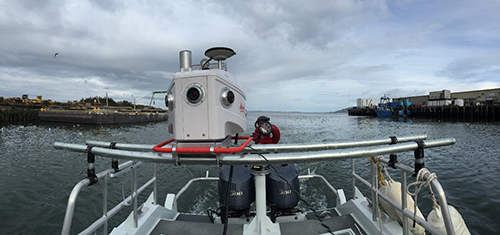
Source: Oregon DOT presentation
Airborne LiDAR
Airborne LiDAR is when a LiDAR system is mounted to an aircraft and scans the landscape below. LiDAR systems can be mounted to fixed wing for use at high altitudes, helicopter for low altitude use, or unmanned aircrafts such as a drone (Figure 5). The 3D point cloud representations acquired from the airborne LiDAR systems can be overlaid with aerial photography to create a digital surface model.
Figure 5. Airborne LiDAR mounted on an unmanned drone
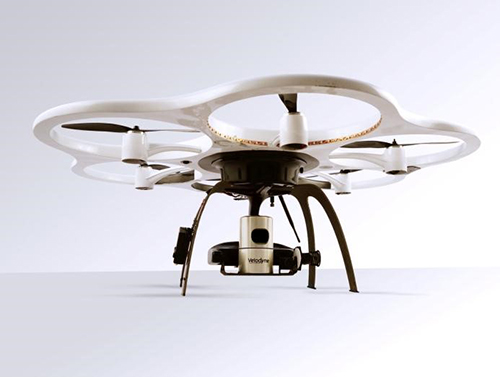
Source: Oregon DOT presentation
Future operational use of LiDAR
ODOT is building virtual highway corridors using point clouds. They view these virtual corridors as assets which they can use as the future backbone for a highway information system. The information can then be applied to future 3D design and intelligent construction systems. Eventually ODOT would like to use the aerial and oblique LiDAR imagery to create virtual highway corridors. To maintain the integrity of the virtual corridors, LiDAR scanning would be repeated and the data updated every other year in a safer, smarter, and less disruptive way.
Examples of operational use of LiDAR
Pole truck tracking
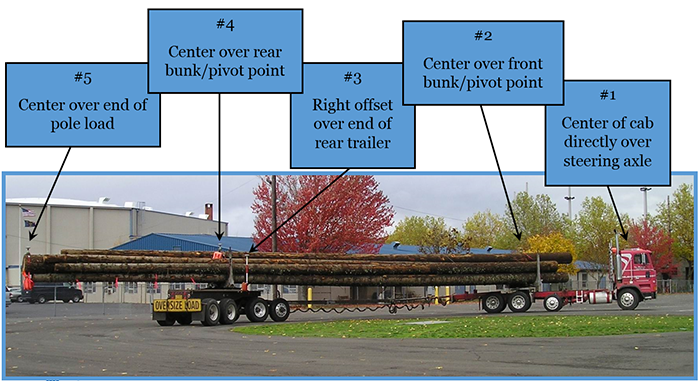
Logging is a big industry in Oregon, so there are a lot of pole trucks on the road (Figure 6). These pole trucks have large overhangs that intercept traffic during turns which can cause major problems (Figure 7). In 2008, three crashes and a fatality occurred at the intersection of U.S. 30, a high volume, multi-lane highway, and Bennett Road in Warren, OR, a pole yard access road.
Figure 6. Unique elements of a pole truck
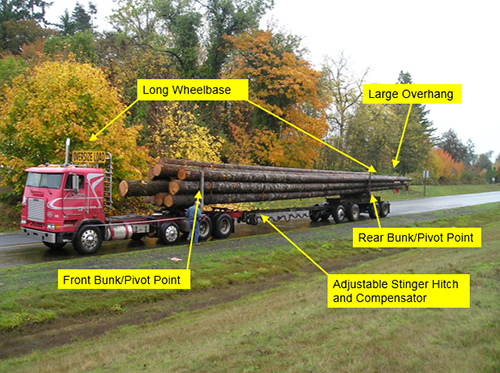
Source: Oregon DOT presentation
Figure 7. Example of pole truck overhang while turning onto pole access road
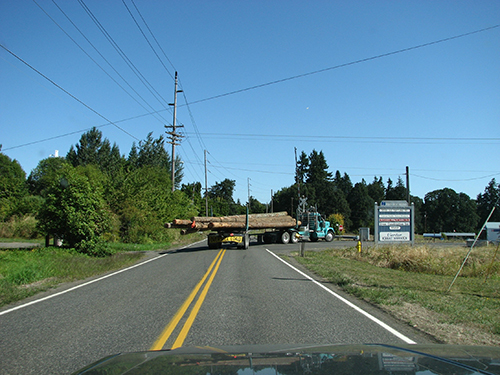
Source: Oregon DOT presentation
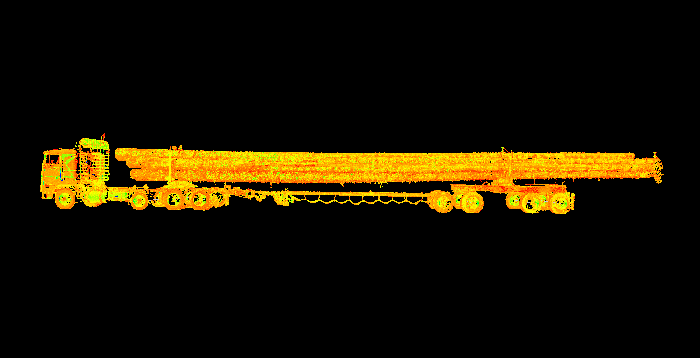
ODOT conducted a field survey at the State Fairgrounds to analyze and model pole truck turns in order to address the problem. Six paths mimicking various turn scenarios pole trucks could encounter were set up at the site (Figure 8). Two different pole trucks with different configurations were chosen for the field survey. Each truck was scanned using LiDAR technology to determine articulation and geometry of the trucks (Figure 9). Five real-time kinematic GPS antennas were mounted at various points along the truck to track the alignment (Figure 10) as the truck drove along the outlined path. Once the trucks were scanned and equipped, they were positioned at the starting point of the path and drove along the outlined path. AutoTURN 5.1, a CAD-based program that simulates low-speed turning maneuvers for highway vehicles, was used to model and analyze the data to determine the amount of overhang protruding into adjacent lanes. As a result of this study, an intersection improvement project at U.S. 30 and Bennett Road was funded to better accommodate pole trucks. The ODOT Motor Carrier Department also made changes in permitting requirements regarding the amount of overhang allowed for pole trucks.
Figure 8. Map of paths for field survey
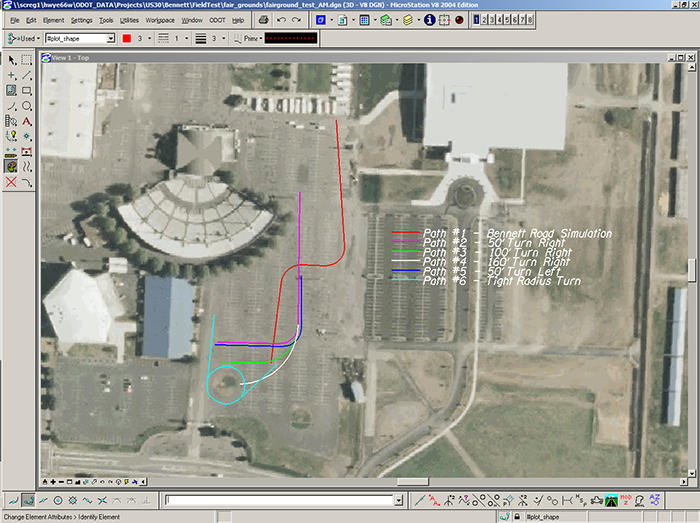
Source: Oregon DOT presentation
Figure 9. LiDAR scanning of pole truck from the field survey
Source: Oregon DOT presentation
Figure 10. Locations of mounted RTK GPS antennas
Source: Oregon DOT presentation
Tunnel passage
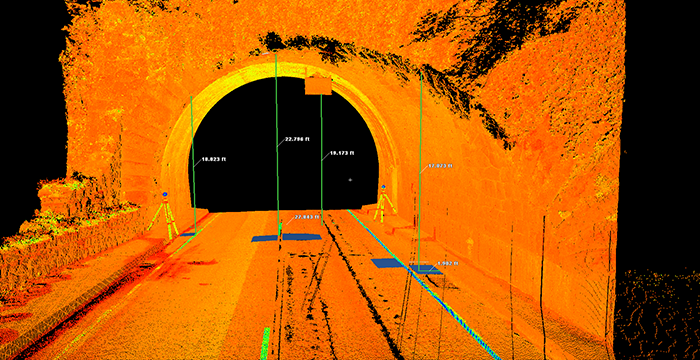
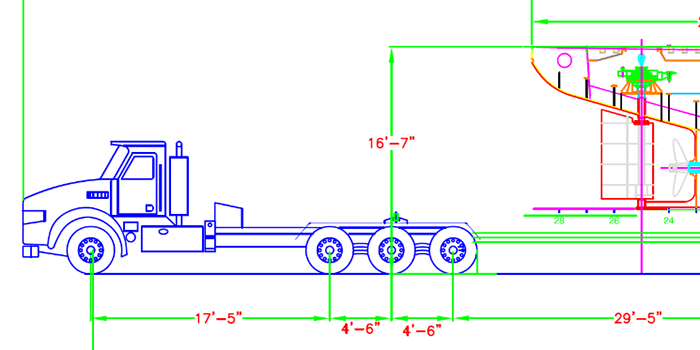
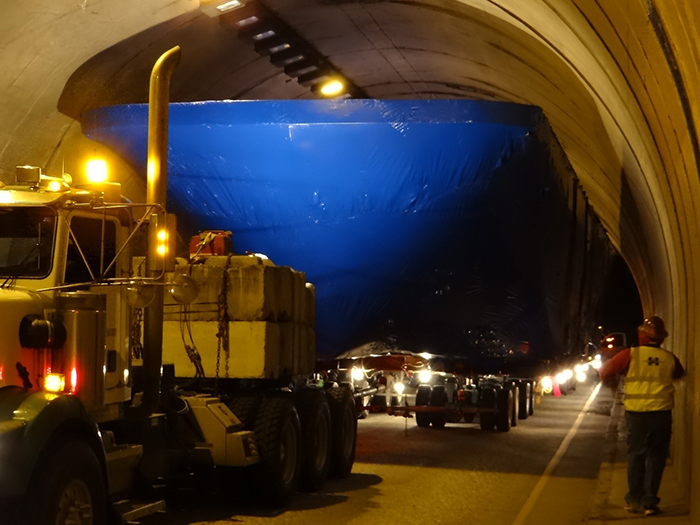
A very large ferry was built in Oregon and needed to be transported across the Cascade Mountains. The company responsible for the ferry needed to strategically map out a feasible route to transport it across the mountain range. Once the route was mapped, the company applied for an oversize load permit from ODOT’s Motor Carrier Department. The permit was denied because the designated route had a tunnel that the Motor Carrier Department didn’t think the ferry would clear. The company needed to figure out a way to get the ferry through the bridge because this particular route was the only feasible option, so they reached out to ODOT for help. ODOT had existing LiDAR data from the tunnel (Figure 11) that they were able to use to perform a clash analysis using the dimensions of the ferry and trailer (Figure 12). The clash analysis determined a ½ foot of clearance around the ferry, so the ferry was able to be moved through the tunnel (Figure 13).
Figure 11. LiDAR image of tunnel
Source: Oregon DOT presentation
Figure 12. Dimensions of the ferry and trailer
Source: Oregon DOT presentation
Figure 13. Ferry in the tunnel
Source: Oregon DOT presentation
Computing sight distance
In July of 2015, a bill was passed to raise the speed limits on highways in central and eastern Oregon (Figure 14). Higher speeds require longer sight distances needed to pass, so changes to signage and striping along the 1,200 miles of non-interstate highway needed to be made before implementation. To determine the sight distances—and thus no-passing zones—associated with the increased speed limits, ODOT used previously collected LiDAR data to determine where changes to striping and signage would occur using an automated sight distance analysis tool. In order to use the tool, the alignment of the pavement edges and centerlines of the highways (Figure 15) were traced from the LiDAR data. These alignments were then used to create a 3D model of the highway (Figures 16 and 17). Using the 3D model and the sight distance analysis tool, a graphic to display sight distance and determine no-pass zones was created (Figure 18). The final model was then overlaid on Google Earth images of the road (Figure 19) for the road crews to use and make the appropriate striping and signage changes (Figure 20).
Figure 14. Map of highways effected by the bill
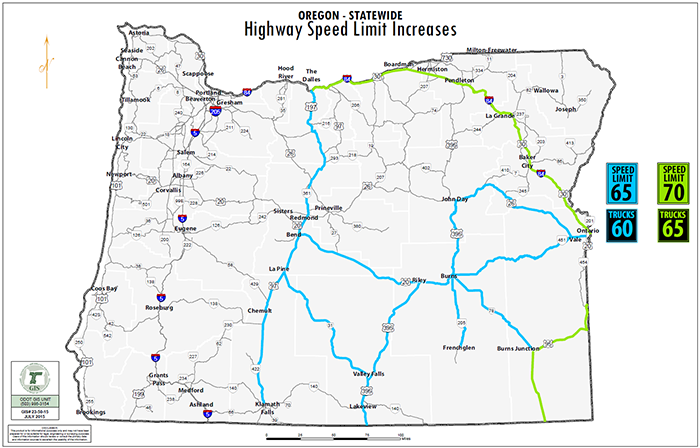
Source: Oregon DOT presentation
Figure 15. Traced centerlines and pavement edges
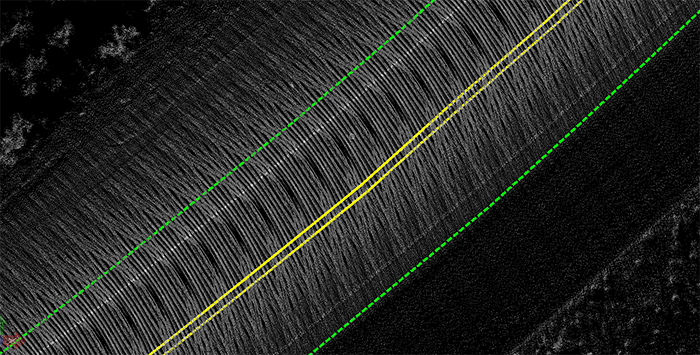
Source: Oregon DOT presentation
Figure 16. Aboveground view of 3D model
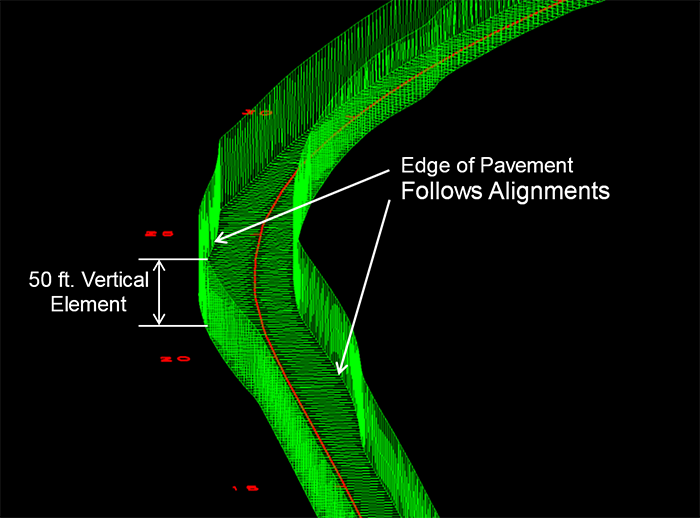
Source: Oregon DOT presentation
Figure 17. Roadway level view of 3D model
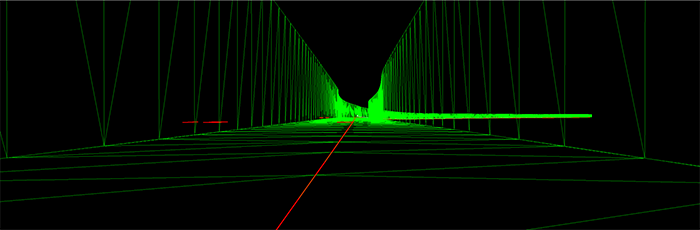
Source: Oregon DOT presentation
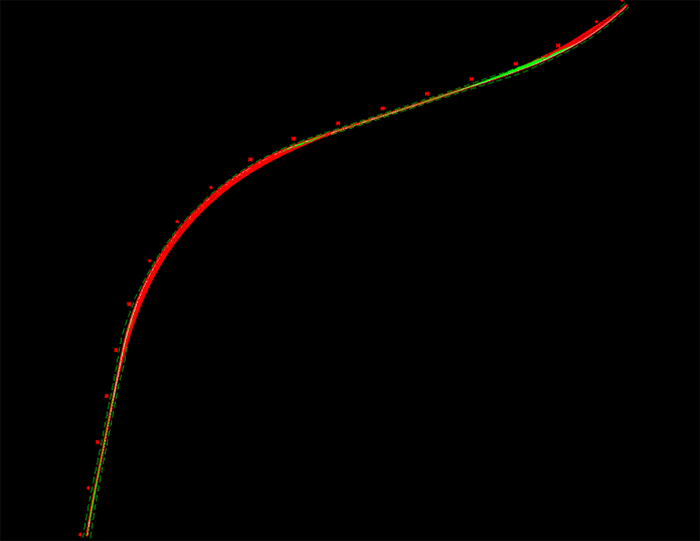
Figure 18. Results from sight distance analysis tool (red indicates no pass zones)
Source: Oregon DOT presentation
Figure 19. Final product from sight distance analysis tool overlaid with Google earth image of highway
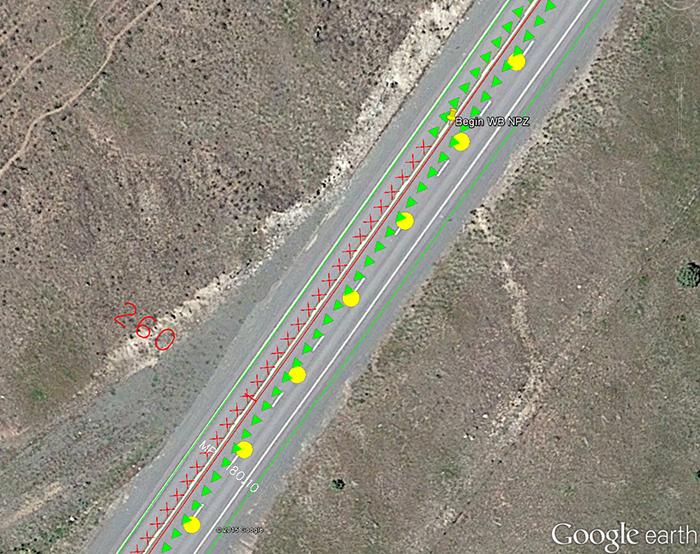
Source: Oregon DOT presentation
Figure 20. ODOT crew member marking location for striping change
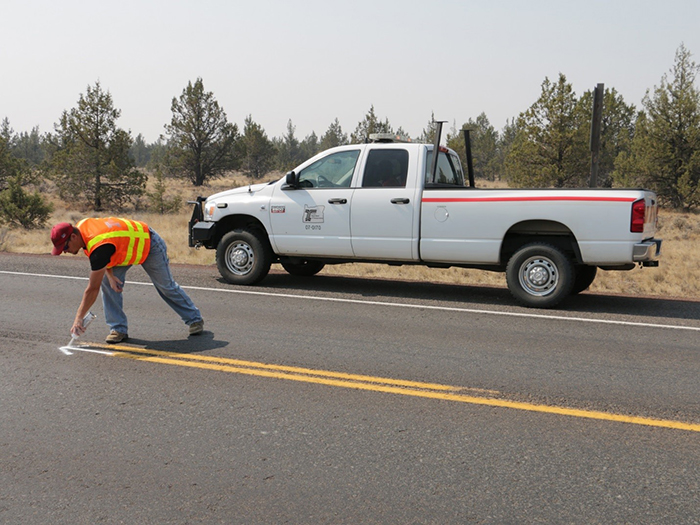
Source: Oregon DOT presentation
Return to top
Appendix
Table 1: Results from the poll
| Who do you work for? |
| Federal Government |
13.3% |
| State Government |
53.3% |
| Private sector |
33.3% |
Have you ever visited the FHWA GIS in
Transportation Website? |
| Yes |
60% |
| No |
40% |
| How did you learn about today’s webinar? |
| GIS State DOT Managers email listserv |
42.8% |
| FHWA GIS in Transportation website posting |
35.7% |
| Other |
21.4% |
How many previous GIS in Transportation
webinars have you participated in? |
| 0 |
53.3% |
| 1-3 |
33.3% |
| 4-6 |
13.3% |

