Webinar 44
Using GIS for Data Dashboards: Arkansas Crash Analytics Tool (ACAT)
September 9, 2020
Summary of the Federal Highway Administration’s Quarterly Webinar
Background
The Federal Highway Administration (FHWA) promotes geographic information systems (GIS) as a means to more effectively manage and improve transportation systems. One of the ways that FHWA does this is through its GIS in Transportation program,1 which identifies timely and critical GIS issues and topics in transportation and connects transportation agencies with available resources and best practices. The webinar summarized here is part of a quarterly series organized through the GIS in Transportation program.
Ted English (Ted.English@ARDOT.gov), Taunya Kidd (Taunya.Kidd@ARDOT.gov), Jeremy Plummer (Jeremy.Plummer@ARDOT.gov), and Josh Sumers (Joshua.Sumers@ARDOT.gov) of the Arkansas Department of Transportation (ARDOT) presented on lessons learned from the development and implementation of the Arkansas Crash Analytics Tool (ACAT).
A recording of the webinar is available here.
Support of the Strategic Highway Safety Plan
The Arkansas Crash Analytics Tool (ACAT) directly supports the strategies and goals outlined in the Arkansas Strategic Highway Safety Plan (SHSP). Data Collection and Analysis is a Primary Emphasis Area in Arkansas’ SHSP. ACAT helps improve the timeliness, accuracy, availability, and integration of data sets to promote roadway safety at the State and local levels. In addition to addressing one of the Primary Emphasis Areas in the SHSP, ACAT also support the “Four E’s” (Education, Engineering, Enforcement, and Emergency Services) through the development of informational maps and dashboards.
Types of Dashboards
ACAT has many types of dashboards, which a user can build (using ArcGIS Dashboards) and make accessible to all levels within ARDOT as well as with the public. There are strategic dashboards, which help executives track key performance indicators (KPIs) and make strategic decisions by evaluating performance based on the ARDOT’s goals. There are also tactical dashboards, which help analysts and line-of-business managers analyze historical data and visualize trends to gain a deeper understanding. Additionally, there are operational dashboards, which help operations staff understand events, projects, or assets by monitoring their status in real time. Finally, there are informational dashboards, which help the Department inform and engage their audience through community outreach.
ARDOT commonly uses ACAT for two dashboards, which are the Fatal & Suspected Serious Injury Crashes Dashboard and the Roadway Departure Crashes Dashboard. The dashboards can be seen in Figures 1 and 2.
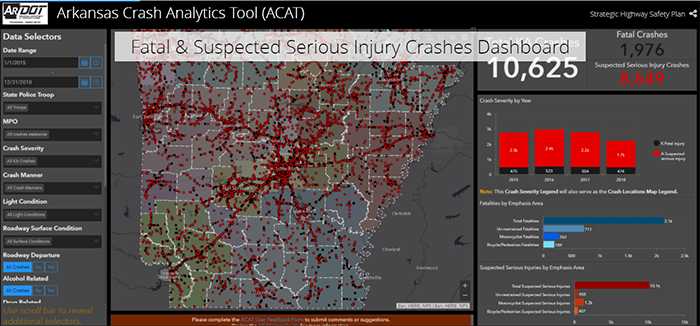
Figure 1. Fatal & Suspected Serious Injury Crashes Dashboard
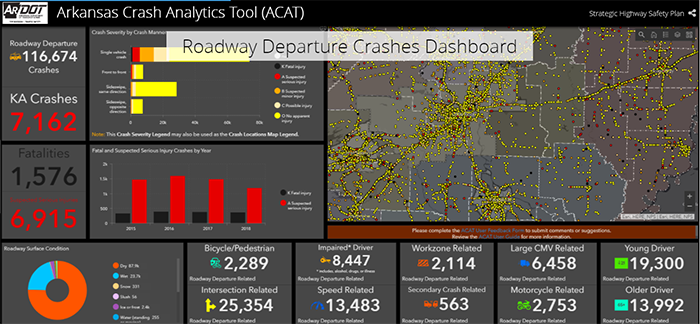
Figure 2. Roadway Departure Crashes Dashboard
Data Collection and Management
ACAT facilitates data sharing across agencies and allows basic analysis for identifying crash locations, problem areas, and trends. This functionality provides for more efficient, deliberate, and informed decision making to address safety areas of emphasis in Arkansas. ACAT currently includes crash data for the state of Arkansas from 2015-2018. With the addition of the 2019 crash data, the tool will have a cap of five years’ worth of data.
ARDOT uses the State’s eCrash database as the primary crash data source for ACAT. This database leverages the Arkansas State Police eCrash system, which the majority of agencies across the state use. ARDOT has a memorandum of understanding (MOU) with Arkansas State Police to share the crash data. The ARDOT Traffic Safety Section “cleans” the data to create the ARDOT crashes database. The base maps within ACAT use boundary layers provided by the Arkansas GIS Office as well as All Road Network of Linear Referenced Data (ARNOLD). The ARDOT GIS Section and FHWA Arkansas Division develop the road system inventory layers. The ARDOT crashes database and tables, along with ARNOLD and road system inventory, go through several processes to create a manageable dataset, which is published as a feature service.
This tool allows users to drill down and answer specific questions without the need for complicated database queries. It is intentionally streamlined and curated to assist researchers with quick answers to unique questions related to the SHSP Emphasis Areas. Current capabilities allow the user to filter crashes geographically based on Districts, Counties, Cities, and Metropolitan Planning Organizations (MPOs). The user may also select a specific “Road ID,” which narrows the field to a specific county, route, and section.
Publish Services, Maps, and Applications
Once the model within ACAT creates the Feature Service, it is published to ArcGIS Online (AGOL) as a hosted feature layer. Then ARDOT creates a map using the hosted feature layer boundary layers and road system layers. The maps are then used to create various applications or dashboards. These applications and dashboards are nested together in a classic tabbed story map for use throughout the Department and with the public.
Arkansas Crash Analytics Tool Demonstration
ARDOT provided a demonstration of ACAT at the conclusion of their presentation.
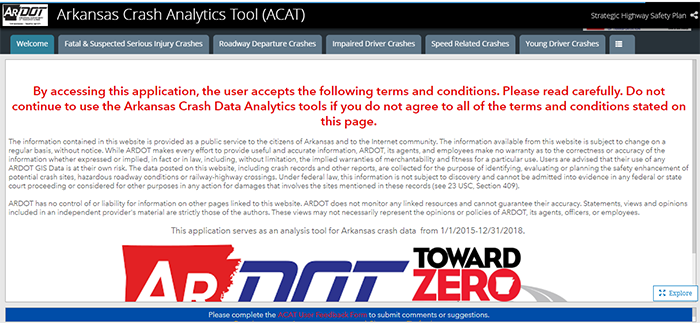
Figure 3. Arkansas Crash Analytics Tool Welcome Page
Questions & Answers
Who are the primary users?
Primary users are other Divisions at ARDOT, Arkansas State Police, and the MPOs. It is available to the public also.
How can users query the data?
The data can be queried by county, MPO Regions, cities, etc.
Can locals use this for highway safety grant applications?
Yes.
Do you have an asset inventory that you can use to find crashes associated with an asset? For example, crashes and high-tension barrier?
ARDOT does have an asset inventory; however, it is currently not included in the dashboard. ARDOT plans to incorporate that dataset into the dashboard eventually.
How are the crashes geocoded? Are GPS coordinates a required field?
Crashes are geocoded based on route ID and logmile. ARDOT calculates GPS coordinates based off those.
If a user enables two features to show on the map—for example, fatal crash and drunk driving crash—if a few crash records overlap—will they be counted once or multiple times?
ACAT only counts each crash record once. There is only one feature class in the dashboards and the side bar just filters that one dataset.
Can the user download any of the data?
The data cannot be downloaded as of now.
Was this dashboard a template or was it developed from scratch?
This dashboard was developed from scratch by ARDOT.
Can you export or print a map?
Not at the moment. ARDOT is looking into a solution for that.
Does ARDOT have plans to collect and map data as it happens?
ARDOT does not have plans to do that currently.
Is there a help page that describes how to use the application?
ARDOT has a user guide, which is configured as a story map.
Return to top