FALL 2016
A Newsletter from the Federal Highway Administration (FHWA)
www.gis.fhwa.dot.gov
Ohio Valley Regional Development Commission’s Open Map Portal Initiative
Since 2013, the Ohio Valley Regional Development Commission (OVRDC), a public regional planning commission that serves as a regional economic and community development agency for 12 southern Ohio counties, has continued to incorporate GIS technologies and practices into its transportation planning process. The FHWA GIS in Transportation Program interviewed two of the planning commission’s Planning Specialists, Nick Kroncke and Malcolm Meyer, on one of their GIS initiatives; the Open Map Portal.

Upcoming Events
- 96th Annual Transportation Research Board Meeting
January 8-12, 2017
Washington, DC
- 2017 AASHTO GIS for Transportation Symposium
April 10-13, 2017
Phoenix, AZ
What is the OVRDC Open Map Portal? Does OVRDC use the portal as part of the ongoing transportation planning process in the region?
OVRDC developed the map portal to highlight a wide range of transportation data in the region. The scope of our Regional Transportation Planning Organization (RTPO) projects include bike and pedestrian infrastructure, freight movement, public transit, and safety. On the map portal, we currently host data related to bridges, pavement condition, crashes, freight growth, bike routes, public transit, statewide transportation improvements, and ports.
This portal is integrated and referenced as part of the ongoing planning process, and we plan to place emphasis on the utilization of the map portal for our next scope of work. An interactive, accessible and up-to-date portal is an important tool that everyone involved with our regional transportation planning can utilize. It can be used for a quick reference to see the number of deficient bridges in a county, or utilized to track daily train activity to name a few examples.
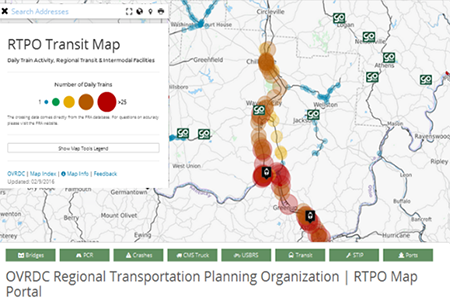
Figure 1: screen capture of the OVRDC Open Map Portal
A main focus of the portal is to use open source software to access as much data in the public domain as possible. Using open source data allows for endless customization, the integration of a multitude of community-built plugins, and opens up the platform to any organization wanting to build upon our work. Producing clean and professional looking maps gives our portal a distinct look and feel.
What motivated OVRDC to develop and adopt an Open Map Portal? Did the portal replace another way of addressing local transportation needs?
In 2013, the Ohio DOT designated OVRDC and four other regions as RTPOs. The goal behind this effort was to provide rural regions with a voice at the state level in regards to regional transportation planning. By 2015, OVRDC developed a comprehensive long-range transportation plan in order to assist in prioritizing transportation projects with the greatest economic, social, and regional benefits for OVRDC and ODOT.
At OVRDC, we have also taken on the role of a data repository for transportation data, which we make readily available to the public. Directing stakeholders to this one portal is also convenient and intuitive. By doing so, we save time by consolidating data from a variety of sources into one location.
The map portal is the first time OVRDC has developed a robust, interactive web-based portal and it continues to undergo changes as our RTPO role evolves. Since OVRDC is a relatively new “kid on the block” to transportation planning, we are still assessing the best way to address our local transportation needs and working with our stakeholders to see how this portal can facilitate their needs as well.
Who is (are) the target audience(s) for this application? Who currently uses this platform (e.g. county/local officials, local residents, planning professionals, etc.)? How do users utilize the online GIS-based portal to meet transportation needs (e.g. reporting, data gathering, etc.)?
The RTPO portal and data pages are targeted towards transportation and planning stakeholders in the Ohio Valley Region. This includes all of our county engineers, transportation planning professionals, in-house program staff as well as the general public. The portal is designed to be accessible enough for the public to use yet versatile and full of enough information for engineers looking at projects in their county. Currently, OVRDC does not utilize the map portal for reporting, but sees this as a great goal for the future.
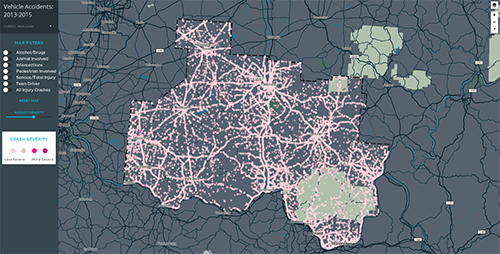
Figure 2: screen capture of the OVRDC Open Map Portal
What are a few challenges OVRDC faced when adopting the online portal, and how were they addressed?
Understanding and navigating the wide variety of web mapping services, APIs, frameworks, etc., is one of the biggest hurdles to overcome for our small organization in taking on this online mapping effort. An example of this is creating mobile friendly web-maps and applications. Keeping the map interactive, the drop-down menus and legends intact, all while conveying the information at the correct scale is a challenge. Creating map-templates and limiting sizing options helps ensure all maps are mobile friendly.
Rather than hiring outside consultants, we trained our GIS staff at OVRDC in web development, in order to successfully create and maintain the map portal. This process, going from GIS Technician to Web Developer, is ongoing. The majority of our “training” has been on-the-job via web tutorials and other online materials.
Another important aspect of any publication effort, whether print or online, is how to best present data so it is accessible to the largest section of the population. We are still looking for ways to gather feedback from the portal and how it is used. We most recently added a feedback link on all of our published web-maps. This feedback will be used to continually upgrade and tweak the maps so that they are even more accessible with features and data that stakeholders find useful.
What are the next steps for the online portal, in the short term? What goals do you have in mind for the long-term development of the platform?
OVRDC staff are continuing to test new web mapping platforms and want to make the portal as robust as possible. Adding more graphics and charts will help visualize the data. Providing links for viewing or downloading the raw data is a definite next step. We are working to standardize the map template so data input becomes the main task, which is unlike the process of customizing every map and releasing different versions. As our RTPO program gets more project focused in the coming years, we hope to host dynamic maps that update with project status and show the great work that is being done in our region. An example of this is hosting roadway improvement and construction projects, which would be helpful for our county engineers in terms of planning. Getting their feedback on what this looks like will be critical.
We invite you to check out our RTPO page and Map Portal, and feel free to offer any feedback you may have.
RTPO Page: https://www.ovrdc.org/rtpo
Map Portal: https://www.ovrdc.org/rtpo/map-portal
Addressing GIS Needs for Public Agencies:
Looking Ahead for the GIS in Transportation Program
Editorial from Michael Green and Mark Sarmiento, FHWA
Since 2007, the Federal Highway Administration (FHWA) has led an effort to highlight noteworthy and innovative uses of GIS in the field of transportation and share knowledge between transportation agencies with and without advanced GIS capabilities. To achieve this goal, each year FHWA organizes and leads peer exchanges, case studies, conference presentations, and quarterly newsletters and webinars on a variety of GIS topics, which are all published online on the GIS in Transportation website (www.gis.fhwa.dot.gov).
By regularly maintaining open communication with specialists across public agencies, and participating in GIS-related events and conferences, the program continues to identify important and timely topics that can directly benefit the transportation community. For example, as the Office of Transportation Performance Management (TPM) finalizes new performance management rules, the GIS in Transportation program has held a peer exchange, published a case study, presented at the GIS for Transportation Symposium (GIS-T), and hosted a webinar with the aim of deepening awareness of how geospatial and GIS tools can support performance management, and how specific States approach TPM through geospatial tools.
The GIS in Transportation program is currently evaluating how it can better serve the needs of GIS organizations within State DOTs and MPOs. Our team has identified some ways in which information and resources can be shared better. A sampling of some of the approaches in development include:
- Partnering with specific GIS and geospatial user groups to highlight learnings from their discussions and activities.
- Updating the database for contact information for GIS experts at FHWA and in the field. The goal is to have each contact include information on agency, types of GIS projects and applications the agency has undertaken, and a means to keep the information up to date.
- And last, improving how each of these services and products are presented through the GIS in Transportation website via a more user-friendly, updated layout. Make sure to visit the site as we continue develop each approach!
One of the most important goals of the GIS in Transportation program is to reflect the suggestions and needs of public agencies and their GIS work. If you have any comments, suggestions, or questions regarding the program or where it is headed, please feel free to reach out to Mark Sarmiento, the program coordinator at Mark.Sarmiento@dot.gov, or Michael Green at Michael.Green@dot.gov.
Other News
GIS Capability Maturity Model (CMM)
Peer Exchange Summary
Six state DOTs convened in Nashville, Tennessee to discuss the CMM as defined by the Urban and Regional Information Systems Association (URISA). During the peer exchange, examples such as “selling” GIS to upper management, GIS staff organization, and data governance policies were presented. A summary of the peer exchange will be available at: www.gis.fhwa.dot.gov/reports.aspx
District DOT (DDOT) and Maryland DOT (MDOT) State Highway Administration (SHA) – All Road Network of Linear Referenced Data (ARNOLD) Initiative
Upcoming Webinar Summary
DDOT and MDOT SHA have been collaborating to develop an application that efficiently develops a continuous centerline across boundaries. This webinar presentation, led by both agencies, describes how external agencies can download GIS data throughout a region and, using the application, can avoid having to manually snap one jurisdiction’s boundary centerlines to another. This data can then be easily ingested into routing applications such as CAD, E911, and NG911.
This webinar summary and recording will be available at: www.gis.fhwa.dot.gov/webinars.aspx.
GIS and the All Road Network of Linear Referenced Data (ARNOLD) Initiative
Upcoming Peer Exchange Summary
This spring, FHWA held a peer exchange on how transportation agencies are adapting to ARNOLD, including the challenges and lessons learned from doing so. Seven state DOTs met in Kansas City in June to discuss their experience with the ARNOLD initiative and lessons learned.
A peer exchange summary report will be released this winter at: www.gis.fhwa.dot.gov/reports.aspx.
Uses of Geospatial Applications for Transportation Performance Management (TPM)
Webinar Summary and Case Studies Report Now Available
FHWA and Volpe explored how State DOTs are developing programs around TPM, particularly as they prepare for requirements introduced by the Moving Ahead for Progress in the 21st Century (MAP-21) legislation. In addition to a case studies report focused on four State DOTs and their experiences with TPM, FHWA summarized the findings and further discussed the challenges and lessons learned from the case study process.
The case studies report is available here.
The webinar summary and recording are available here.
Conducting a Capability Maturity Model for GIS Within Your Agency
Upcoming Case Study Report
Conducting a Capability Maturity Model (CMM) is a great way to assess your agency’s proficiency at using GIS for transportation. FHWA is developing a case study on states that have conducted a CMM. The report will be released this spring and available at www.gis.fhwa.dot.gov/reports.aspx.
For more information about this newsletter, please contact Mark Sarmiento, FHWA Office of Planning, at Mark.Sarmiento@dot.gov.

