SUMMER 2013
A Newsletter from the Federal Highway Administration (FHWA)
www.gis.fhwa.dot.gov
Iowa Department of Transportation's Tablet Asset Data Collection
This edition's Q&A is written by Shawn Blaesing-Thompson, GISP of the Iowa Department of Transportation (IA DOT). She discusses IA DOT maintenance and construction staff's ongoing transition to the use of tablet computers to improve asset data collection and management, and the related initiatives this effort has inspired.
Upcoming Events
- American Society for Photogrammetry and Remote Sensing (ASPRS) Annual Conference
October 27-30, 2013
San Antonio, TX
- National States Geographic Information Council's Annual Conference
October 27-31, 2013
Kansas City, MO
- URISA: Locating the Future
November 3-6, 2013
St. Louis, MO
What maintenance and construction data management needs existed at IA DOT, and how did you chose to address these needs?
IA DOT has 109 field garages across the state where IA DOT maintenance and construction staff work. Historically, IA DOT personnel in the field have collected culvert inventory and inspection data in a variety of ways. Staff have used paper forms, excel spreadsheets, and access databases. These approaches were implemented with no centralized database, creating redundant data entry points.
Approximately two years ago, maintenance and construction field staff approached the IA DOT Office of Maintenance and requested a better way to collect and manage their data and inspection information. After evaluating handheld mapping-grade Global Positioning Systems (GPS), laptops with GPS antennae, smart phones, and tablet computers, the office chose to purchase tablets to allow field staff to record and contribute to an enterprise-based inventory of IA DOT's assets. Tablets were selected because they have built-in cameras and GPS, and can be customized with touch screen applications that reduce the need to type, which is slower and more error-prone.
The Office of Maintenance spent six months testing two dozen different tablets and a variety of operating systems, including iOS, Windows 7, and Android. The office found several tablets that were lightweight, ruggedized, and equipped with high-resolution, anti-glare screens for outside use. IA DOT narrowed the options to four final tablets for testing: the Panasonic Toughpad A1, ASUS Infinity Transformer TF700T, and the IPad Generation 2 and 4. Ultimately, IA DOT management chose the iPad 4, and the IA DOT purchased 120 units, which will be deployed this month (October 2013).
In what ways will field staff use these tablets, and how will they improve asset management for IA DOT?
Field staff will initially use the tablets to collect information on small scale culverts and possibly guardrails in fall 2013. For example, staff will collect information on culvert pipe and apron material, pipe length and diameter, joint separation, apron condition, debris, and other condition information. The tablets will also be used for road condition reporting during winter weather events. IA DOT will also be piloting the use of tablets to develop paperless redline, as-built plans using PDF files. The tablets will eventually be used to collect a wide range of roadway feature data for inventory and inspection.
Staff will now be able to use the GPS in the tablets to accurately locate the required features within three to nine meters of their actual location, and then render them against IA DOT's road network and linear referencing system. Since field staff will be collecting the condition data of these features, IA DOT will be able to use that information to more efficiently allocate resources to the field for repairs. By analyzing this information spatially, IA DOT will be able to make better decisions about programming future enhancements and work along the road network.
Overall, field staff will contribute to a centralized geospatial database that users statewide will access. For example, staff in the IA DOT Office of Design who use computer-aided design (CAD) have expressed interest in using the data to understand the failure rate of different style culverts in order to inform design specifications for future construction.
How will IA DOT manage the data collected using the tablets?
IA DOT has been using a prototype application called the “Mobile Asset Verification and Road Inventory Collection (MAVRIC™)” by Transcend Spatial Solutions to organize the data collected. The Department intends to build a production application starting this fall. To date, field personnel have used the application to understand how to collect data for multiple assets while being able to see the information in a straight line diagram. (See Figure 1.)
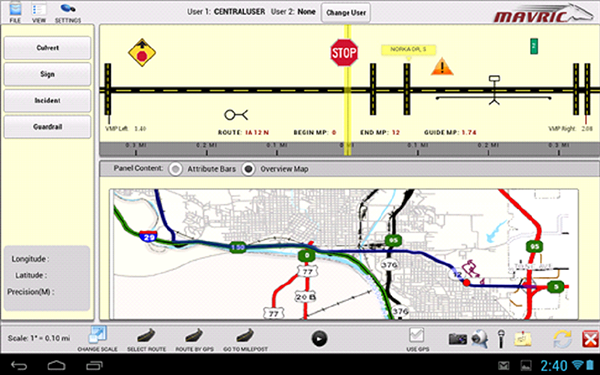 Figure 1. MAVRIC interface showing signs, culverts and guardrail features along the road network.
The web portion of the prototype, Road Analyzer, allows for basic reporting by managers in an office environment. The final application will have a web reporting component, a dashboard allowing users to render data in different ways, and a close to live stream of data available in a web portal through ArcGIS Webservices.
What were the critical success factors to implementing the use of tablet computers and new data management system?
The Office of Maintenance was able to gain support for this effort by being persistent and including all levels of management in the project from the beginning. Additionally, the office worked hard to ensure the relevance of the project was communicated to all levels of the agency from upper management, office staff, and field staff. Support from maintenance field staff and several levels of management helped to convince central office management. This effort also supports the goals of the current DOT director, who is emphasizing innovation and process change.
Has this initiative led to other related efforts, and, if so, how are these efforts contributing to IA DOT's asset management improvements?
The Office of Maintenance discovered that in some cases, maintenance staff members are not the first office in the transportation lifecycle to collect feature location data. By leveraging location data recorded by other offices, maintenance staff can focus on assessing and maintaining asset condition. For example, CAD files, which are developed using survey grade information, provide a useful first view at where features occur along the road network. In addition to locating existing structures, Office of Design staff record the locations of future structures and gather tabular information about these features. For example, during culvert design, they survey existing culverts, draw in new alignments or additions to those culverts, and update a Microsoft Access database of culvert design data, capturing size, location, material type, and length, etc.
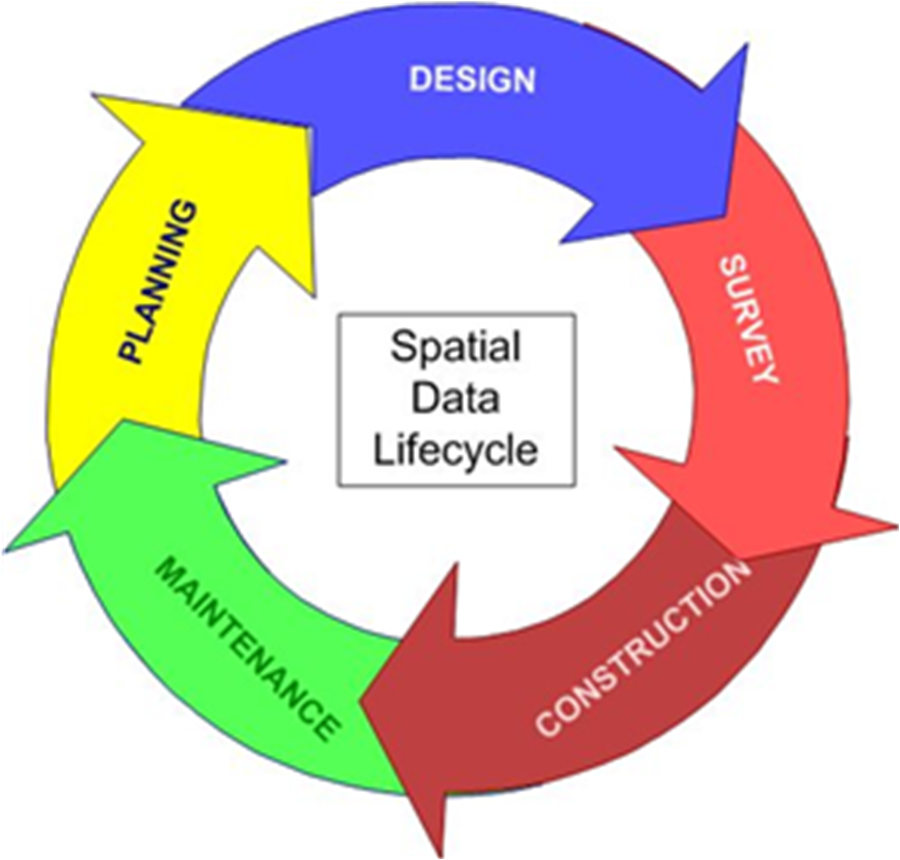 Figure 2. Lifecycle of spatial data in transportation.
An IA DOT technical group is now working to identify existing workflows that could be modified to include the compilation of survey grade spatial information from CAD files into a centralized spatial database which will include asset data collected using the tablets. A pilot is underway to examine options for assigning some of the tabular information relevant throughout a feature's lifecycle to the same feature in the CAD design file.
A second group was established to look at the as-built part of the construction process. Currently, IA DOT's Resident Construction Engineers (RCEs) who oversee construction projects use a Portable Document File (PDF) version of the CAD plan sheets to record any as-built changes that occur during the construction process. IA DOT currently has two other pilots underway to look at the feasibility of conducting surveys both during and after construction to gather a spatial, digital as-built data set for specific features. A Phase III pilot will develop a bid item for a digital as-built derived from the IA DOT CAD plan sheets and supplemented with information gathered through survey. This information will also be fed into enterprise asset management databases.
The key to all of these efforts is IA DOT's Linear Referencing System (LRS) infrastructure. A robust LRS allows data collected from various stages in the data lifecycle to be synthesized, analyzed, and used quickly and easily.
IA DOT views Asset Management as a strategic priority. These efforts led by the Office of Maintenance are supporting improved asset management practices by helping IA DOT know what assets they have and their condition. The data and the analysis it supports are critical to IA DOT's overall success in managing highway assets.
For more information, please contact:
Shawn Blaesing-Thompson, GISP
Shawn.Blaesing-Thompson@dot.iowa.gov
Phone: 515-239-1805
GIS Supports Road Roughness Research
Editorial from Michelle Barnes, BSCE, MS-GIS, and Steve Karamihas, MSME, Engineering Systems Group (ESG), University of Michigan Transportation Research Institute
GIS analytical tools and spatial data are poised to play an increasingly important role in the pavement-monitoring community's efforts to capture and spatially locate pavement roughness measurements relative to other physical features of low-speed urban roads.
State DOTs have equipment and well established techniques for measuring pavement roughness at highway speeds using automated road profilers that use laser surface detection devices. Currently AASHTO R 43-07 and ASTM Standard E 950 are the guidance documents for longitudinal profile collection. These measurements support asset management by helping track pavement deterioration and ride quality as the result of such factors as road loads, climate, and pavement mix design on higher speeds roads and/or roads where a constant speed can be maintained.
However, these measuring techniques are not designed for low-speed urban roads, and do not capture a variety of inputs that contribute to overall roughness. Many physical attributes of low-speed urban roads are not part of roadway design, but are “built-in,” such as manhole covers at utility access locations.
So how does the pavement community establish roughness measurement techniques for the low-speed urban portion of the road network? A recently funded National Cooperative Highway Research Program project (10-93): Measuring, Characterizing and Reporting Pavement Roughness of Low-Speed and Urban Roads (LeBlanc, Karamihas) is underway to address this question. In particular, GIS data and analysis will play a key role in this research by spatially locate as many built-in road features as possible. Data on these built-in features will be combined with newly captured profile data and other analyses to develop a low-speed urban road roughness index. The index will assist road designers and road maintenance staff in assessing the effects and costs to drivers of these built-in features. In addition to the index, the project will produce training materials and examples to recognize built-in features and demonstrate fusing profile data with these features. By including these built-in features as part of the roughness data capture, the project fuses impacts from the road surface itself with features “not of the road” to establish the new index.
Employing GIS geospatial data and analysis techniques will enable researchers to tease out the impact that built-in features have on low-speed urban road roughness.
The report summary is available at: https://apps.trb.org/cmsfeed/TRBNetProjectDisplay.asp?ProjectID=3404.
For more information, please contact:
Michelle Barnes, BSCE, MPA, MSGIS
mbarnes@umich.edu
Phone: 734-647-5492
Steve Karamihas, MSME
stevemk@umich.edu
Phone: 734-936-1057
Other News
Reports
The FHWA sponsors peer exchanges, in which GIS practitioners gather to share and learn about existing effective practices, methodologies, and lessons learned concerning the use of GIS to support transportation decision-making. This spring, FHWA held two peer exchanges on the following topics:
- Applications for the Interoperability of CAD (Computer-Aided Design) and Geographic Information Systems (GIS)
- Uses of Cloud Technologies for Geospatial Applications
Case study reports based on the peer exchange discussions, as well as case study interviews conducted with each participating organization, will be released this fall. These reports will be available at www.gis.fhwa.dot.gov/reports.aspx.
Webinars
FHWA sponsors a quarterly GIS webinar series that provides information about current GIS efforts, applications, and initiatives. Planners from State Departments of Transportation (DOTs), Metropolitan Planning Organizations (MPOs), and others are particularly encouraged to attend. To view previous webinars, please see www.gis.fhwa.dot.gov/webinars.aspx.
For more information about this newsletter, please contact Mark Sarmiento, FHWA Office of Planning, at Mark.Sarmiento@dot.gov.