Summer 2017
A Newsletter from the Federal Highway Administration (FHWA)
www.gis.fhwa.dot.gov
Geospatial Data and Tools for Assessing Current & Future Flood Risk
in Florida
Article by Crystal Goodison, Associate Director and Associate Scholar at the GeoPlan Center of University of Florida
Upcoming Events
- Capability Maturity Model Peer Exchange: Following up on last year's successful peer exchange, Ohio DOT will host a CMM Peer Exchange on September 19th and 20th of this year.
- The National States Geographic Information Council (NSGIC) will host its Annual Conference from Monday, September 25th to Friday, September 29th in Providence, Rhode Island. For more information, please visit the NSGIC website.
The University of Florida (UF) GeoPlan Center recently completed a third phase of work with the Florida Department of Transportation (FDOT) to develop geospatial tools and data for assessing the vulnerability of transportation infrastructure to current and future flood risks. The tools visualize statewide transportation assets exposed to current flood risks and future sea level rise (SLR) scenarios to inform planners and highlight infrastructure for potential avoidance or mitigation. This article details the phases of work completed by UF from 2012-2017.
Background
Sea levels in Florida have risen approximately 8 inches over the past century and the rate of SLR has nearly doubled over the past few decades (IPCC, 2013, Mitchum, 2011). Florida has been called “ground-zero” for SLR because of its low-lying property and population. Over 14 million Florida residents (approximately 75% of the State’s population) live in coastal counties (Wilson & Fischetti, 2010). Almost 490,000 people live on property that is less than 3 feet above the high tide line and over 2.6 million people live on property less than 6 feet above the high tide line (Strauss et al., 2014).
Florida’s low elevations and extensive coastline leave the State’s communities, people, and infrastructure vulnerable to multiple flood risks, including storm surge from hurricanes and tropical storms, heavy precipitation events, and SLR. Because Florida’s economy is dependent on the transportation system’s ability to move people and freight, considering the effects of SLR is critical to protecting infrastructure investments and the State’s economic stability. While permanent inundation of assets due to SLR could be decades away, the time is now to develop data and tools to inform the planning process.
Project Goals and Phase 1
In 2012, the UF GeoPlan Center began its first phase of work with FDOT on developing SLR data and tools. The two main goals of the research were: (1) to map regional and statewide projections of SLR using the U.S. Army Corps of Engineers (USACE) methodology and (2) to develop a GIS tool for visualization of transportation facilities vulnerable to flooding from SLR. These goals were based on recommendations from a 2012 Florida Atlantic University report produced for FDOT that analyzed methods and data sources used to project SLR. This first phase of UF work culminated in the development of the Sea Level Scenario (SLS) Sketch Planning Tool, a GIS tool to assess SLR impacts to transportation infrastructure (research project BDK75 977-63).
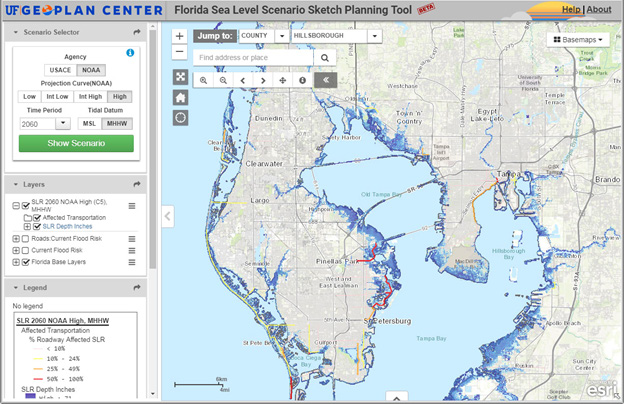
Figure 1. FDOT Sea Level Sketch Planning Tool
Because inundation from SLR varies based on the projected rate of SLR, geographic location, local tidal conditions, and time frame, over 100 SLR scenarios were developed for the state. SLR scenarios were mapped by FDOT district using three projected rates of SLR (low, intermediate, and high), seven decades (2040-2100), and five tidal datums from 14 tide stations. GIS data layers representing each SLR scenario were intersected against statewide transportation GIS databases to identify facilities potentially affected under each scenario. The analyzed data was made available for public download and display via an online map viewer.
Phase 2
In Phase 2, the UF GeoPlan Center and FDOT worked with two Metropolitan Regional Planning Organizations (MPOs) to pilot the SLS Sketch Planning Tool’s usefulness for regional scale planning. Hillsborough MPO and Broward MPO (representing Broward, Palm Beach, Miami-Dade and Monroe counties) were awardees of the Federal Highway Administration’s Climate Change Resilience Pilot Program, which funded partners to assess infrastructure vulnerability to the impacts of SLR and extreme weather events, determine adaptation options, and improve resiliency of infrastructure. Feedback from the pilots included: the availability of multiple, ready-to-use SLR scenarios in GIS format, simple online visualization of SLR scenarios, and good data resolution for regional planning. Suggestions for improvement included: adding more GIS data layers (including current floodplains, storm surge data, bridge elevations); a more user-friendly map viewer interface; and the inclusion of SLR projections from the National Oceanic and Atmospheric Administration (NOAA). This feedback was used to make improvements to the data and tools in the next phase of work.
Phase 3
In Phase 3, updates were made to the SLS Sketch Planning Tool based on recommendations from Phase 2 and incorporation of the latest available data and science. One goal in this phase was to take a more comprehensive approach towards transportation resiliency by assessing both current flood risks (current floodplain areas and storm surge zones) and future flood risks (SLR scenarios) along facilities. Analysis of the data developed in Phase 1 showed areas not impacted by direct inundation from SLR. However, SLR is a known flood-risk multiplier that is and will continue to exacerbate existing coastal flooding events. In this context, current flood risk areas can be used as an indicator of future flood risk areas.
Major updates completed in Phase 3 included: (1) re-map of SLR inundation layers using updated input data (local SLR trends, SLR projections from NOAA and USACE, updated Light Detection and Ranging (LiDAR) elevation data, adjusted bridge elevation data); (2) segment-level analysis of infrastructure vulnerability to current flood risks (100-year and 500-year floodplains and hurricane storm surge zones) and future flood risks (SLR scenarios); and (3) development of a new, modernized web map viewer for data visualization.
Challenges and Next Steps
A variety of challenges were faced throughout the three phases of work. Many challenges were data-related, such as compiling the best available elevation data into one seamless statewide DEM mosaic for mapping inundation. Another involved choosing an appropriate cell size for the DEM mosaic—fine enough to capture subtle elevation changes, but not so fine to make data processing time inefficient and storage space unmanageable (a cell size of approximately 5.4 meters was ultimately used). Additional data challenges were getting correct elevation of bridge approaches and bridge decks and correcting inundation models for hydro-connectivity. Non-data challenges included keeping current on the wealth of climate science that is constantly being produced regarding best practices and guidance for projecting SLR, mapping inundation, and assessing vulnerability.
The next phase of work involves technical training for MPOs/TPOs, so the data and tools can be used in long-range planning process. This fall, the UF GeoPlan Center will be traveling around the State offering on-site training. We look forward to sharing our data and tools!
Sea Level Scenario Sketch Planning Tool:
The following publicly accessible tools are available at https://sls.geoplan.ufl.edu:
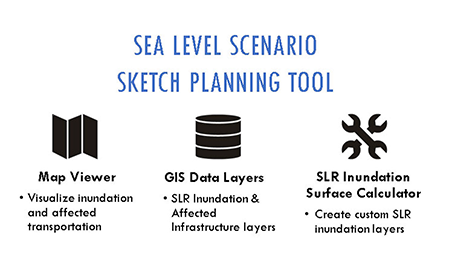
Figure 2. Icons depicting functions of the Sea Level Scenario Sketch Planning Tool
- A map viewer to visualize multiple SLR scenarios and transportation infrastructure exposed to current and future flood risk;
- GIS data layers (inundation models and transportation layers) available for download; and
- ArcGIS calculator tool for creating GIS layers of SLR inundation.
References
- International Panel on Climate Change [IPCC]. (2013). Summary for Policymakers. In: Climate Change 2013: The Physical Science Basis, Contribution of Working Group I to the Fifth Assessment Report of the Intergovernmental Panel on Climate Change [Stocker, T.F., D. Qin, G.-K. Plattner, M. Tignor, S. K. Allen, J. Boschung, A. Nauels, Y. Xia, V. Bex and P.M. Midgley (eds.)]. Cambridge University Press, Cambridge, United Kingdom and New York, NY, USA.
- Mitchum, G. (2011). Sea Level Changes in the Southeastern United States. Florida Climate Institute and Southeast Climate Consortium.
- Strauss, B., Tebaldi, C., Kulp, S., Cutter, S., Emrich, C., Rizza, D., & Yawitz, D. (2014). “Florida and the Surging Sea: A Vulnerability Assessment With Projections for Sea Level Rise and Coastal Flood Risk.” Climate Central Research Report. pp 1-58.
- Wilson, S. & Fischetti, T. (2010). Coastline Population Trends in the United States: 1960 to 2008. U.S. Dept. of Commerce, Economics and Statistics Administration, U.S. Census Bureau. Retrieved from: https://www.census.gov/library/publications/2010/demo/p25-1139.html.
INDOT Damage to State Property
Editorial by Joel Bump, MIS Director at Indiana Department of Transportation
Crash into a guardrail in Indiana and chances are that your insurer—or you—will get a repair bill from the Indiana Department of Transportation. Back in 2012 INDOT deployed a new way of tracking damage to state property at crash scenes and quickly collecting money from those responsible. The state has increased the percentage of money it collects to fix mangled guardrails, toppled light poles, and unraveled median cable barriers, adding as much as $7 million a year to the operating budget.
A bridge beam struck by a semi can cost hundreds of thousands of dollars to fix. But even replacing a small section of guardrail can run $2,500. With an average of 4,000 incidents a year causing damage to state highway infrastructure, even small damage costs add up.
The program is a combination of mobile devices, .NET web app, a data warehouse, GIS, and paper tagging of damaged property. The system includes a kit for police officers that contains tags that can be tied to a damaged fixture. The officer writes the accident number and date of the crash on the tag. INDOT staff can call up the report later to see which motorist was blamed for damage. Without the tags is when the data warehouse and GIS come in. INDOT’s data warehouse pulls in new accidents from the State Police crash records system daily. Queries find potential wrecks along state routes with potential property damage. Crashes are located and crews are dispatched. The mobile app allows the user to see the information about the crash and a map to direct them to the location. Once the site is located, better GPS coordinates are recorded, photos are taken, and an estimate of parts and quantities needed for a repair is entered. Engineers can also be dispatched from the app for complex assessments. The record is then uploaded back to the main system where estimates are built, claims submitted, and invoices are sent to PeopleSoft Financials for payment by the parties at fault.
The result is that INDOT can now bill insurers within days, rather than months. INDOT is also capturing all state damage incidents that are recorded by any law enforcement in the state. With better record keeping, the agency also sees a better rate of payment from the parties responsible.
This program was a result from a study presented to INDOT by the Joint Transportation Research Program at Purdue University, a long-standing collaboration between Purdue and INDOT to improve the State’s highway system. The program received the AASHTO President’s Award and Indiana Geographic Information Council’s Excellence Award in 2012.
https://docs.lib.purdue.edu/jtrp/1475/ - Related Purdue Research Document
Other News
Now Available: Mobile LiDAR - Uses at Oregon DOT Webinar Summary Report
A summary of a recent GIS in Transportation webinar is now available. The 33rd webinar in a quarterly series of Federal Highway Administration (FHWA) webinar was presented by Chris Glantz, Lead Remote Sensing Surveyor with the Geometronics Unit, Oregon Department of Transportation. Mr. Glantz’ presentation provided an explanation of how LiDAR scanning technology provides a smarter, safer, and more efficient means of surveying geospatial information of transportation infrastructure and gave examples of how ODOT has used LiDAR data.
To read this webinar summary and browse other summaries like this one, please visit this page: https://www.gis.fhwa.dot.gov/webinars.aspx
Coming Soon: Case Study Report on Capability Maturity Models (CMMs) for State DOTs
The Federal Highway Administration has written a report, which will soon be published, on the use of CMMs at State DOTs to assess the capability of an agency’s ability to employ GIS. When the report is ready, it will be made available on this page: https://www.gis.fhwa.dot.gov/reports.aspx.
For more information about this newsletter, please contact Mark Sarmiento, FHWA Office of Planning, at Mark.Sarmiento@dot.gov.

