Using GIS for Crash Location and Analysis
at State DOTs
Case Studies of Select Transportation Agencies
April 2023

Prepared for:
Office of Planning
Federal Highway Administration
U.S. Department of Transportation
Acknowedgements
The Federal Highway Administration and the U.S. Department of Transportation Volpe National Transportation Systems Center would like to thank the participating agencies and interviewees that made this case study report possible. The participating agencies are listed below and the particular individuals who took the time to be interviewed for this report are listed in Appendix A: Case Study Participants.
- Alabama Department of Transportation (ALDOT)
- Connecticut Department of Transportation (CTDOT)
- Oregon Department of Transportation (ODOT)
- New York Department of Transportation (NYSDOT)
- North Carolina Department of Transportation (NCDOT)
- Connecticut Department of Transportation (CTDOT)
- University of Alabama (CAPS)
- University of Connecticut (CTSRC)
| REPORT DOCUMENTATION PAGE |
Form Approved
XXX
|
| Public reporting burden for this collection of information is estimated to average 1 hour per response, including the time for reviewing instructions, searching existing data sources, gathering and maintaining the data needed, and completing and reviewing the collection of information. Send comments regarding this burden estimate or any other aspect of this collection of information, including suggestions for reducing this burden, to Washington Headquarters Services, Directorate for Information Operations and Reports, 1215 Richmond Highway, Suite 1204, Arlington, VA 22202-4302, and to the Office of Management and Budget, Paperwork Reduction Project (0704-0188), Washington, DC 20503. |
| 1. AGENCY USE ONLY (Leave blank) |
2. REPORT DATE
July 2021 |
3. REPORT TYPE AND DATES COVERED
Final Report |
4. TITLE AND SUBTITLE
Crowdsourced Data and Safety at State DOTs and Local Partners:
Case Studies of Select Transportation Agencies |
5a. FUNDING NUMBERS
HW2LA500/UF025
|
6. AUTHOR(S)
Eric Englin ORCID 0000-0003-4424-7438
Sarah Davis ORCID 0000-0002-3656-9202
|
5b. CONTRACT NUMBER |
7. PERFORMING ORGANIZATION NAME(S) AND ADDRESS(ES)
U.S. Department of Transportation
John A. Volpe National Transportation Systems Center
55 Broadway
Cambridge, MA 02142-1093
|
8. PERFORMING
DOT-VNTSC-FHWA-21-11
|
9. SPONSORING/MONITORING AGENCY NAME(S) AND ADDRESS(ES)
U.S. Department of Transportation
Federal Highway Administration
1200 New Jersey Avenue, SE
Washington, DC 20590 |
10. SPONSORING/MONITORING AGENCY REPORT NUMBER
|
| 11. SUPPLEMENTARY NOTES |
12a. DISTRIBUTION/AVAILABILITY STATEMENT
This document is available to the public on the FHWA website at https://www.gis.fhwa.dot.gov/.
|
12b. DISTRIBUTION CODE |
13. ABSTRACT (Maximum 200 words)
In supporting State Departments of Transportation (DOTs) and metropolitan planning organizations (MPOs) in using Geographic Information Systems, the Federal Highway Administration (FHWA) is publishing this Case Study Report focusing on the use of crowdsourced data collection methods and how transportation agencies use this data to improve transportation safety. To gather information for this report, the U.S. DOT Volpe National Transportation Systems Center interviewed eight transportation agencies and developed a case study focusing on their experiences. The purpose of this document is for State DOTs and MPOs to consider the notable practices that these agencies used in collecting, analyzing, and utilizing different crowdsourced data types to improve safety. |
14. SUBJECT TERMS
Geographic Information Systems (GIS), safety management, performance management, crowdsourced data |
15. NUMBER OF PAGES
32 |
| 16. PRICE CODE |
17. SECURITY CLASSIFICATION OF REPORT
Unclassified |
18. SECURITY CLASSIFICATION OF THIS PAGE
Unclassified |
19. SECURITY CLASSIFICATION OF ABSTRACT
Unclassified |
20. LIMITATION OF ABSTRACT
Unlimited |
Table of Contents
Return to top
1. Introduction
1.1 Background
Geographic Information Systems (GIS) are an effective and increasingly essential tool at State Departments of Transportation (DOTs). With applications in all aspects of their work, GIS has helped State DOTs make better transportation decisions that are more informed and delivered in a cost-efficient, timely manner. While State DOTs have been using GIS in varying capacities over the last 30 years, new technological advancements and program initiatives have presented these agencies with new challenges. The Federal Highway Administration (FHWA) promotes the better use of GIS among State DOTs to help them address these challenges through the GIS in Transportation Program.
From the 2021 American Association of State Highway and Transportation Officials (AASHTO) GIS for Transportation (GIS-T) State Survey, State DOTs identified “crash location and analysis to improve road safety” as an area they are interested in learning how GIS is applied.
This case study report identifies notable practices from State DOTs across the country, specifically describing:
- How State DOTs and partner agencies collect and store crash data;
- How State DOTs and partner agencies geographically locate crashes;
- What applications are used to analyze crash data, including with a mapping component;
- How analyzing crash data is being utilized in the decision-making process; and
- What challenges State DOTs face and methods for addressing them.
This case study is from the perspective of GIS professionals in state DOTs and is therefore mainly geared toward other GIS professionals regarding how GIS is being used for crash location and analysis.
1.2 Methodology
FHWA used the GIS for Transportation (GIS-T) 2021 Survey, administered by AASHTO, to identify State agencies with interest and experience in crash location and analysis to help improve roadway safety. In this survey, States submitted information about their GIS-related projects and initiatives. The team conducted further research into the list of transportation agencies identified and selected agencies that had significant interest and experience implementing and deploying GIS-based crash location and analysis tools and that are in the process of upgrading their applications. The following agencies were willing and available for interviews:
- Alabama Department of Transportation (ALDOT)
- Oregon Department of Transportation and Department of Revenue (ODOT)
- New York Department of Transportation (NYSDOT)
- North Carolina Department of Transportation (NCDOT)
- Connecticut Department of Transportation (CTDOT)
Representatives from each of the identified transportation agencies generously provided their time for an online interview with the research team. These representatives were the most knowledgeable staff on how their crash location and analysis systems are developed and used within their organizations. The research team developed a standardized interview guide found in Appendix B: Interview Guide, to use for each of the interviews. This allowed the research team to guide each interview consistently among agencies and produce consistent information that can be compared among respondents.
1.3 Crash Data Collection
Road safety is one of the most important responsibilities of Federal, State, and local governments. Collecting and analyzing crash data can aid in the modification and design of roadways, intersections, and traffic enforcement to create a safer transportation network. Since an accurate database is necessary for crash analysis, it is important to collect the relevant data at the scene of a crash in police crash reports. The data collected should include crash location, and vehicle, human, roadway, and environmental factors. Many States use the National Highway Traffic Safety Administration’s (NHTSA) Model Minimum Uniform Crash Criteria Guideline (MMUCC), which identifies a minimum set of crash attributes (over 115) to collect what it determines is necessary for comprehensive crash and safety analysis. An accurate location of the crash is crucial and is often collected with software or address and location observations at the scene of the crash. If needed, it may then be verified and refined using algorithms and manual identification. Other important information for crash location includes a roadway GIS layer including an accurate linear referencing system (LRS) or milepost system.
1.4 Crash Data Analysis
When analyzing crash data using GIS, accurate GIS layers including crash location, roadway network, and intersection locations are essential, as well as a multi-year crash database with detailed attributes. Any crash locations identified with an address rather than a latitude/longitude, are geocoded to include in the crash location layer. A crash analysis application using GIS can visualize the crash and road network data, identify where crashes are concentrated, and link crashes to roadway and other factors. Crash analysis applications often include a mapping component for visualization, a dashboard to query crashes based on crash, roadway, and environmental attributes, and a component to visualize and describe the data in graphs, tables, and reports. The analysis can then be used by transportation and public safety agencies in their decision-making for improvements to the current transportation network safety and for new roadway projects.
Return to Table of Contents
2. Agency and Project Profiles
Through interviews with Alabama DOT, Oregon DOT, New York DOT, North Carolina DOT, and Connecticut DOT, this case study explores the ways in which State DOTs spatially locate crashes and maintain and use their crash data. It identifies the GIS applications and other tools they use for these purposes and looks at how these tools have been updated and replaced over time as new technology and features have become available. Also reviewed is how crash data and analysis is used in decision-making.
The following profiles identify key components of each agency’s approach to crash data collection, accurate crash geo-locating and crash analysis. Basic information on their agency structures, partnerships, workflows, and the challenges they face in updating and creating new applications to help their agency use crash data in roadway safety decision-making is also included.
2.1 Alabama DOT (ALDOT)
The Alabama DOT (ALDOT) has partnered with University of Alabama’s (UA) Center for Advance Public Safety (CAPS) to develop applications and a joint workflow to maintain the State’s crash data and road layer. UA CAPS is an interdisciplinary research center that conducts software research and development focusing on public safety. It has developed two applications that are utilized by the State of Alabama, eCitation and eCrash, as well as several Safety Portals for viewing and analysis. CAPS employs eight to ten people who program, maintain, and utilize the applications. ALDOT’s GIS/LRS Data Management Unit, part of the ALDOT Maintenance Bureau, employs seven people, and is responsible for developing and maintaining LRS roadway functionality and GIS enterprise data. ALDOT also has an internal application called eGIS, which is used for viewing and querying data.
The CAPS eCrash and eCitation applications are used by police officers in the field and were funded by Alabama Law Enforcement. eCitation allows officers in the field to look up driver information such as existing warrants, and it automates creation of citations. eCrash is used on a laptop to input the information regarding a crash and includes the location. eCrash includes automation that attempts to locate the crash on a roadway from details the officer has input. If the crash was not located properly, a student employee will then locate the crash manually by looking at the street name and other location factors noted in the crash report. CAPS also maintains the definitive crash database. The eCitation and eCrash applications have been used since 2008 and were created in-house on the Microsoft.NET platform. CAPS is currently trying to receive approval to update the eCrash application.
For crash analysis, CAPS has developed a traffic safety software called the Critical Analysis Reporting Environment (CARE). CARE was first developed in 1981 as a desktop version. It quickly creates datasets that are easily queried. The new web portals use CARE’s database format and processing engine. Three portals utilize the crash data—a public Safety Portal with five years of data available for querying and a limited number of crash attributes, and a private Safety Portal for law enforcement with many more year of data and attributes available to query. These portals have no mapping capabilities since there is a legal aspect that protects the location data. The third portal, the ADVANCE Portal, was developed in 2009 and is used only by law enforcement personnel. It has a dashboard that allows the user to query several hundred crash attributes and displays the results in charts and graphs (see Figure 1). It can also display and generate a map showing crash hotspots on the road network, includes a hotspot reporting program, and generates other graphs and reports. The CAPS analysis software and portals have been mostly funded by ALDOT.
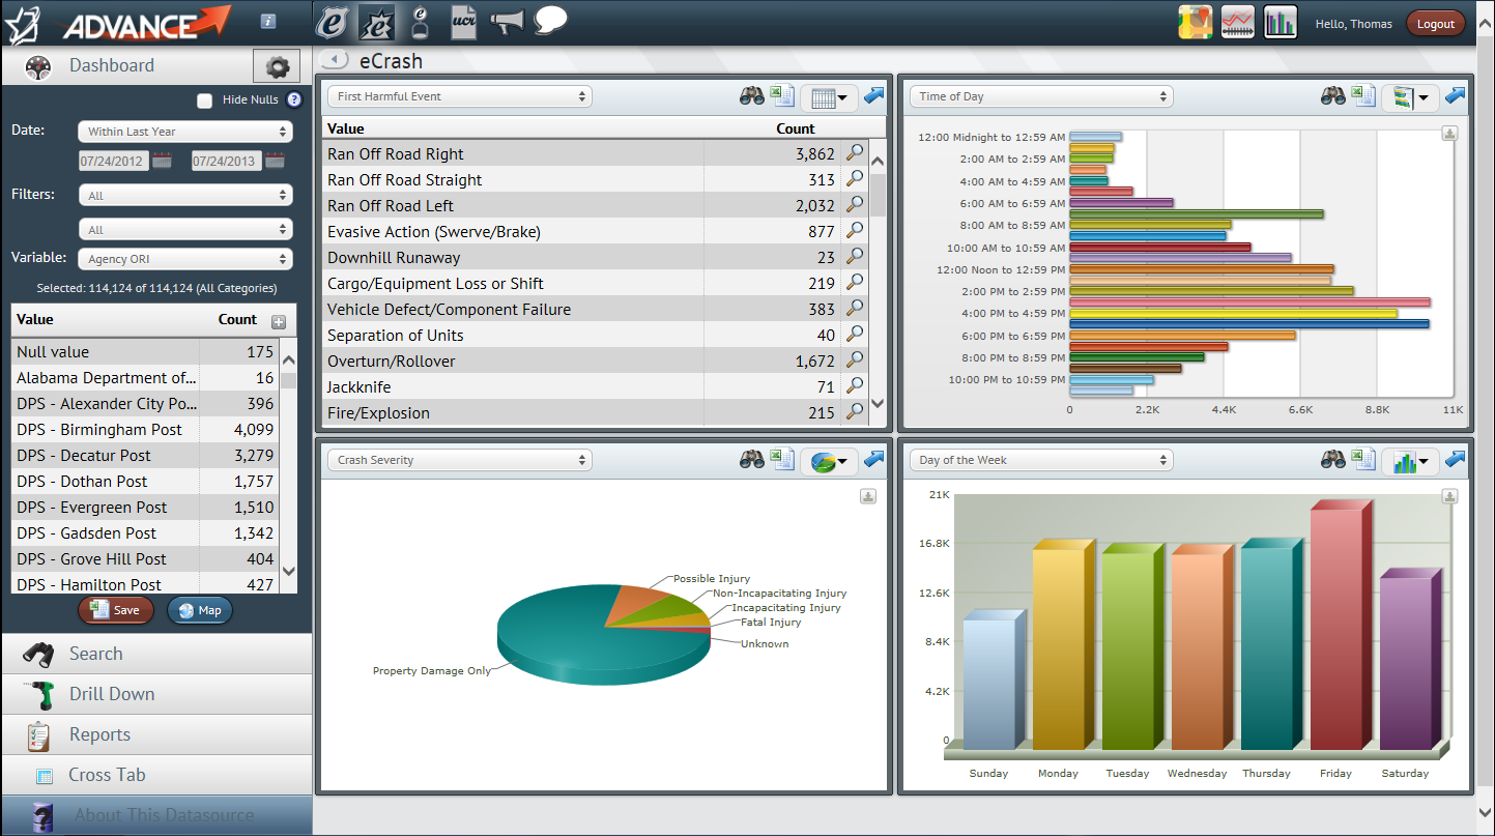
Figure 1. Illustration. CAPS ADVANCE Portal, UA, College of Engineering, Center for Advanced Public Safety.
The crash database is located in two places, at both CAPS, the definitive database, and at ALDOT. ALDOT’s GIS/LRS Data Management Unit developed and maintains the route layer. The crash database and route layer located at ALDOT are updated through a workflow using a python script and a CAPS protected web service (see Figure 2). ALDOT pushes any routes and other relevant data to CAPS nightly and pulls the newest crash data monthly from CAPS. Which crash data to pull is determined by a comparison of the maximum date on ALDOT’s side to what is on CAPS’ side. Crash records that are greater than the maximum ALDOT date are pulled and then run through a manual process to make sure the table structures are the same. Once the data is checked it is appended to the crash feature layer, which is used in various systems at ALDOT.
ALDOT/UA Route and Crash Location Process
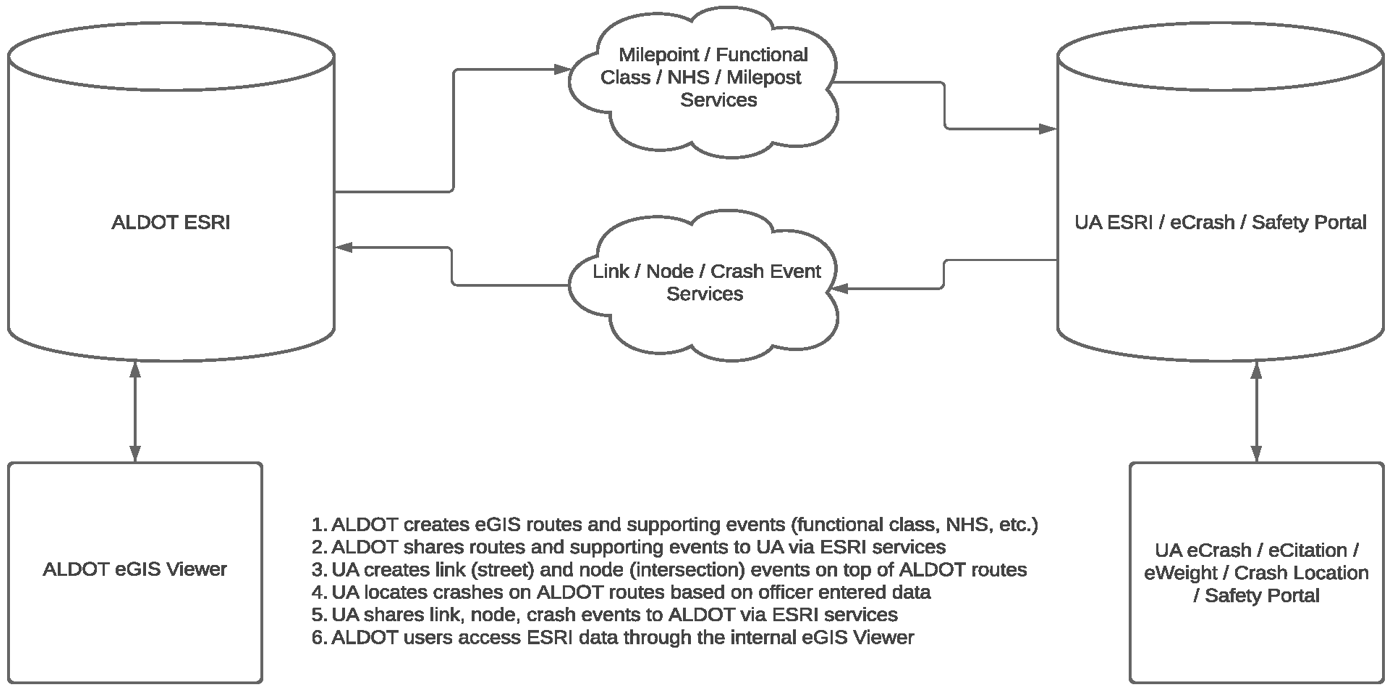
Figure 2. Illustration. Route and crash Location process – ALDOT/University of Alabama.
Long description
ALDOT’s data viewer, eGIS, is relatively new, being in use for the past three years. It was developed by an outside engineering contractor, PMG. eGIS is ALDOT’s interface for searching data from many internal and external systems and displaying the results to the user (see Figure 3). All the department’s enterprise data is accessible through eGIS and is used internally by ALDOT personnel. ALDOT has a Crash feature layer that is available to query and display in eGIS.
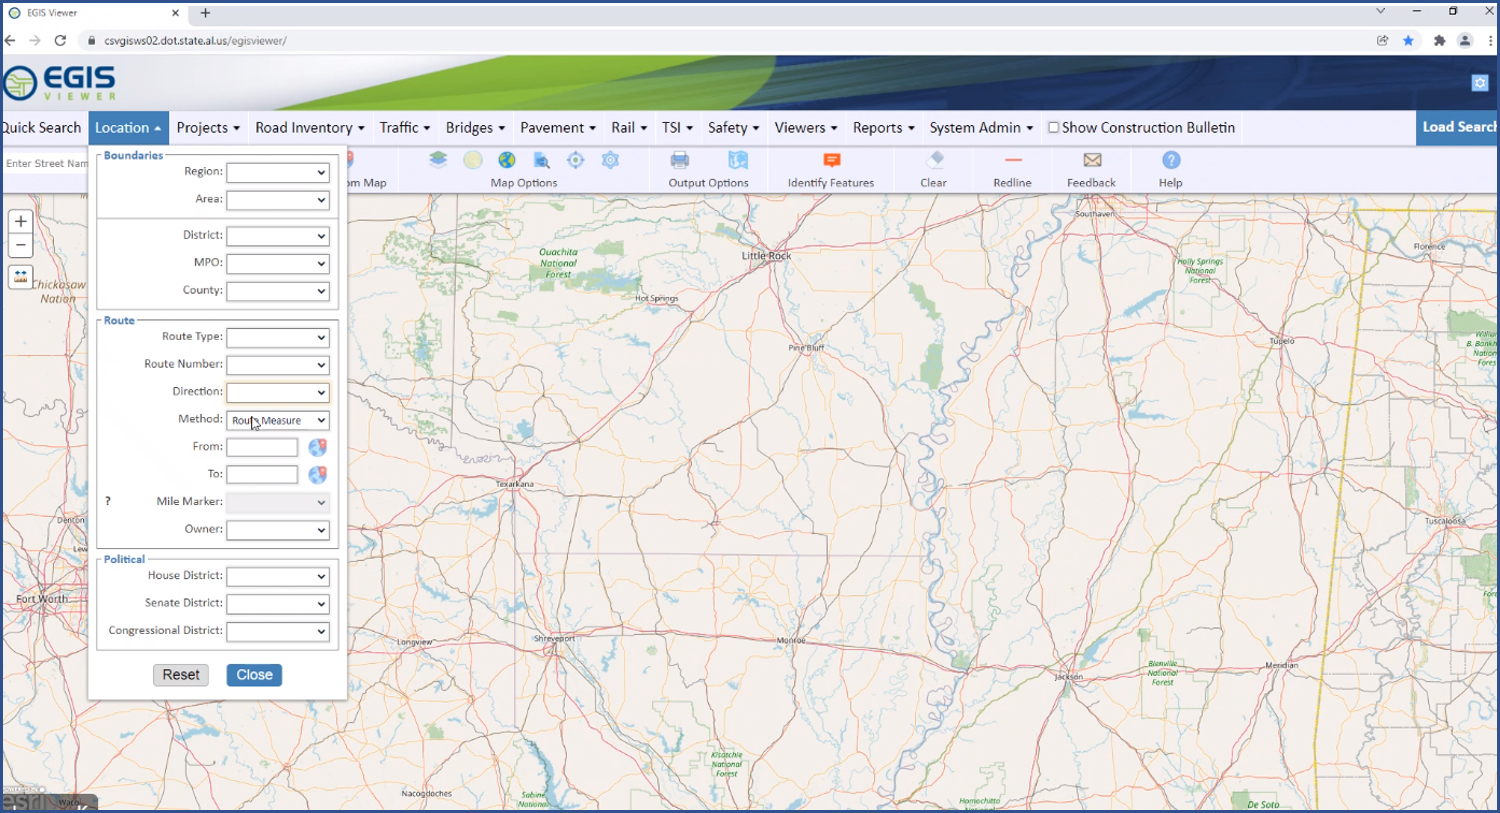
Figure 3. Illustration. eGIS data viewer, ALDOT.
ALDOT’s eGIS viewer uses the last five years of crash data and is utilized by many traffic and safety engineers and other personnel in ALDOT. It has filled some of the gaps of the previous system. Other ALDOT systems also leverage the crash data through the LRS data. One of the main issues the LRS/GIS unit has is being able to update new routes in the roadway layer in a timely manner. There is no fast way to know and automate when routes are being updated statewide, though this newer location process does reduce time updating and inputting crash data and routes by several weeks. The GIS/LRS Data Management Unit is looking to form a partnership with E911 to speed the process of identifying new and updated routes.
2.2 Oregon DOT (ODOT)
Oregon DOT (ODOT) uses two applications that work in tandem to compile motor vehicle crash data and locate crashes, the Crash Data System (CDS) and the Crash Locator Tool (CLT). The CDS is a SQL server database system that includes a desktop application for inputting crash data received from crash reports and from the CLT. The CLT is a web-based, mapping application used in-house to geolocate crashes and input roadway attributes of a crash. These applications have been used by ODOT since 2007. Prior to developing CLT, the ODOT GIS unit only mapped State highway rashes, not local roads.
The GIS unit is responsible for developing, maintaining, and updating the CLT. The GIS unit consists of 13 employees, including two developers. It is also responsible for the map services and data used in the CLT application. The ODOT’s Crash Analysis and Reporting (CAR) unit is responsible for using the CDS desktop application and CLT to locate crashes and for crash coding. CAR has 19 employees in the unit, several with a high level of programming experience. The CAR unit evaluates crash information, investigates crash locations, enters data, and performs programmatic, visual, and manual QA/QC on the crash data. The unit has an extensive Crash Analysis and Code manual and a CLT Guide used for entering and verifying the data.
The crash data collected uses similar attributes to the Model Minimum Uniform Crash Criteria (MMUCC) and tries to be in synch. ODOT has 35 years of data, but only the last 13 years include the road spatial component. To locate a crash, the CAR unit uses the crash and driver report forms, which describe the crash location. They geolocate the crash using the CLT.
The CLT mapping interface (see Figure 4) has the ability to navigate to Highway Mile point or LRS Mile point, latitude and longitude, city, and intersection. It includes multiple zoom levels. The three smaller scale levels are a base map with three view types: street, hybrid, and aerial. When fully zoomed, the map view switches to a dynamic street map layer. This level is used to snap a crash point on a road segment or highway milepost. Then it automatically populates a form with attribute data from the roadway layer at the crash location. After verification, the data is passed to the CDS Data Entry screen to be verified and loaded into the CDS database.
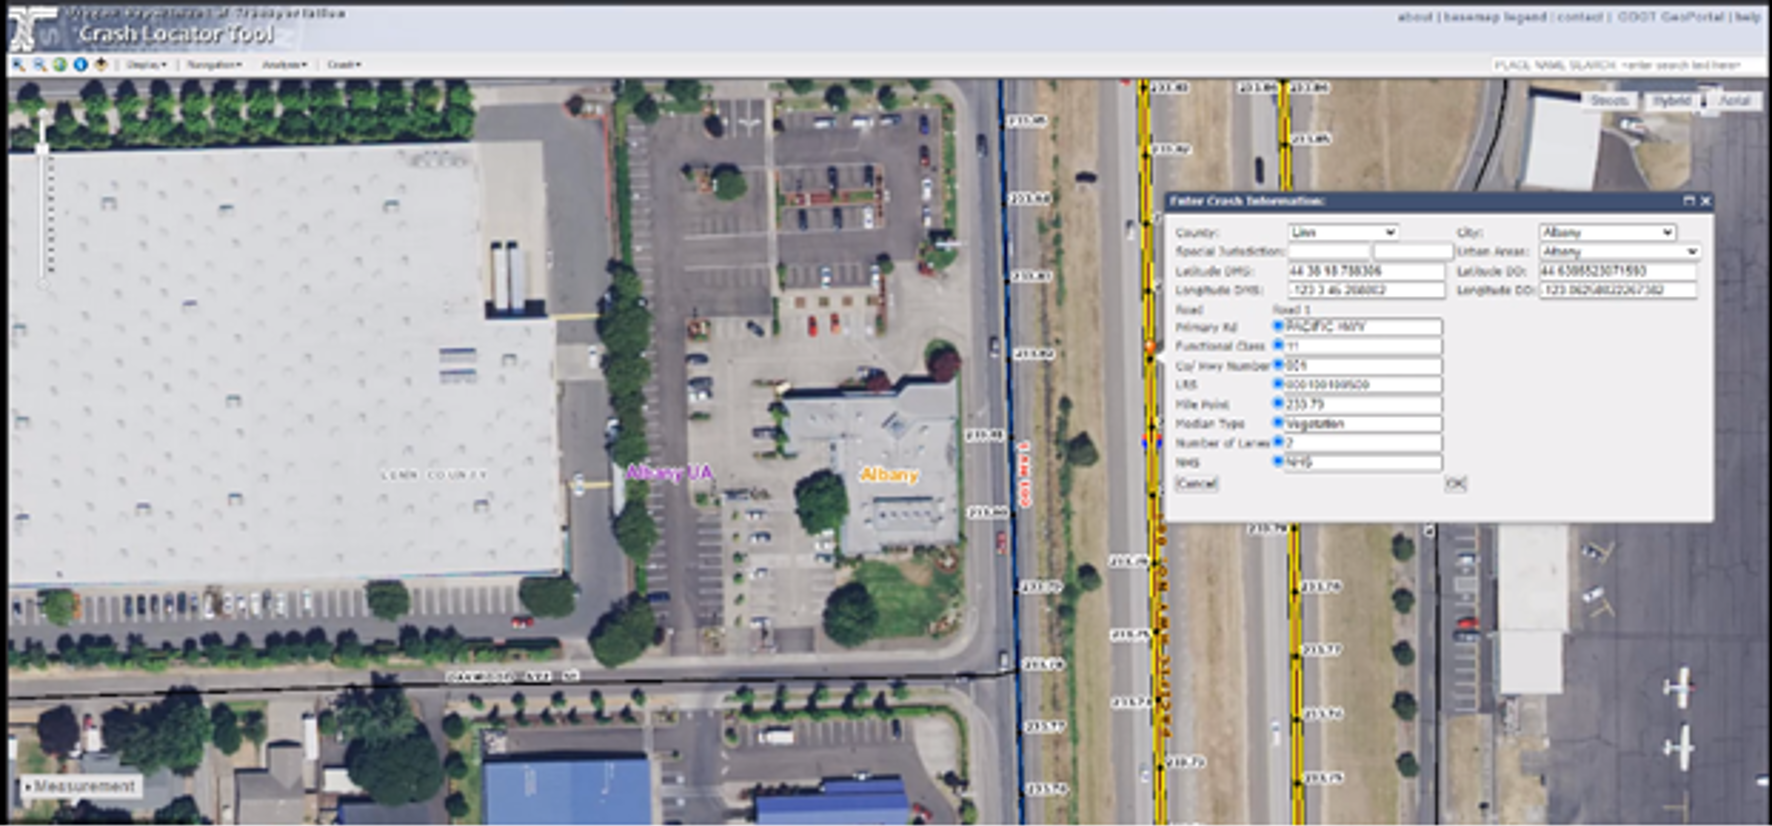
Figure 4. Illustration. CTL mapping interface, ODOT GIS unit.
The CLT has gone through several versions of the back end being updated. It was originally built on a stripped-down version of ODOT’s TransGIS application built on the ArcGIS JavaScript 2.8 API (JSAPI). The CLT is currently being updated, replacing the legacy functionality that was passing data from a database client server to a web-based application, to an integrated CDS client server database system.
ODOT lists five major components to the current CLT upgrade project:
- Refactor the CLT web application to use the 4.x JSAPI.
- Decouple CLT from the CDS application to run inside a standard browser window.
- Develop web API to handle communication with the database.
- Create a new table within the HCDS database that will store new and edited records passed from the CLT application.
- Update CDS interface to include a button that will retrieve and load a current record into the CDS form for validation.
The new version will make the tool a more efficient mapping application and will help reduce the need for GIS maintenance support.
The data collected and processed using CLT and CDS is applied to several ODOT applications that utilize crash data in both public and private agencies. The All-Roads Transportation Safety (ARTS) program uses text data and GIS spatial data created by ODOT, as well as the Oregon Adjustable Safety Index (OASIS), which is a crash analysis tool used by traffic engineers. A GIS layer called the State Priority Index System (SPIS) has also been created utilizing crash data. SPIS is used as a “screening tool” to identify areas that have higher instances of crashes and to prioritize which sites will benefit the most from safety improvements. The ODOT CAR unit also receives may requests for crash queries from multiple sources and produces outputs in the form of maps, reports, and summary output. CAR also produces yearly crash maps and reports on yearly rates.
The Oregon Transportation Safety Data Explorer (OTSDE) is a publicly accessible, web-based GIS tool that supports ODOT safety work. The user is able to visualize corridors in the mapping interface, filter crash data based on all crash attributes, and produce graphs and reports that can be exported and printed. The extensive crash filter capabilities have some set common filters such as State highway crashes, local network crashes, and injury severity. It is also possible to set other filters that allow a user to create multiple, detailed cumulative filters. (See Figure 5.)
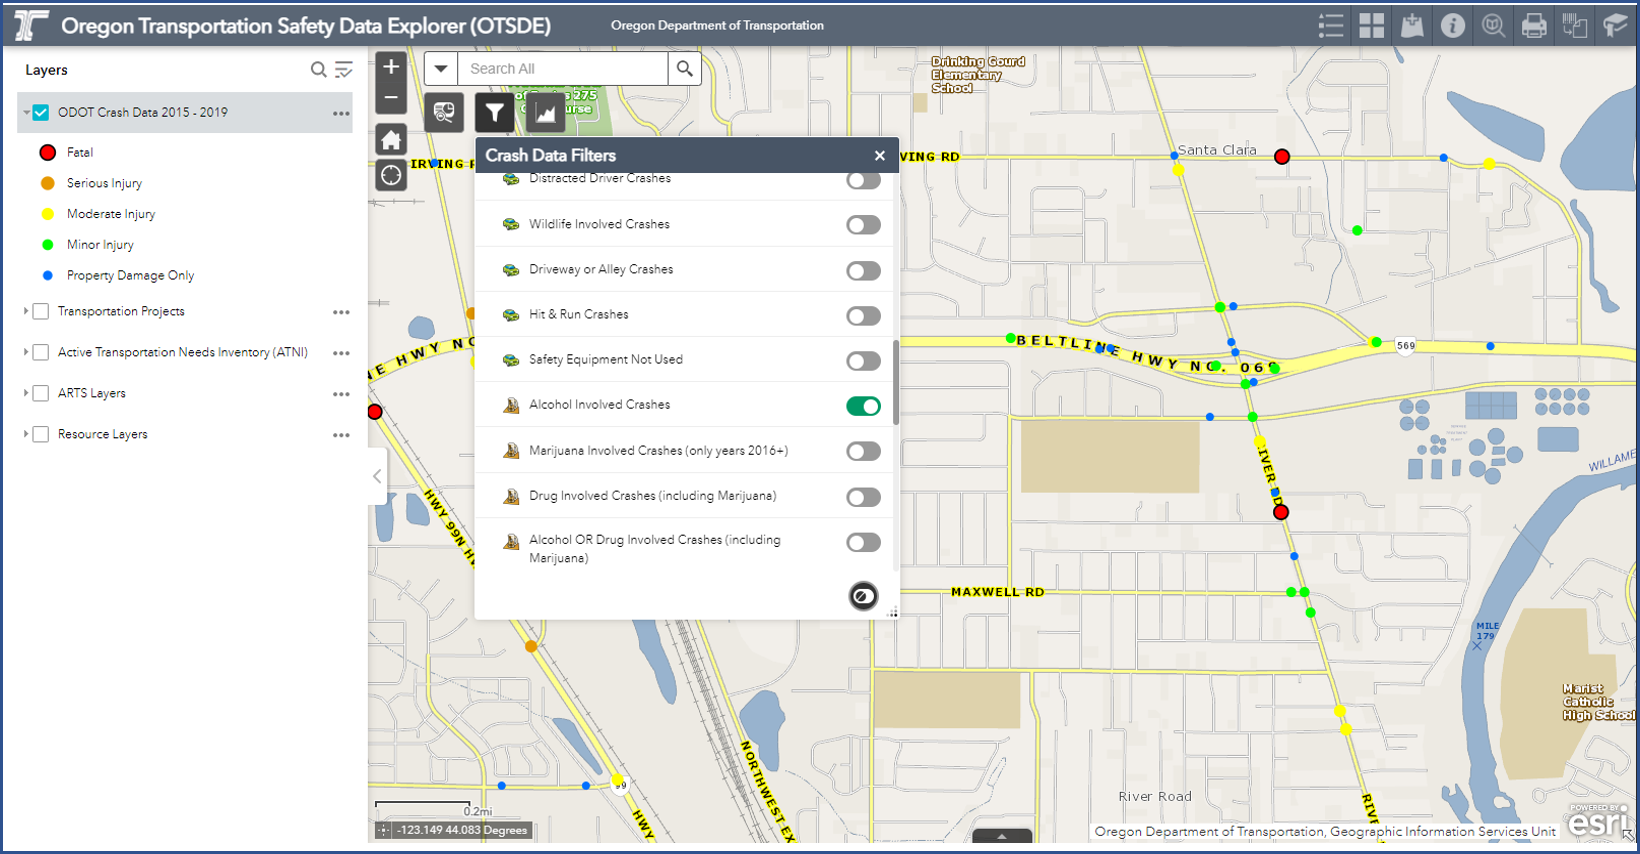
Figure 5. Illustration. OTSDE mapping interface with crash filter menu, ODOT GIS unit.
2.3 New York DOT (NYSDOT)
The State of New York has been utilizing crash management systems since 1996 to locate, manage, and analyze crash data in order to maintain and improve road safety. Over the past 25 years, systems have been developed and upgraded to better meet NY State and FHWA safety standards and reporting. The NYSDOT Traffic and Safety Department is responsible for maintaining crash data and analysis systems. The main office of the Traffic and Safety Department employs five to six staff members plus staff in 11 regional offices. The staff includes members with GIS experience, though the GIS unit is located in the IT department. The Department of Motor Vehicles (DMV) is the official source for crash data. The DMV works jointly with the Traffic and Safety Department. Its staff includes three managers and seven full-time location coders.
The process for collecting and geolocating crash data starts with the police department who use their Track Traffic and Criminal software to electronically report crashes. The police are also able to capture the GIS coordinates of a crash site in the field with this software. A different type of crash locating is used by the New York City Police Department. They developed their own electronic reporting system and used an address to get GIS coordinates through reverse geocode. The police departments’ crash data is then sent to the DMV where it is maintained and updated. For location verification the DMV uses the DOT’s automatic system that has an algorithm with accuracy thresholds. If the initial location fails, the accuracy-test is sent to a manual coder. The DMV crash data, including the crash coordinates and reference marker, is sent to NYDOT nightly and is stored in both the DMV and NYDOT databases. There is a continual back and forth between the DOT and DMV, and their systems are well integrated. The State stores crash data from 2007 to the present, with older legacy data being retired.
Several systems have been used over the past 25 years to collect crash data, locate crashes, and analyze the data. The Safety Information Management System (SIMS) was the first computerized system used by DMV and NYSDOT for locating crashes and storing crash data. It went into production in 1996 and is Oracle based. It stores the crash data and locates crashes using LRS rather than GIS coordinates. The State has field posted signs and keeps an inventory of the crash locations and their attributes, with a crash being assigned to a reference marker, though the reference markers were only located on the State road system. SIMS is still used for some reporting such as volume data to determine crash rates and to identify hotspots.
A second system, the Accident Location Information System (ALIS), went into production in 2008 after several years of development and is used by government employees only. ALIS is a web-based, GIS application and was developed to add GIS coordinate locations since the reference markers were only located on the State road system, as well as to automate the processing of electronic data from the police department. ALIS is an internal suite of applications used by government employees. One application is for location coding and editing. This is the tool that the DMV location coders use to refine the crash locations if needed. The location data is then also integrated with the SIMS crash data. ALIS also has a simple query recording and analysis application (SQRA), which is used by DOT and other agencies to query the crash data for analysis, look at roadways, and develop reports. The most recent version of ALIS was developed on the Microsoft Silverlight platform. The Silverlight web development platform is no longer supported, which is one of the reasons that ALIS is now in the process of being replaced with a new system.
The Crash Location and Engineering Analysis Repository (CLEAR), the State’s safety management tool, is the newest application, which is being implemented this year. CLEAR will replace all prior crash systems. The first phase is to replace all the ALIS functionality and implement a mile point system for all public roads. The second phase is to implement the State’s Highway Safety Management System, which will include all the analysis functionality of SIMS and ALIS, including all the network screening and systemic screening. CLEAR will also improve management processes and methods and align with the AASHTO Highway Safety Manual. CLEAR uses SQL Server and ESRI technology, including the ESRI Portal for users and roles. VHB, an engineering firm contractor, designed and developed CLEAR.
CLEAR consists of several modules which include modules for geocoding and editing crashes, and the safety application. The geocoding and editing modules are similar to ALIS. The CLEAR safety interface includes several dashboards and has the capability to query all the data available in the crash database (Figure 6). It is also only available through a login to government personnel, which includes State, local, metropolitan planning organizations (MPOs), and law enforcement. The CLEAR mapping functionality displays segments and intersections as well as clusters and hotspots. It has multiple layers including roads and highways LRS, roadway attribute event layers, myar elements, intersections, polygon and point intersection crashes, boundary layers, and Capital project data. Safety investigations and their recommendations are also included. An example of tracking a safety investigation recommendation in CLEAR would be to determine whether a recommendation to put in a crosswalk to reduce crashes at a hotspot was completed or something else done. Every screen in CLEAR can be output as a map, Excel file, PDF, notes, and photos. Output also includes canned reports and police reports.
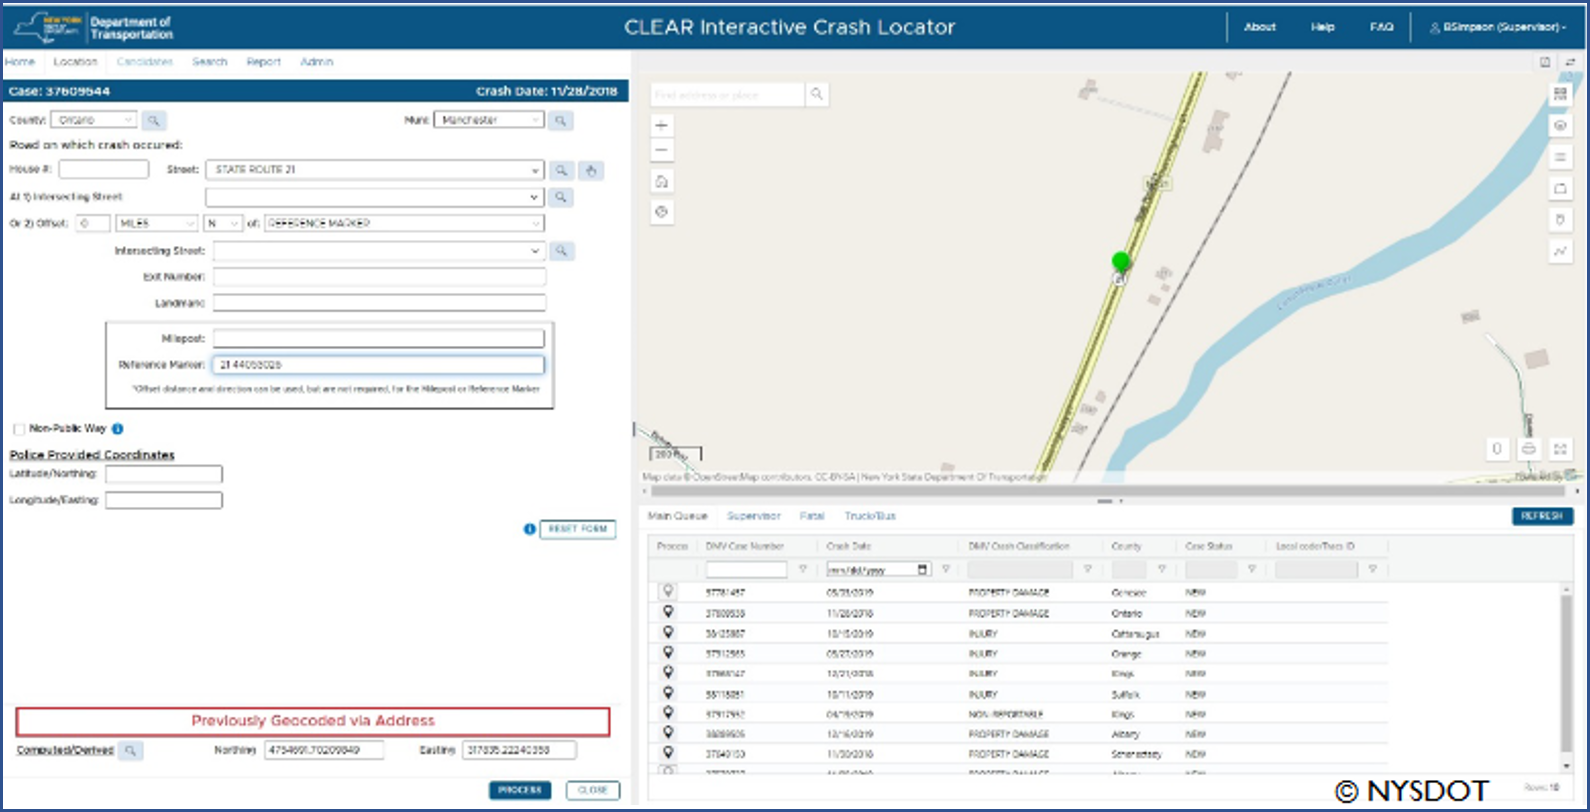
Figure 6. Illustration. CLEAR interactive crash locator.
NYSDOT has always been safety focused, using safety analysis for decision making since 1996. Planning and investment decisions use crash data for guidance, such as pre-design proposals. With the implementation of CLEAR, the agency is trying to make sure that safety considerations are put upfront in all the agency’s projects.
2.4 North Carolina DOT (NCDOT)
Several NCDOT divisions have been involved in crash data collection, location, and analysis using multiple interfaces. The North Carolina Department of Transportation’s (NCDOT) Mobility and Safety Division’s Traffic and Safety Unit carries out State and Federal programs related to traffic safety. The unit includes about 35 employees, about half of them in the central office and the others spread across the State into eight regional divisions. They are responsible for all aspects of traffic safety including analysis, field investigation, and project development. NCDOT’s Division of Motor Vehicles (NCDMV) is responsible for collecting and managing the State’s crash data, and NDOT’s GIS unit is responsible for maintaining a tabular LRS system and creating spatial datasets.
DMV inputs the crash data into the crash database. About 80 percent of the crash reports come directly to the crash database electronically. DMV manually enters the remaining 20 percent or so that come in via paper. The data includes 250 crash-related attributes. The Traffic and Safety Unit is responsible for geolocating each crash on the system of record for NCDOT-maintained roads using LRS, a GIS-maintained roadway network used by TMSD to update the tabular LRS maintained in the Traffic Engineering Accident Analysis System (TEAAS) applications. NCDOT’s system for analyzing crash data, TEAAS, is available as a free download for government agency personnel, which includes State government personnel, local municipalities, law enforcement agencies, planning organizations, and research entities. TEAAS contains traffic crash data for the past 30 years, as well as ordinance information for all State-maintained roads and highways and contains query and report functionality. Though it does not contain a mapping component, a user can export the data from TEAAS and make it spatial fairly easily.
An algorithm is run nightly using the location information collected on the crash report form (county, on road, from road, offset) in an attempt to locate each crash linearly along a route. A county route milepost value is assigned to the crash that can then be made spatial when joined to the LRS. The majority of the crashes are located this way. Manual geolocating is also done for specific crash type, such as fatal and serious injuries, pedestrian and bicycle crashes, and commercial motor vehicle crashes. Outside agencies are contracted to help manage the manual geolocating.
The traffic records systems currently in use for crash collection, location, and analysis have been used for over 20 years and are built on outdated technology. Since crash data plays such an important role in roadway design and safety, the North Carolina legislature has mandated that the current crash systems be replaced. The University of North Carolina at Chapel Hill Highway Safety and Research Center (UNC HSRC) has been contracted, along with other supporting firms, to plan, develop, and deploy a modern web-based solution for collecting, storing, managing, and analyzing high-quality crash data. The system will be highly automated and include electronic submission of crash reports. This system, called N.C. Crash Reporting Information System (NC CRIS), has four phases, from planning to deployment. It is currently in the second phase, Design, which includes scoping and refining. The completion of all phases is projected to take at least four to five years from 2022.
NCDOT’s Traffic and Safety team are also involved in other work utilizing crash data. The team fields requests from external users for ad-hoc queries and maps. They also publish crash maps and data to ArcGIS online to make it available to the public. NCDOT’s Safety Evaluation group uses crash data to evaluate the effectiveness of our safety improvement projects and they have increased usage of mapping for this purpose. Projects in the State are selected in a data-driven way, and safety is one of the criteria. Each project gets a safety score based on the data from the traffic safety team.
2.5 Connecticut DOT (CTDOT)
Connecticut DOT (CTDOT) has contracted with the Connecticut Transportation Safety Research Center (CTSRC) at the University of Connecticut (UCONN) to develop the web-based applications, Connecticut Crash Data Repository (CTCDR) and the Connecticut Roadway Safety Management System (CRSMS). CTDOT’s Division of Traffic Engineering, Safety Engineering Unit and Bureau of Policy & Planning work closely with CTSRC developing CTCDR and CRSMS. The CTSRC’s division responsible for the applications has seven full-time employees with skills including software development, GIS, traffic engineering, database administrators as well as students, while the CTDOT Safety Engineering Unit employs nine engineers. The goal for developing these applications is to implement roadway safety management processes, network analysis, appraisal, project prioritization, and to select countermeasures.
The CTCDR is a web-based tool for the traffic safety community to access State motor vehicle crash information collected by State and local police. Since 2015, the police have been submitting crash reports electronically to CTDOT. They also have the ability to geolocate crashes in the field by capturing their location on their phone or tablet. Once a crash is geolocated, UCONN students then do quality control using a customized desktop crash editing tool to make sure the location is accurate. The CTCDR is the definitive crash database for the State of Connecticut and is updated nightly. It contains motor vehicle crash data from 2015 to the present, which follows MMUCC guidelines, as well as pre-MMUCC crash data from 1995-2014. It is a web-based interface that provides tools for both basic and advanced users to access the database. With CTCDR, users can query, analyze, and create reports as well as create hotspot maps. CTCDR requires a login but can be accessed by anyone for information and research purposes. (See Figure 7.)
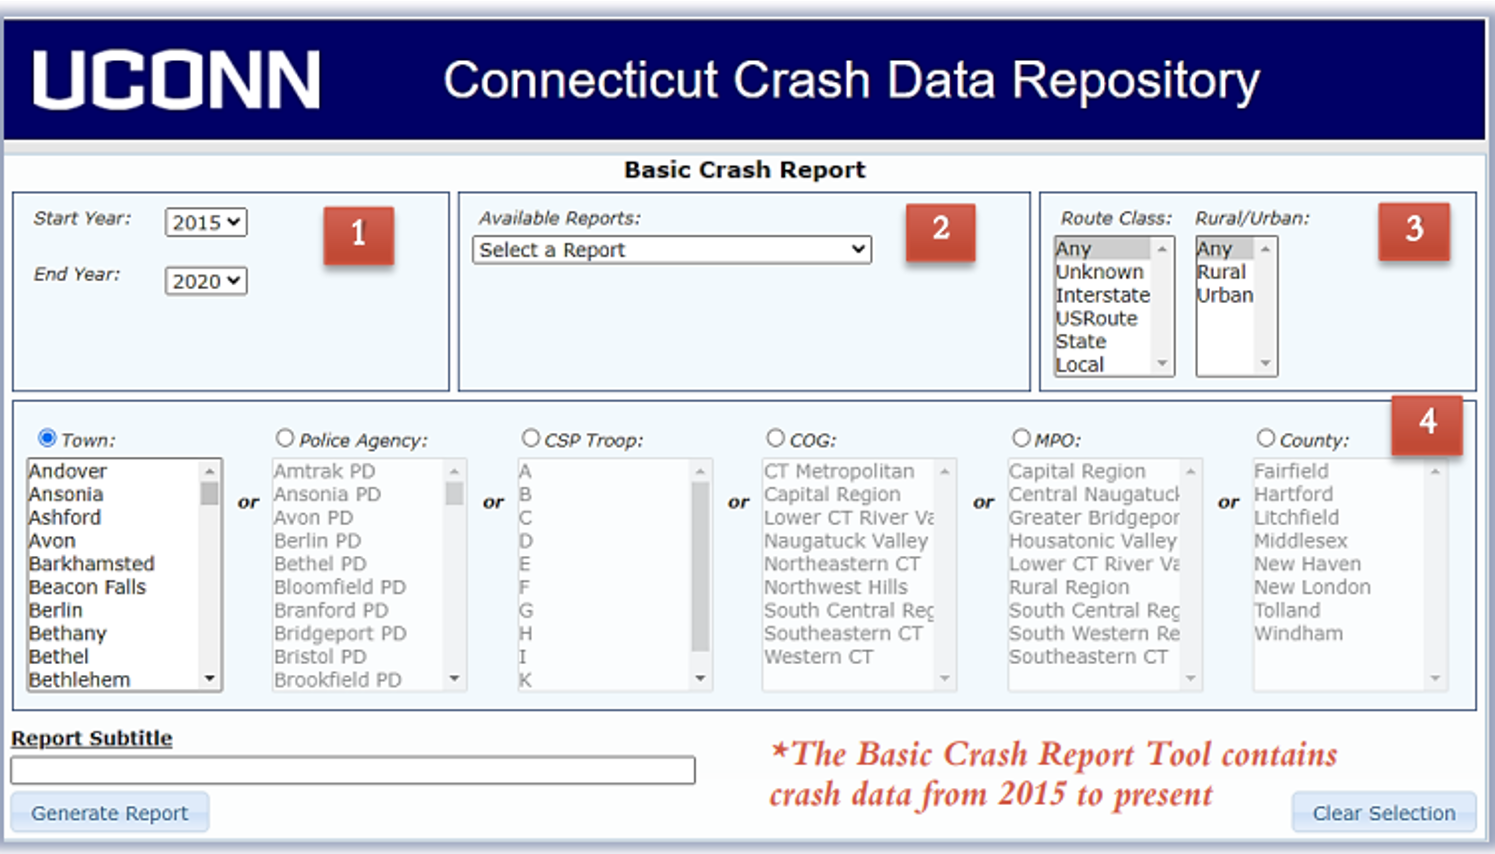
Figure 7. Illustration. Connecticut Crash Data Repository Interface, UCONN, CTCDR.
In 2016, CTDOT and UCONN started developing CRSMS, an enterprise-level web application. The system is built on Angular JavaScript and C#.NET, with the database in Microsoft SQL Server. It also uses ArcGIS API for JavaScript to build the map-related components. Before this system was developed, a simple system was used to give surveillance study sites location-based critical crash rates. The process for designing CRSMS followed the AASHTO Highway Safety Manual (HSM) methods, a six-step safety management process. The first two modules were released for use in 2019 and the remaining tools in 2020. More analysis modules will be developed through 2025. The six analytical modules plus a data management module include network screening, diagnosis, countermeasure selection, economic appraisal, project prioritization, and safety effectiveness evaluation. CRSMS is available through registration to local and State government employees as well as FHWA.
In CRSMS, you can view and print maps and data such as crash locations, top crash sites, collision diagrams, and summary statistics as well as download individual crash data in MMUCC format. Modules include various tools to identify factors contributing to areas of high crash location and include various pre-defined reports dealing with Crash, Vehicle, and Person Information. (See Figure 8.)
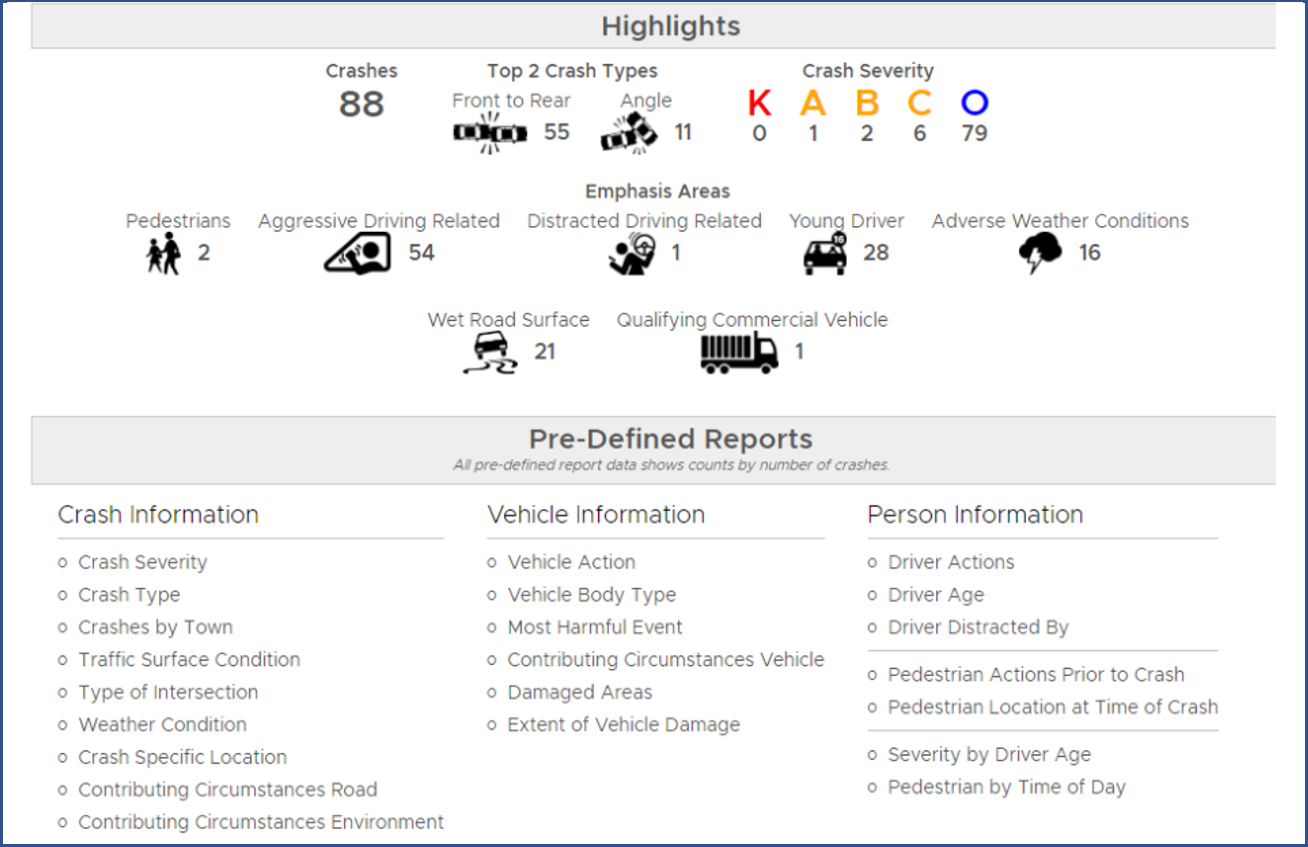
Figure 8. Illustration. Pre-defined reports, CRSMS, UCONN, CTSRC.
Long description
CTDOT has been training end users in CRSMS. As people have gotten used to the system, they are realizing that it is user-friendly and that having all the information in one place is beneficial to their work. Not only are users finding CRSMS easy and efficient for selecting project locations, but it also helps with economic analysis. Other ways the tools are being utilized is for impact studies to compare crash locations, find trends, and to help initiate and rotate projects. CRSMS is helping CTDOT in data-driven decision-making and initiating projects based on timely and accurate data, though it will take a few years to truly realize its impact on roadway safety in Connecticut.
Return to Table of Contents
3. Lessons Learned
Agencies collect and analyze crash data for the purpose of improving road safety and building a safer transportation network. Agencies’ techniques for geolocating, and applications used for crash analysis are varied. This section of the report features advice and lessons learned from agencies regarding how they geolocate motor vehicle crashes, maintain and update crash and roadway databases, create a process for crash data collection through crash analysis, and how the data is used for project prioritization and decision-making.
3.1 Crash Data Collection Process and Geolocating
All States’ crash data collection and analysis process start with crash data collection by police officers. Originally crash data was collected on paper reports and then manually entered into a database. The data collected by the States is either MMUCC or has similar attributes. Several States already have, or are planning to have, officers collect the data electronically in the field to automate the process. The technology requires a tablet or laptop and often includes a map that allows the officer to geolocate the crash site on a map. The officers may also have a GPS device to enter coordinates. After the data is entered into the crash database some States have an automated process to verify the location, as well as a person manually verifying the location using a desktop GIS editing application. Other States without electronic geocoding and automated verification locate the crash manually from addresses and other physical descriptions in the crash report and by using a GIS desktop application.
The data collection process often involves multiple agencies, such as the police department, DMV, DOT engineering and planning divisions, and outside contractors. All the agencies involved need to coordinate the process from data collection, data input into the database, data verification, and making the data available for various uses. Issues that have arisen include training police officers to use new technology in the field and to be comfortable transitioning and using the technology. With so many agencies involved, States have found that communication is key as well as minimizing the number of people involved.
Another issue is maintaining a central crash database. Several States have a definitive crash database that is maintained by the DMV, but the State’s DOT also maintains a copy of the database. It is then necessary to have an automated process to update the DOT database regularly from the DMV database. Other States maintain one database or, in the case of Connecticut, UCONN maintains the database and all analysis applications.
Another dataset that is essential for geolocating crashes is an accurate roadway layer. Several States use LRS data to locate a crash, which has limited location to State roads. States are moving to using route and milepost systems and coordinates to be better able to locate crashes on all roads in a State.
An accurate route layer is essential for locating crashes, but several States indicated that it can be a challenge to maintain the layer. Roadway characteristics are constantly changing year to year, and it has been difficult to capture the changes in a timely manner to update the layer and correlate it to the year a crash took place. To remedy these discrepancies, one State is interested in partnering with the State’s E911 to be able to more quickly identify new roads and changes.
3.2 Crash Analysis
States have various ways in which they allow users to access the State’s motor vehicle crash data. Some States have a desktop or web application to allow internal users or local and State government employees to query crash data and create maps and reports for their research. These applications usually have a GIS component to analyze crash location and attribute data such as viewing individual crash sites and identifying crash clusters and hotspots and ways for users to access. ALDOT applications include eCrash and eGIS for internal use to input and view crash data. ALDOT also has several public and internal portals to view and query data using the traffic safety software CARE developed by UA CAPS. ODOT uses the CDS desktop application for inputting crash data and the CLT web-based mapping application for geolocating crashes and inputting roadway attributes. It also has OTSDE, a publicly accessible, web-based GIS tool for viewing and querying crashes. State GIS or Safety agencies may also receive ad-hoc requests for crash maps and reports and put crash data and maps on a portal for access.
Over time States have updated their crash analysis tools as technology has changed. Some States are creating systems that are all encompassing and follow the AASHTO Highway Safety Manual. This includes NYSDOT, which is developing CLEAR and CTDOT in conjunction with UCONN, which is developing CRSMS. These are large projects with multiple modules, spanning several years. In all processes of updating or creating new applications several lessons have been learned.
When designing a new application, creating a project in phases can have different results. New York State split their project into two phases but found that this created issues. Some crash data collection and analysis capabilities were transferred to a new application, but part of the old system was still being used for other functions. The data was then located in two separate locations and there was an issue with keeping the data in sync between the two systems. North Carolina found that trying to implement everything at once was very difficult, and that it was beneficial to develop a new system in stages. Either way, both States determined that it was important to make sure data transfers flow smoothly and to stick to the pre-determined schedule as much as possible. Alabama thought that in the past there were too many people involved in trying to create a new application. The State determined that it is important to create a set process and stick to it. It is also important to make sure all stakeholders are involved in every step of the process and that they understand the process.
Another issue in upgrading or designing a new crash analysis application is the collection of data and maintaining accurate and consistent data. Data is critical for crash analysis applications. Besides the crash data, additional GIS layers and other relevant data are needed for the application. States found that a significant amount of time was spent trying to collect all the data. Many of the datasets were located in different agencies or DOT divisions, managed by different groups for their individual needs. It was determined that it was worthwhile to put the effort into getting all the teams together so as to identify the data needed, where it was located, and to identify data gaps and how you can fill them. Also, making sure all the stakeholders understood that putting and maintaining all the data in one central database was beneficial to everyone.
Once a new system or application is ready for use, the next hurdle is getting people to use the application. People are often used to working a certain way and can be resistant to change. Training and getting the people involved with roadway safety to realize the capabilities of a new crash analysis system can be a challenge. Agencies are conducting demonstrations and marketing their application to different groups as well as training staff to use their application. Project managers and staff involved in all traffic and roadway projects need to be educated in the benefits to their agency in using the crash applications and how they can help the agency make data-driven decisions.
Return to Table of Contents
4. Summary and Next Steps
This report highlighted State DOTs that have been able to use GIS and geospatial tools to allow safety analysts to produce better crash analyses. The DOTs of Alabama, Oregon, New York, North Carolina, and Connecticut have taken advantage of better crash location data and the improved processes involved, but this work is an ongoing process. Crash location and crash analysis are essential elements toward creating solutions that improve roadway safety. While the technology exists to produce more effective crash analyses, strategies for implementing new policies that make it easier to find or share crash location data and updating the way DOTs perform crash analyses are still needed. Effective examples of these strategies or efforts highlighted through webinars, peer exchanges, or case study reports can help more State DOTs continue to reduce fatal crashes.
Return to Table of Contents
Appendix A: Case Study Participants
| Agency |
Department Type |
Name |
Title |
| ALDOT |
GIS |
Jeromy K. Barnes |
GIS/LRS Administrator |
| UA |
CAPS |
Steve Burdette |
Assistant Director |
| ODOT |
GIS |
Brett Juul |
GIS Unit Manager |
| ODOT |
Crash Analysis |
Robin Ness |
Crash Analysis and Reporting Unit Manager |
| NYSDOT |
GIS |
Robert Zitowsky |
GIS Coordinator |
| NYSDOT |
Traffic Safety |
Andrew Sattinger |
Safety Systems Management and Development Coordinator |
| NCDOT |
Safety Planning |
Brian G. Murphy |
Safety Planning Engineer |
| NCDOT |
GIS |
Katherine Cotney |
Project Manager |
| CTDOT |
Traffic Safety |
Natasha Fatu |
Transportation Supervising Engineer |
| UCONN |
CTSRC |
Shanshan Zhao |
Research Scientist |
Return to Table of Contents
Appendix B: Interview Guide
Background
- Agency details:
- What is your role within your agency?
- Approximately how many employees work for your organization?
- What department or team is responsible for creating and updating the crash database?
- What department or team is responsible for crash location for mapping?
- What department or team is responsible for crash analysis applications and mapping?
- How many people are involved in these activities?
- What is the technical capacity of your team?
- Crash mapping and applications:
- Are you developing any new GIS-based tools to use crash data?
- Is this the first time that your agency has utilized crash data in a GIS-based application?
- Before starting the GIS-based crash application, how did or does your agency use crash data?
- Has your agency changed or improved these tools since first implementation?
Purpose
- What problem(s) was this project intended to solve?
People
- Who were the main stakeholders in this project?
- Did this project require work across departments? Who championed the project?
- Did your agency partner or engage with any outside partners? If so, who?
Process
- Walk us through the collection of crash data and crash location at your agency:
- Does your agency use the National Highway Traffic Safety Administration (NHTSA) form Model Minimum Uniform Crash Criteria (MMUCC) collecting crash information? If not, does the form used have similar attributes?
- How is your crash database updated and maintained?
- How many years of data do you have in the database?
- Is the location of a crash determined with GPS coordinates, or an address?
- If an address is used, how do you geolocate the addresses?
- What software do you use for the crash database?
- Walk us through how you use the crash data:
- Do you have a crash analysis application that has a GIS component?
- Can you describe the process for designing the crash analysis application, including the functionality and aesthetics?
- Was the development of your tool(s) completed in-house or contracted out?
- What map layers are included in your crash analysis application maps? Crashes, road network, intersections, boundaries…?
- What types of maps does the application create? Locations, clusters, hot spots…?
- Does your application include a dashboard?
- What types and how many attributes are used from the crash database for queries in your applications? Location, people involved, weather factors, road factors…?
- What output can be produced by your application? Maps, tables, charts, reports…?
- What GIS software, platforms and other technologies did you use to create the tool?
- How does this GIS tool interface with other systems at your agency?
- Is your application public or only available to state personnel?
- Do you have other uses for the crash data besides using in a crash analysis application?
Reactions
- What have been the reactions of internal and external stakeholders to your GIS data/tool(s)?
- If there were intended end user groups, do these groups use the GIS data/tool like you imagined they would?
- How has the GIS-based crash analysis application or other uses of crash data changed your business practices?
- Has the organization changed any decisions based on this data?
- Have other users changed any decisions based on this data?
- Has the organization changed any investment decisions based on GIS-based crash analysis?
- Are there limitations to using the GIS-based crash analysis application? Are there plans to mitigate these limitations in the future?
- Does your agency plan to undertake any other projects utilizing crowdsourced data? Have they already?
- What lessons did your team learn while working on this project?
- Has crash analysis application and mapping impacted safety in your agency’s jurisdiction? Is there any data to support that?
Next Steps
Thank you very much for taking the time to speak with us today. We will take the info from this interview and several other interviews that we are conducting to develop a summary of all case studies and key takeaways. After we draft the text, we will email you a copy for your review.
Return to top

